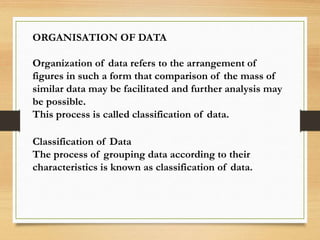
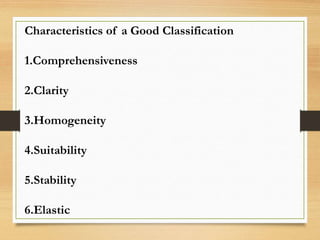
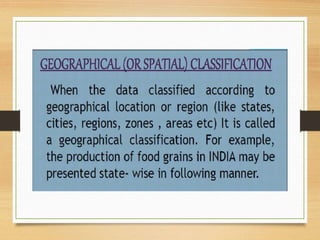
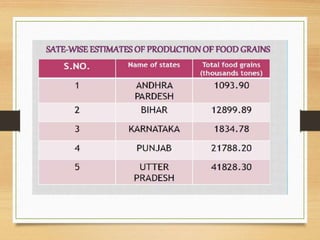
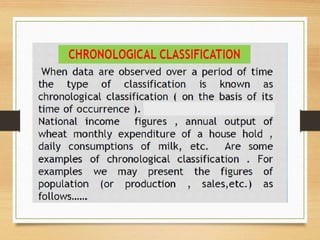
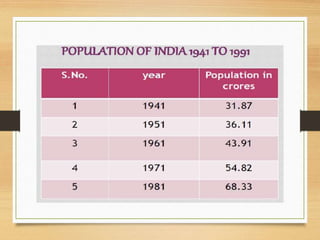
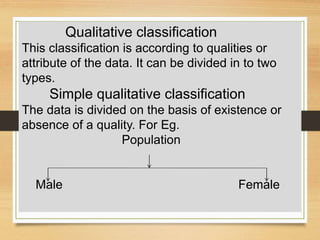
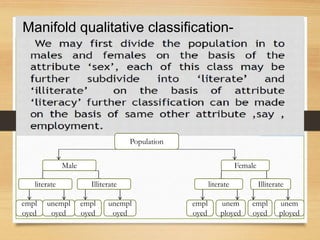
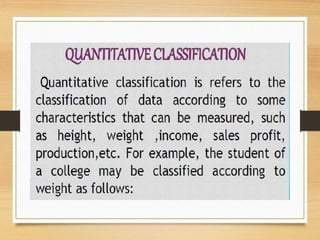
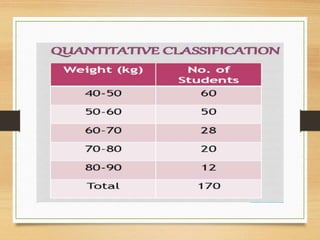
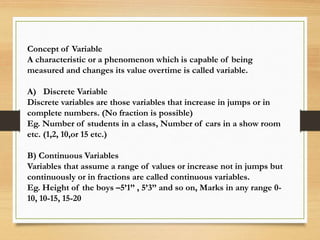
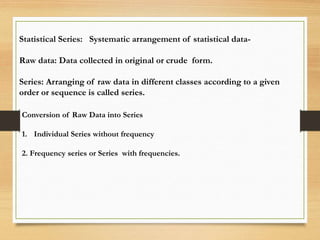
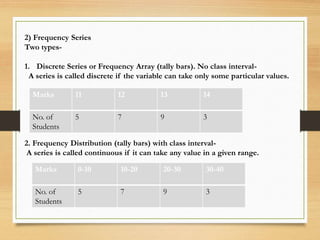
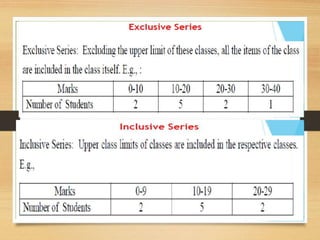
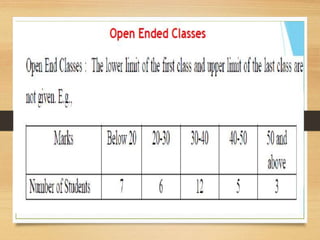
This document discusses the organization and classification of data. It defines classification of data as the process of grouping data according to their characteristics. The objectives of classification are to simplify complex data, facilitate understanding and comparison, and make analysis and interpretation easier. A good classification is comprehensive, clear, homogeneous, suitable, stable and elastic. Qualitative classification divides data based on the existence or absence of qualities, while manifold qualitative classification further divides the data into subgroups. Variables can be discrete, taking whole number values, or continuous, taking values along a range. Statistical series involve arranging raw data into individual series listed numerically or in order, or frequency series which indicate how many observations fall into each class or value.
![Objectives of Classification:
a] To simplify complex data
b] To facilitate understanding
c] To facilitate comparison
d] To make analysis and interpretation easy.
e] To arrange and put the data according to
their common characteristics.](https://image.slidesharecdn.com/pptpresentation-week3classxi-200723124202/85/Census-sample-methods-of-collection-of-data-23-320.jpg)
![1] Individual Series: The arrangement of raw data individually
Individual Series can be expressed in two ways.
a] According to Serial Numbers-
Roll Number Marks
1 30
2 25
3 15
4 30
5 25
b] Ascending or descending order.
In ascending order, smallest number is placed first. For Eg. Marks- 30,25,15
In descending order, the highest number is placed first. For Eg. Marks- 15,20,30](https://image.slidesharecdn.com/pptpresentation-week3classxi-200723124202/85/Census-sample-methods-of-collection-of-data-35-320.jpg)
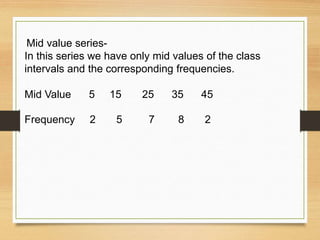
![In constructing continuous series we come across terms like:
a] Class : Each given internal is called a class e.g., 0-5, 5-10.
b] Class limit: There are two limits upper limit and lower
limit.
c] Class interval: Difference between upper limit and lower
limit.
d] Range: Difference between upper limit and lower limit.
e] Mid-point or Mid Value: Upper limit -Lower limit
2
f] Frequency: Number of items [observations] falling within a
particular class.](https://image.slidesharecdn.com/pptpresentation-week3classxi-200723124202/85/Census-sample-methods-of-collection-of-data-37-320.jpg)
![Cumulative Frequency Series:
It is obtained by successively adding the frequencies of the values of the classes
according to a certain law.
a] ‘Less than’ Cumulative Frequency Distribution :
The frequencies of each class-internal are added successively starting from the
lowest value of the variable.
b] ‘More than’ Cumulative Frequency Distribution:
The frequencies of each class interval are added successively starting from the
highest value of the variable to the lowest value.](https://image.slidesharecdn.com/pptpresentation-week3classxi-200723124202/85/Census-sample-methods-of-collection-of-data-40-320.jpg)