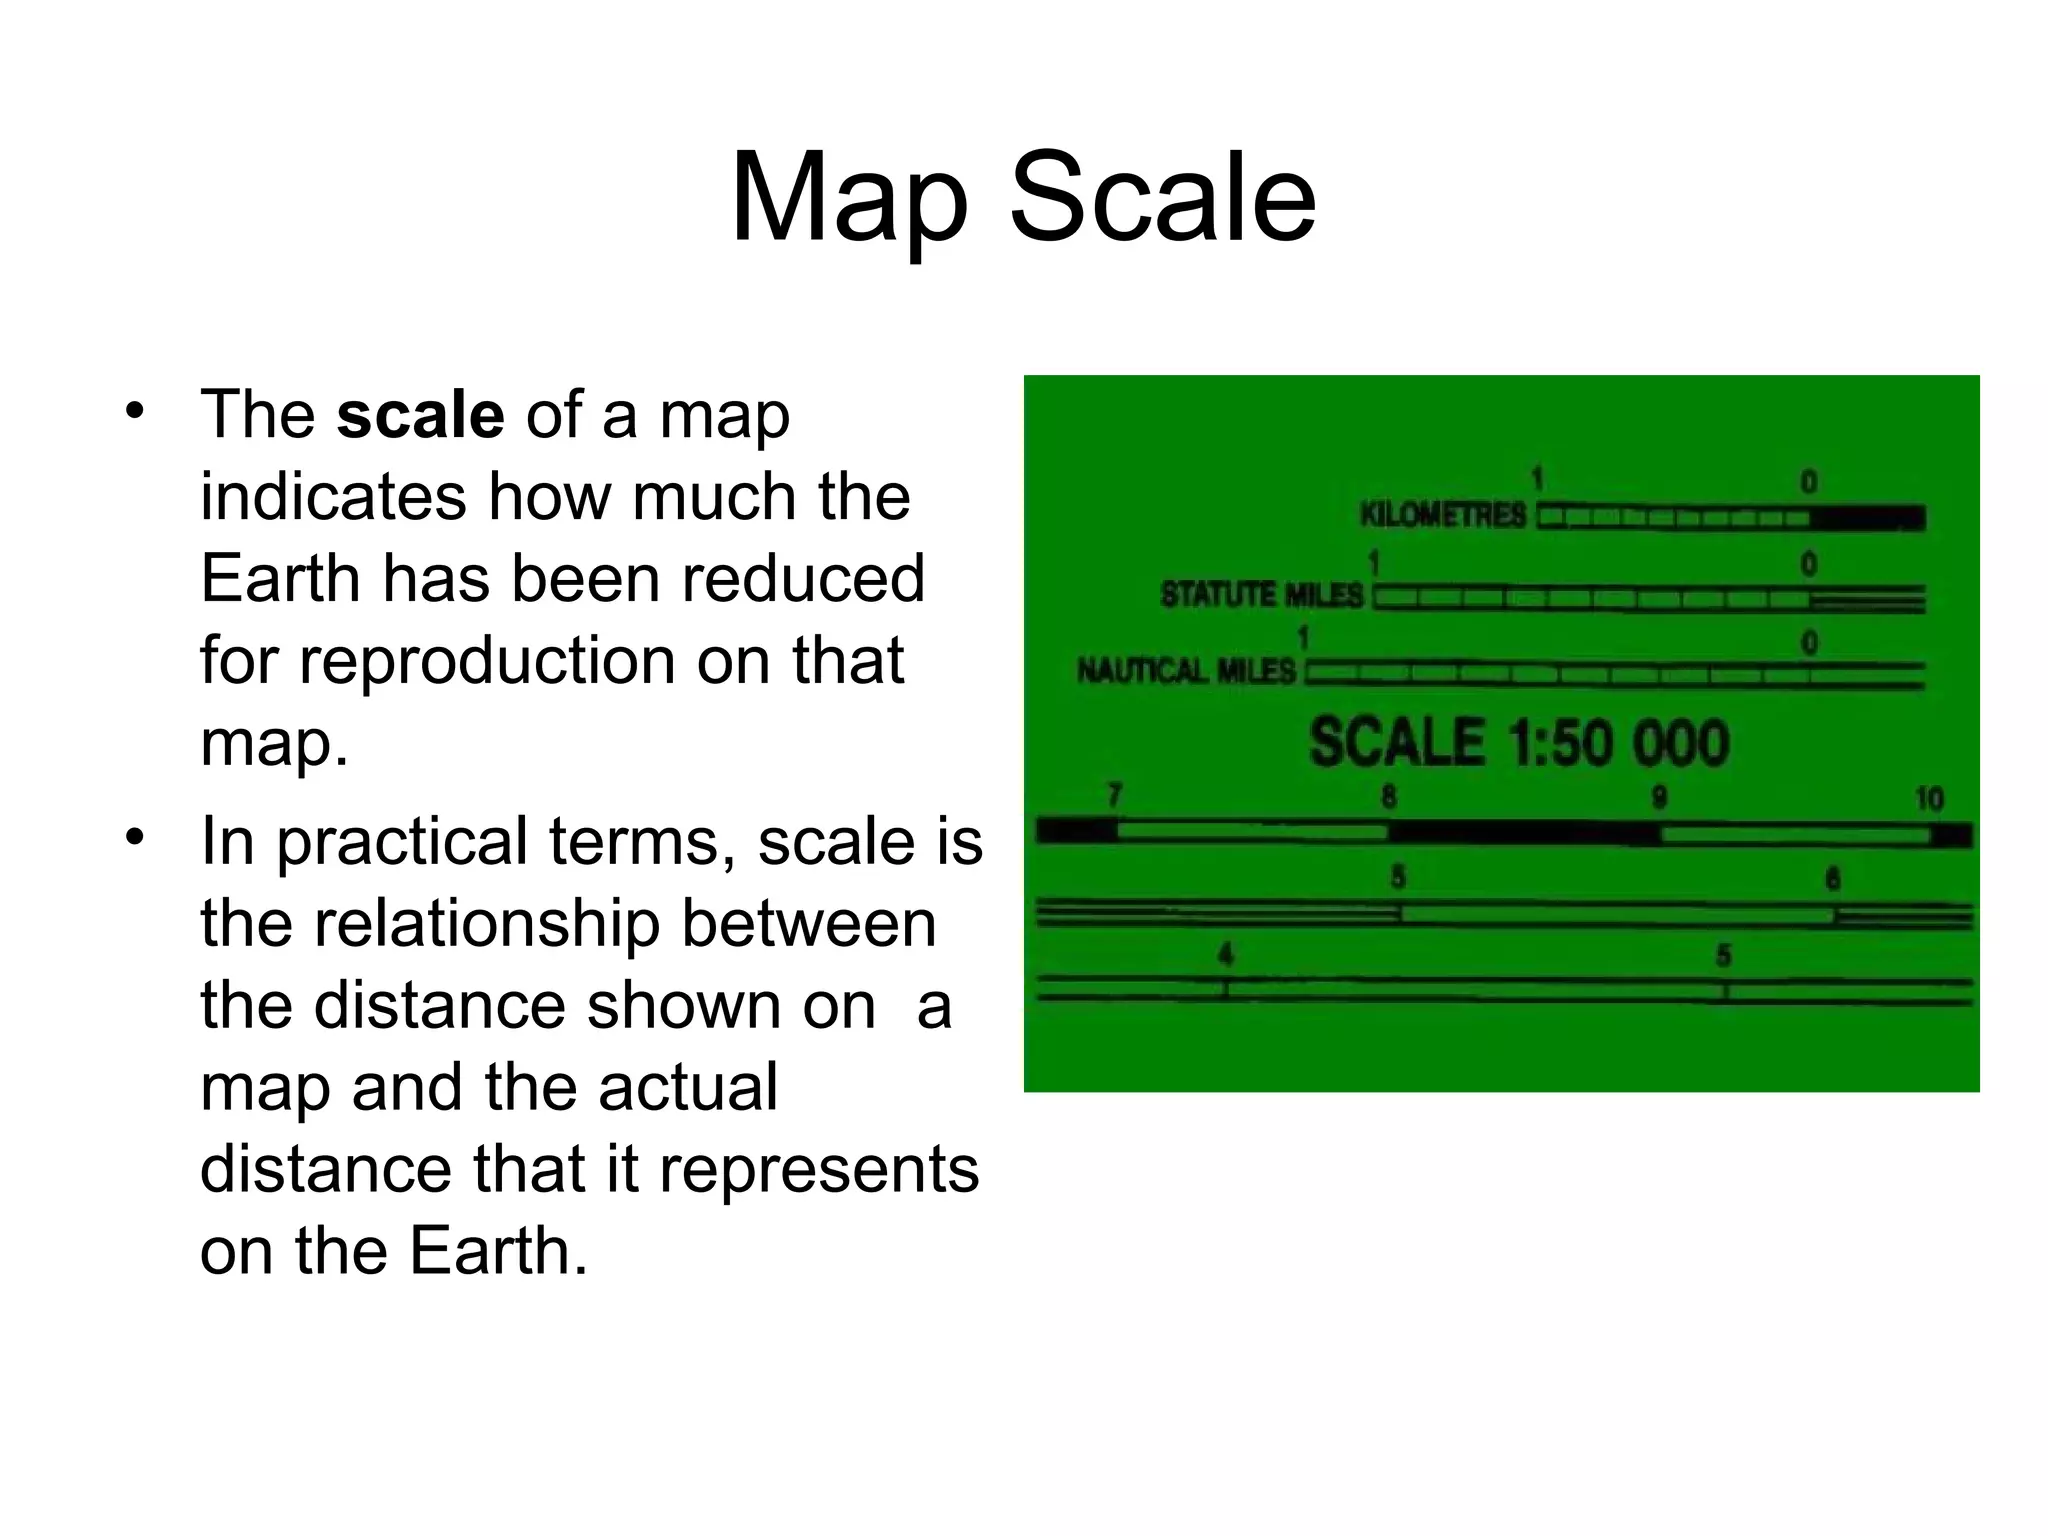
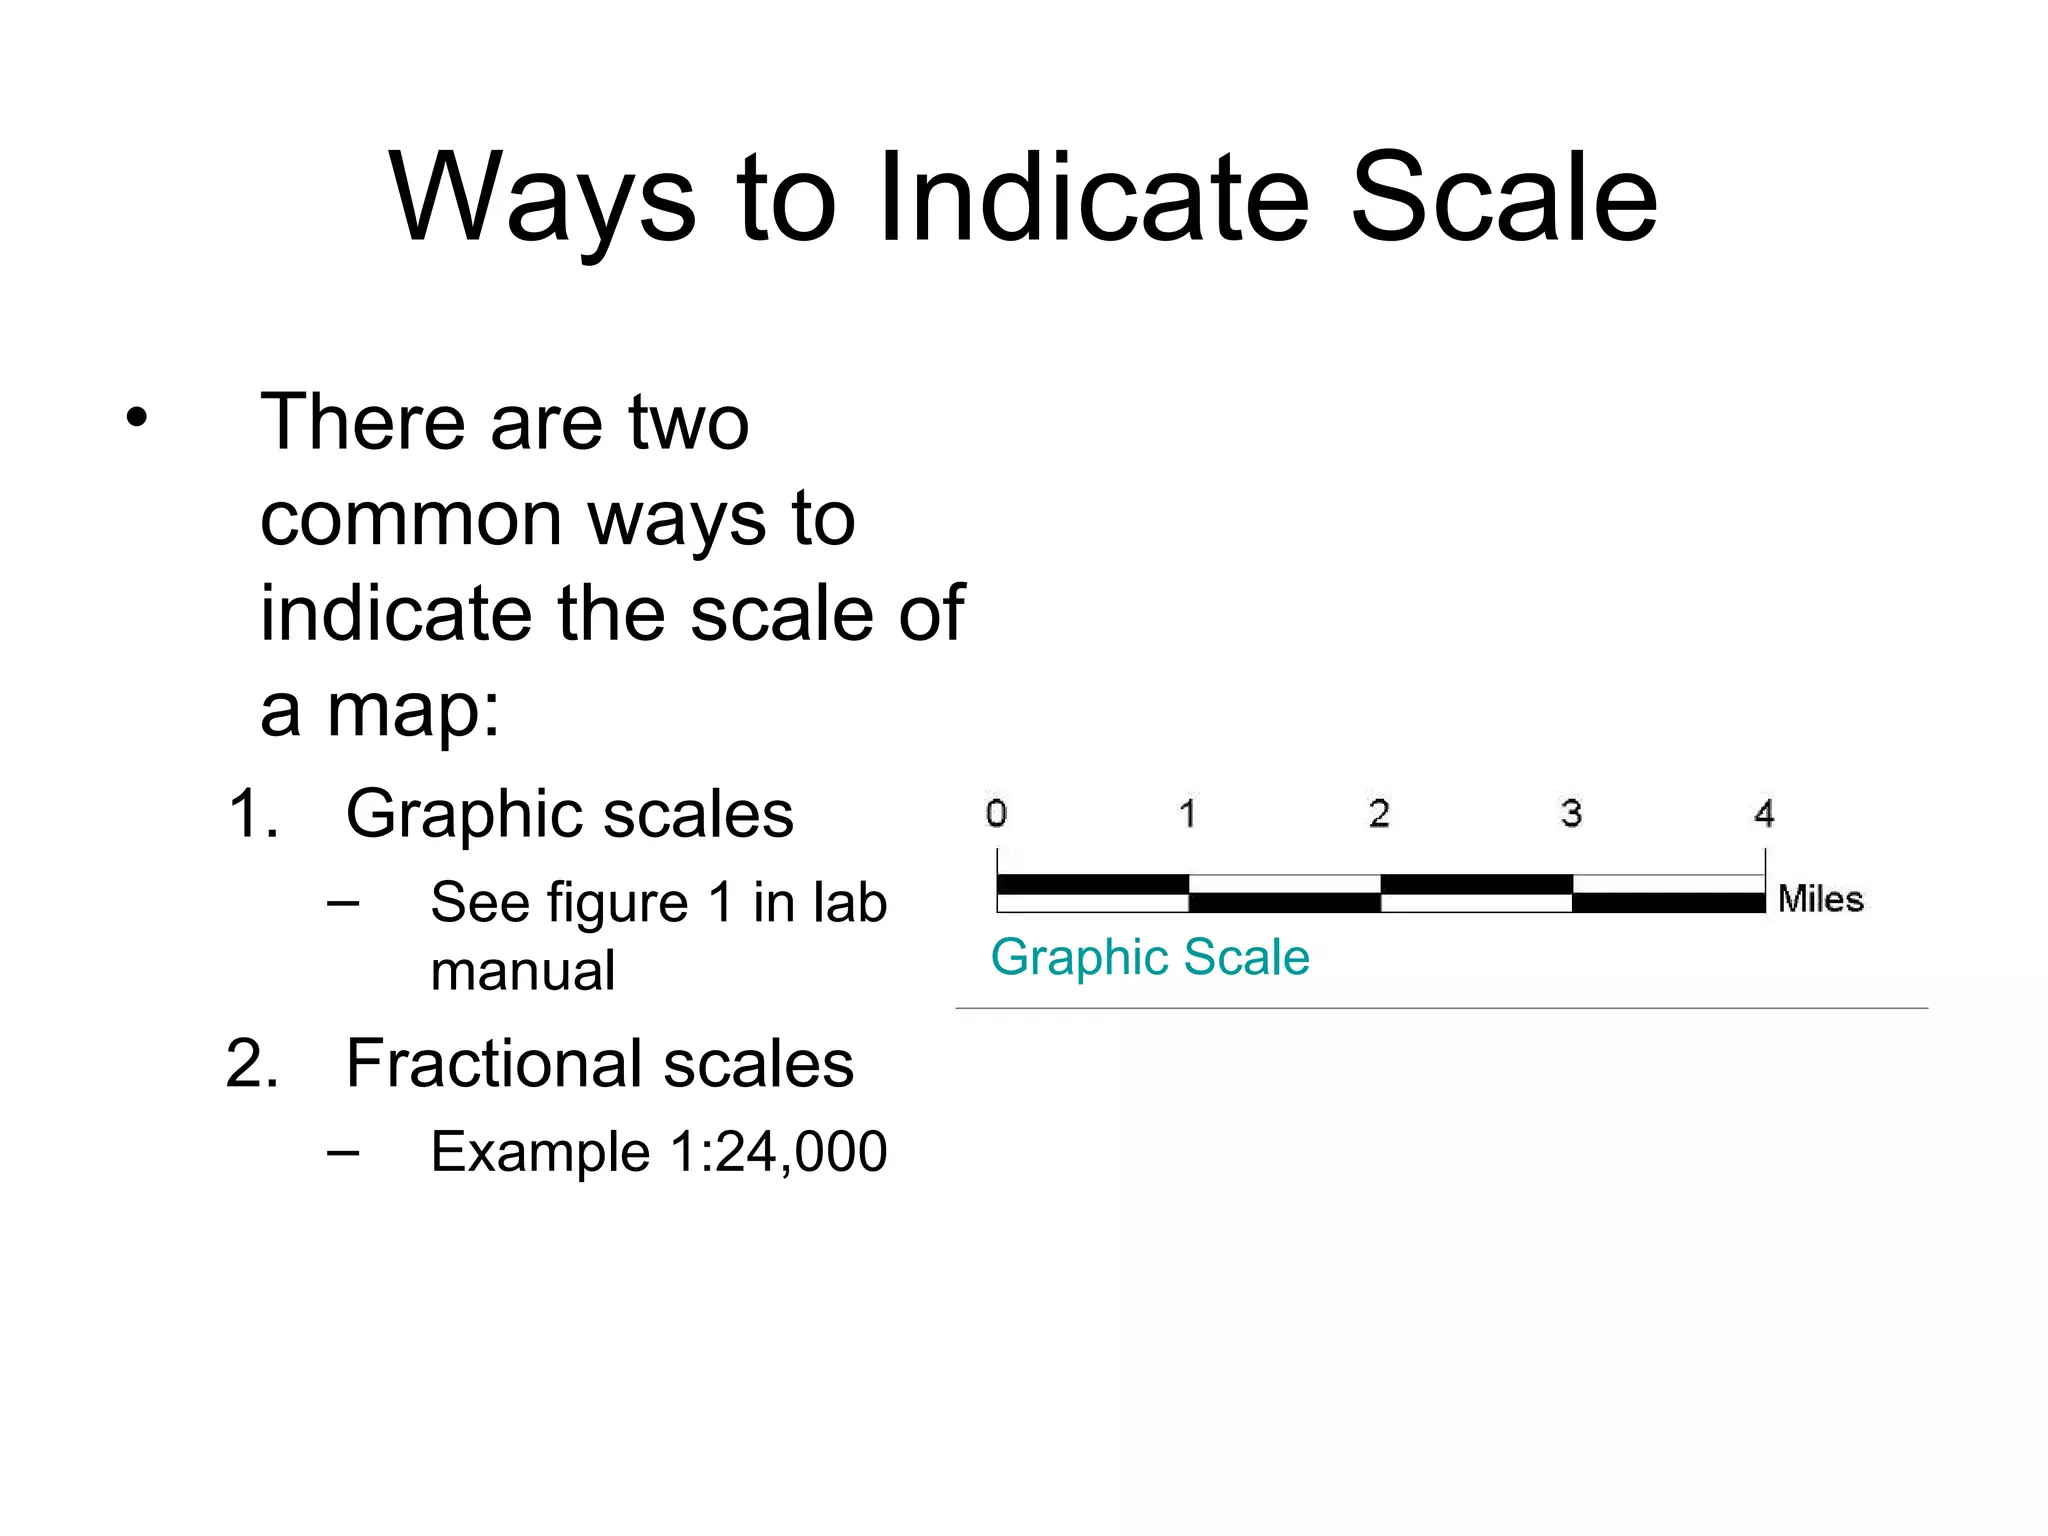
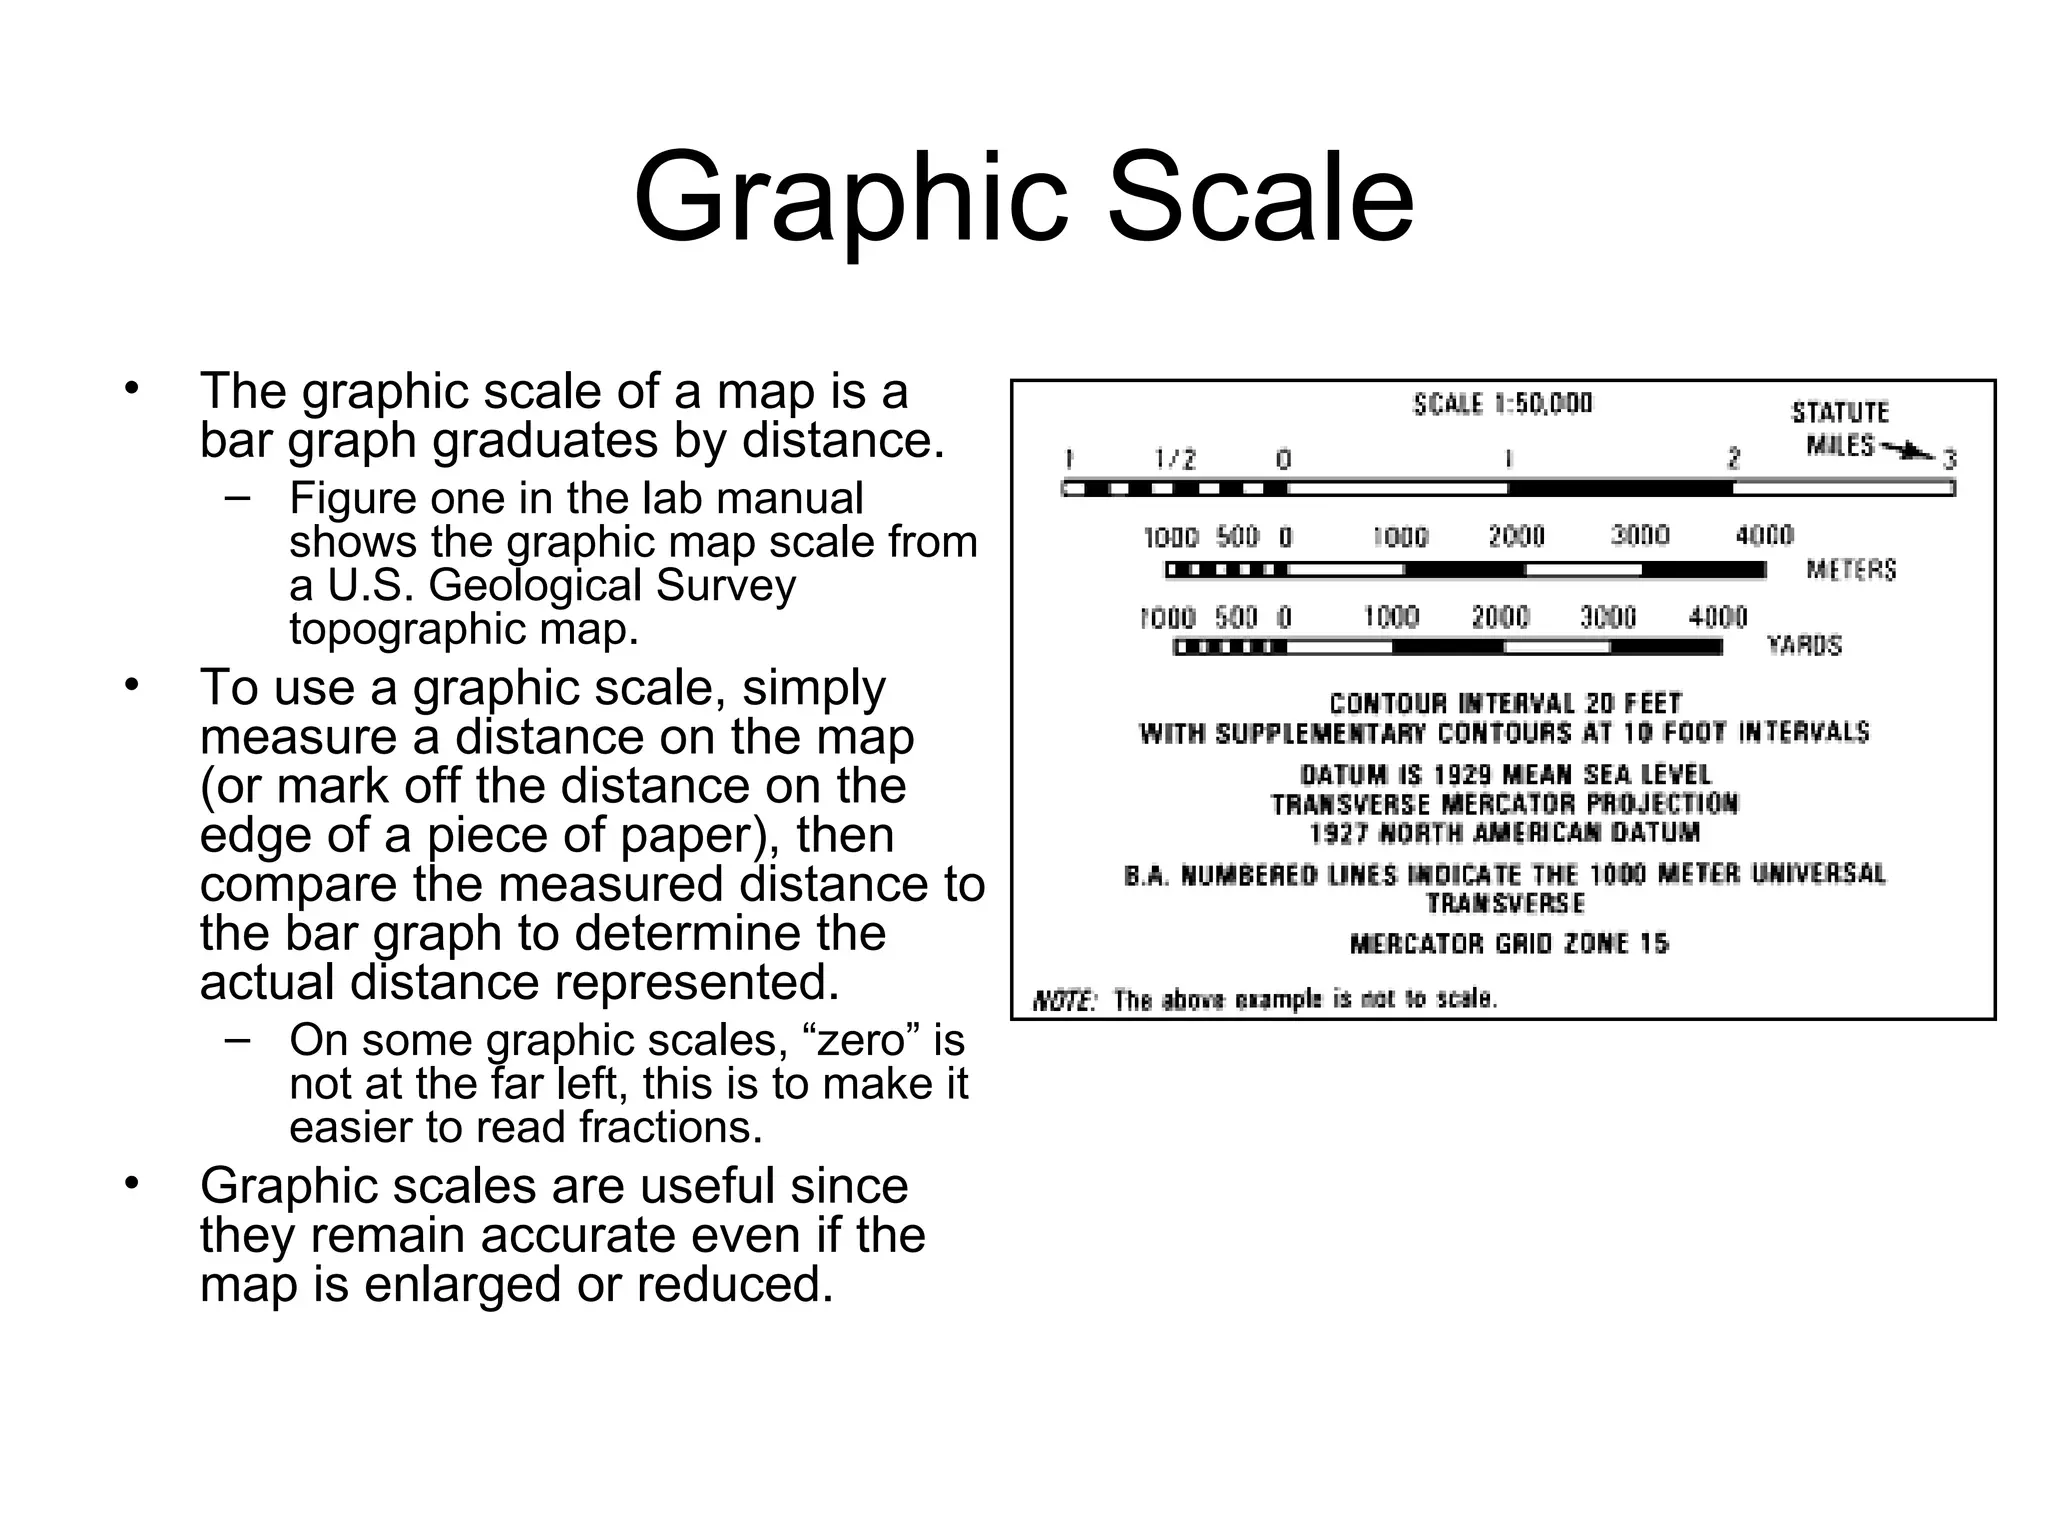
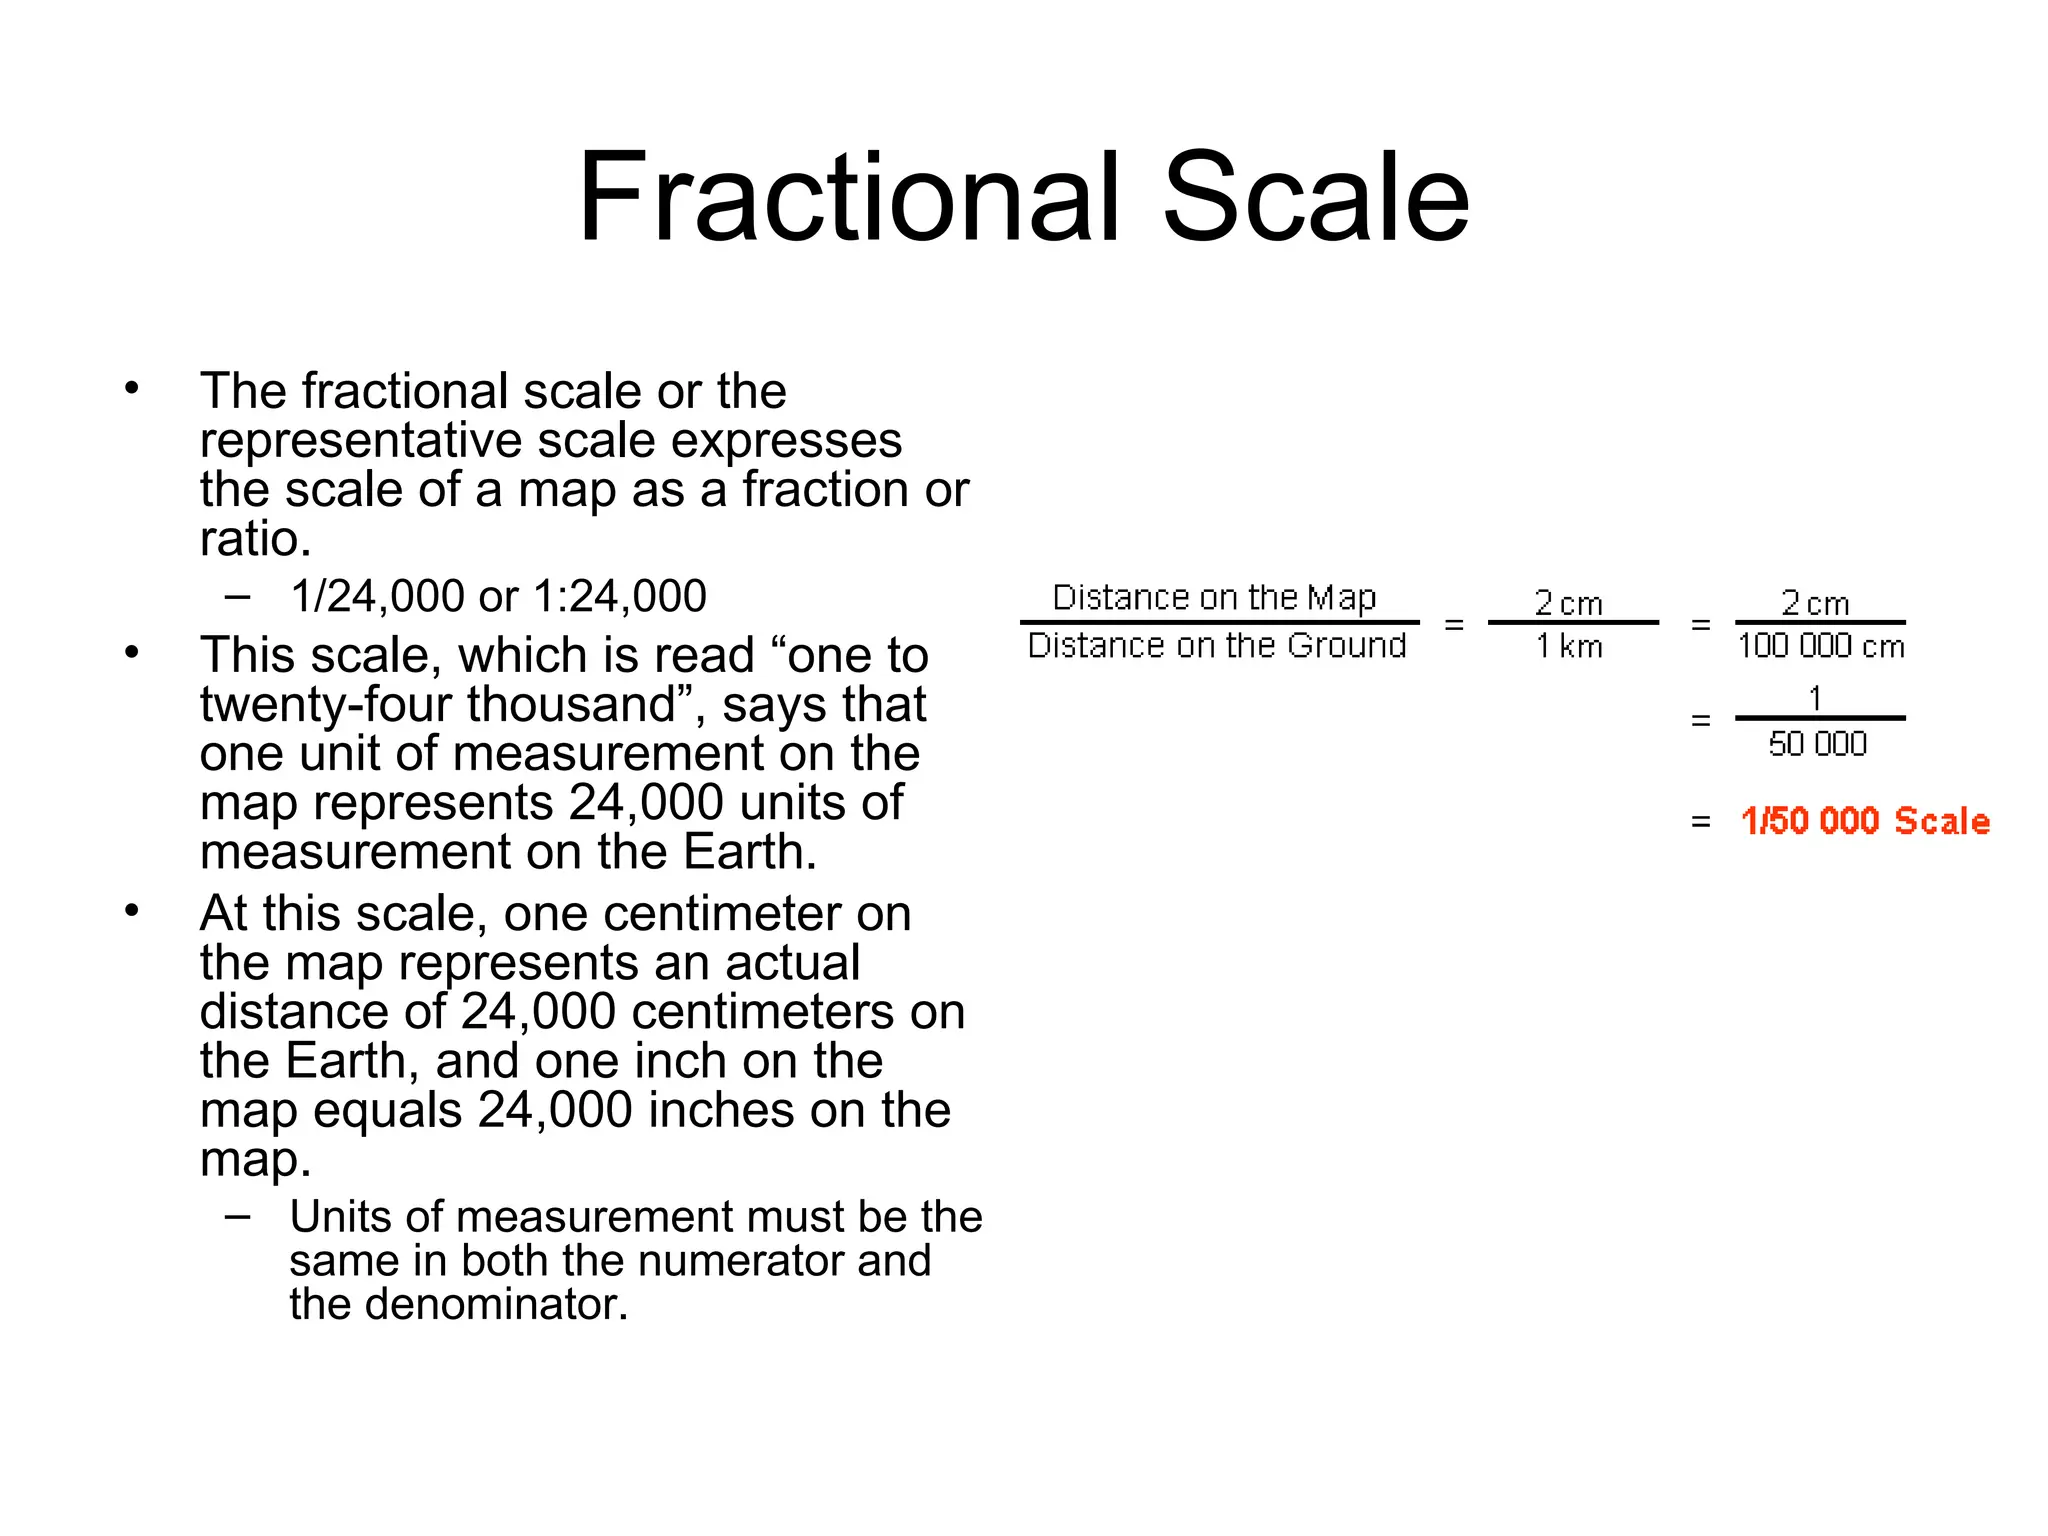
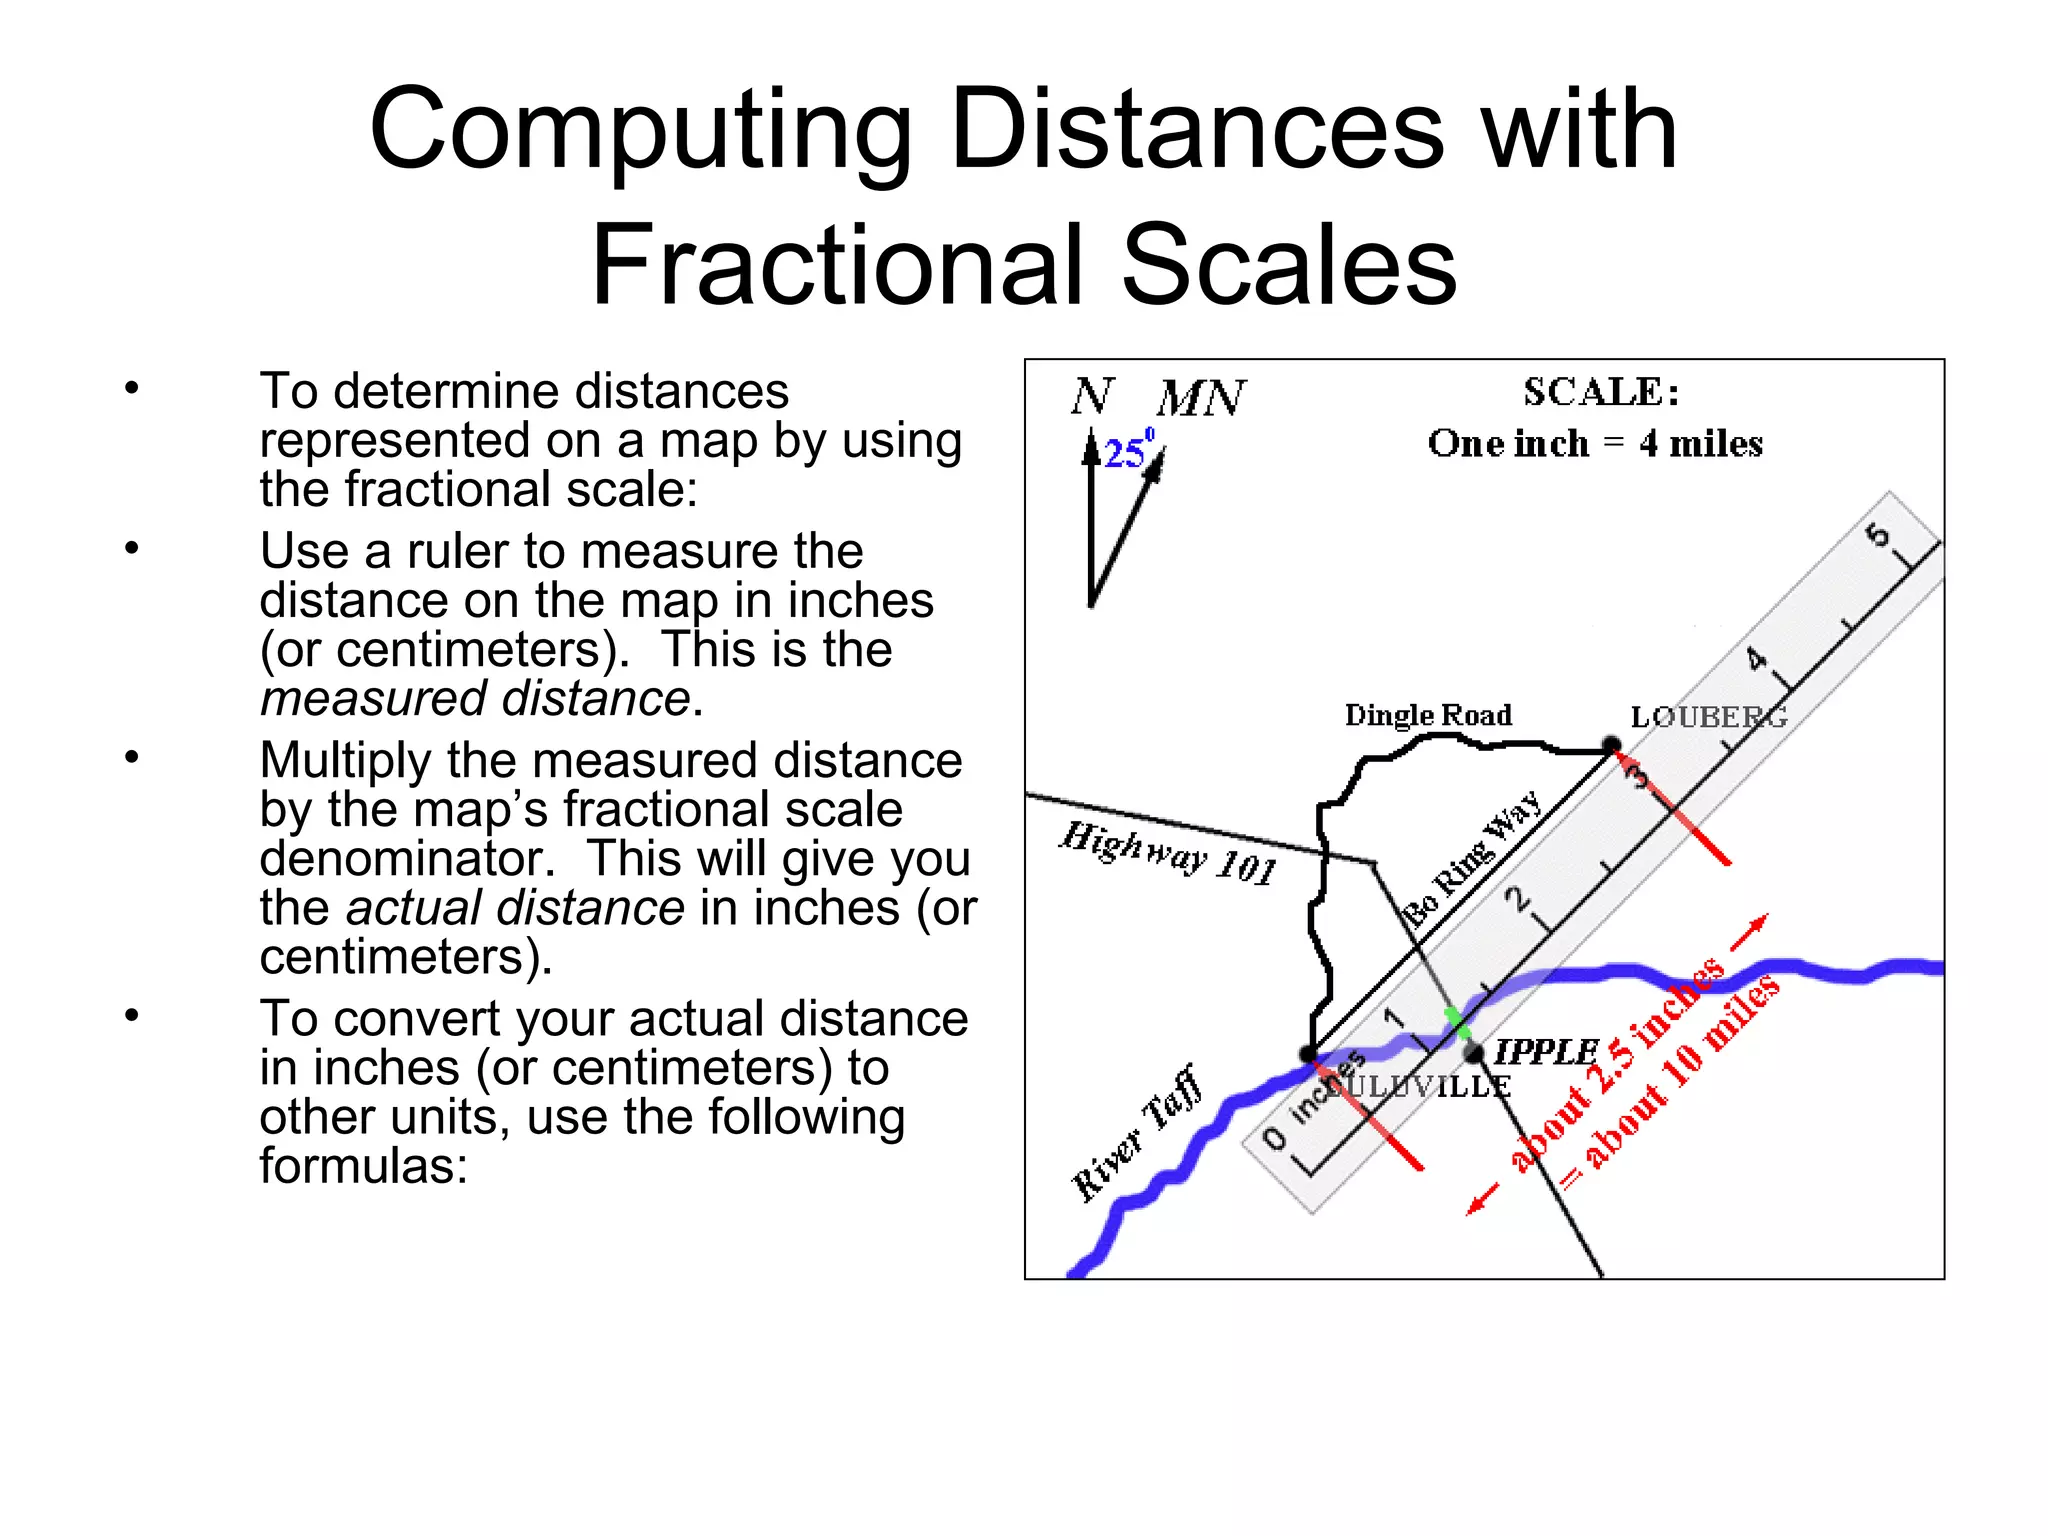
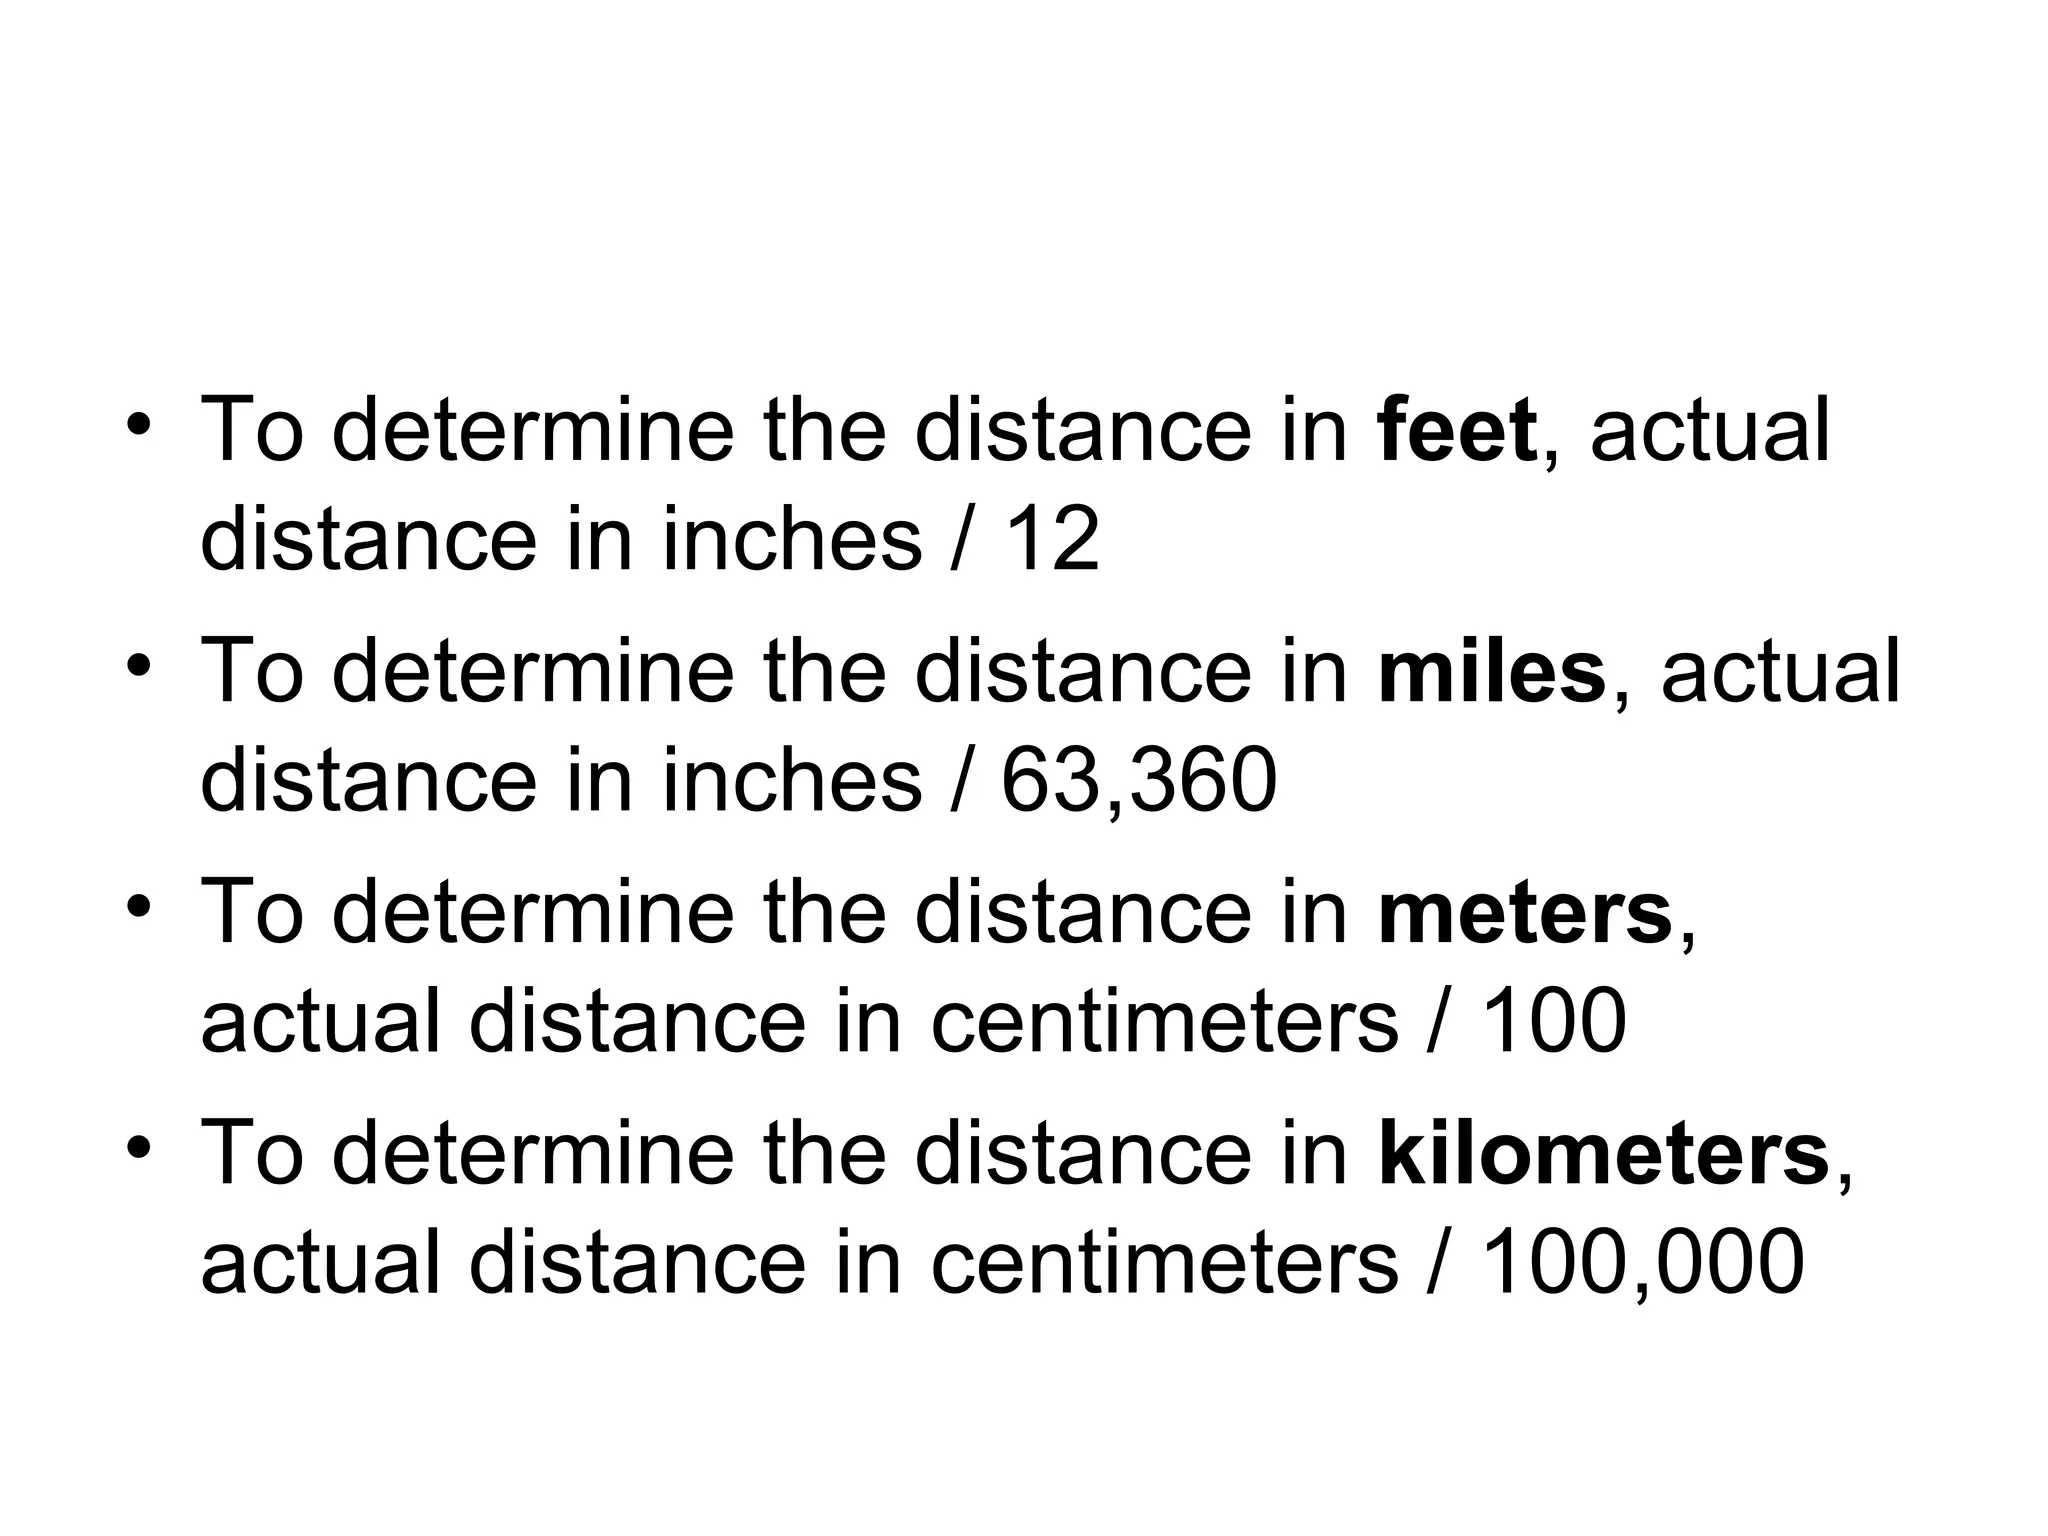
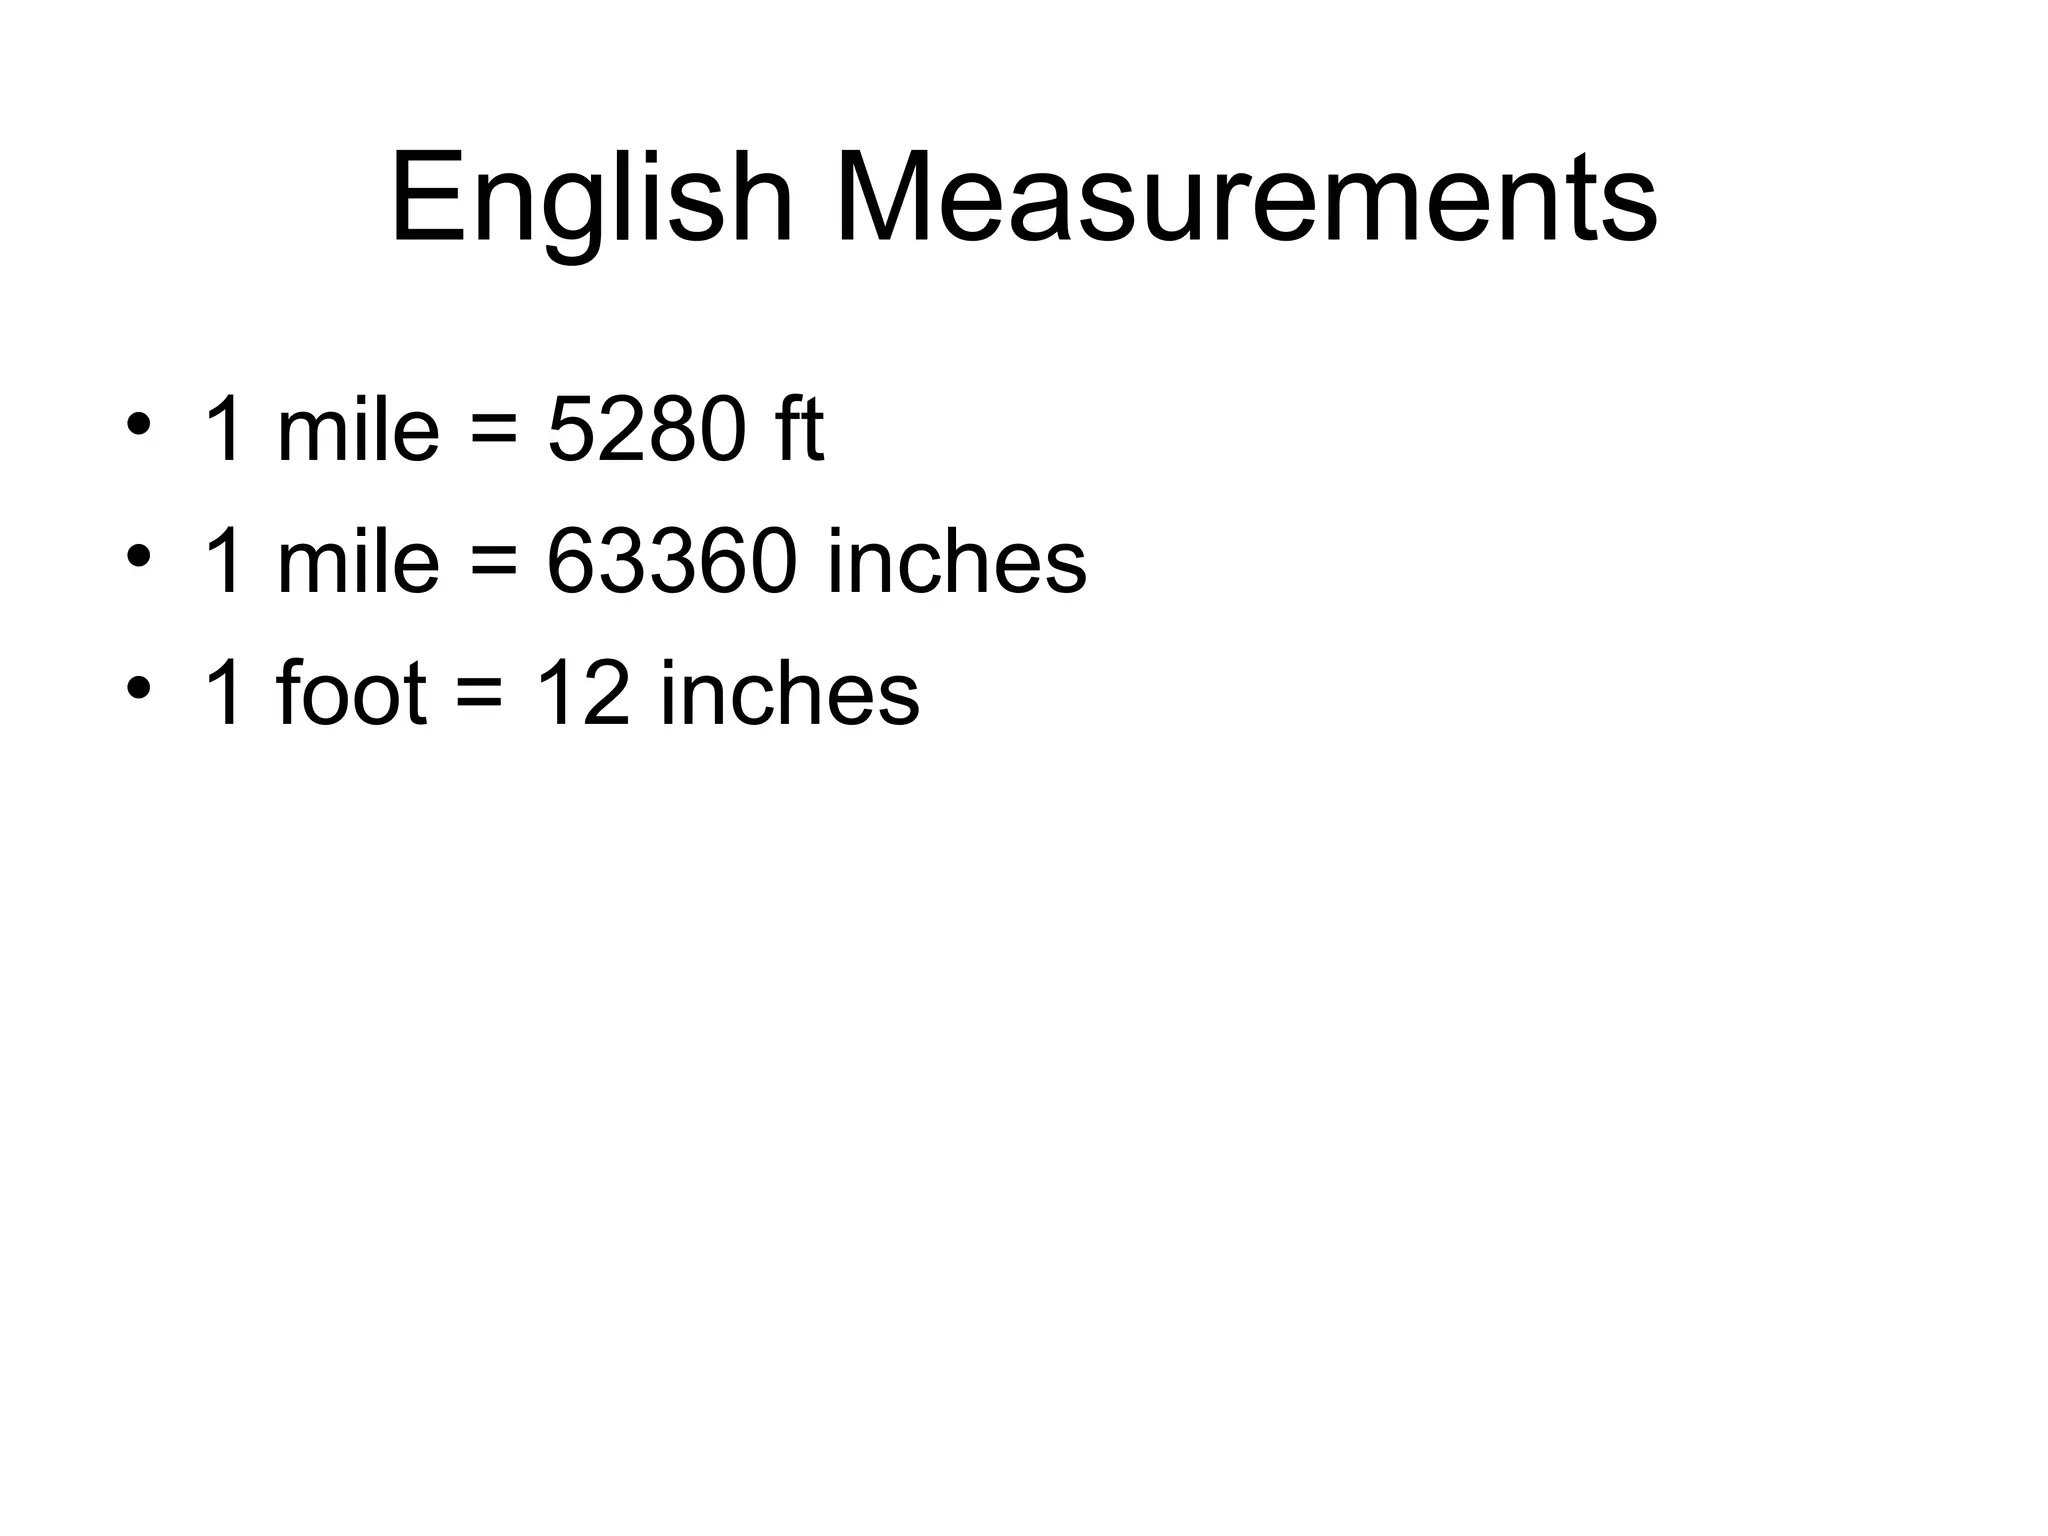
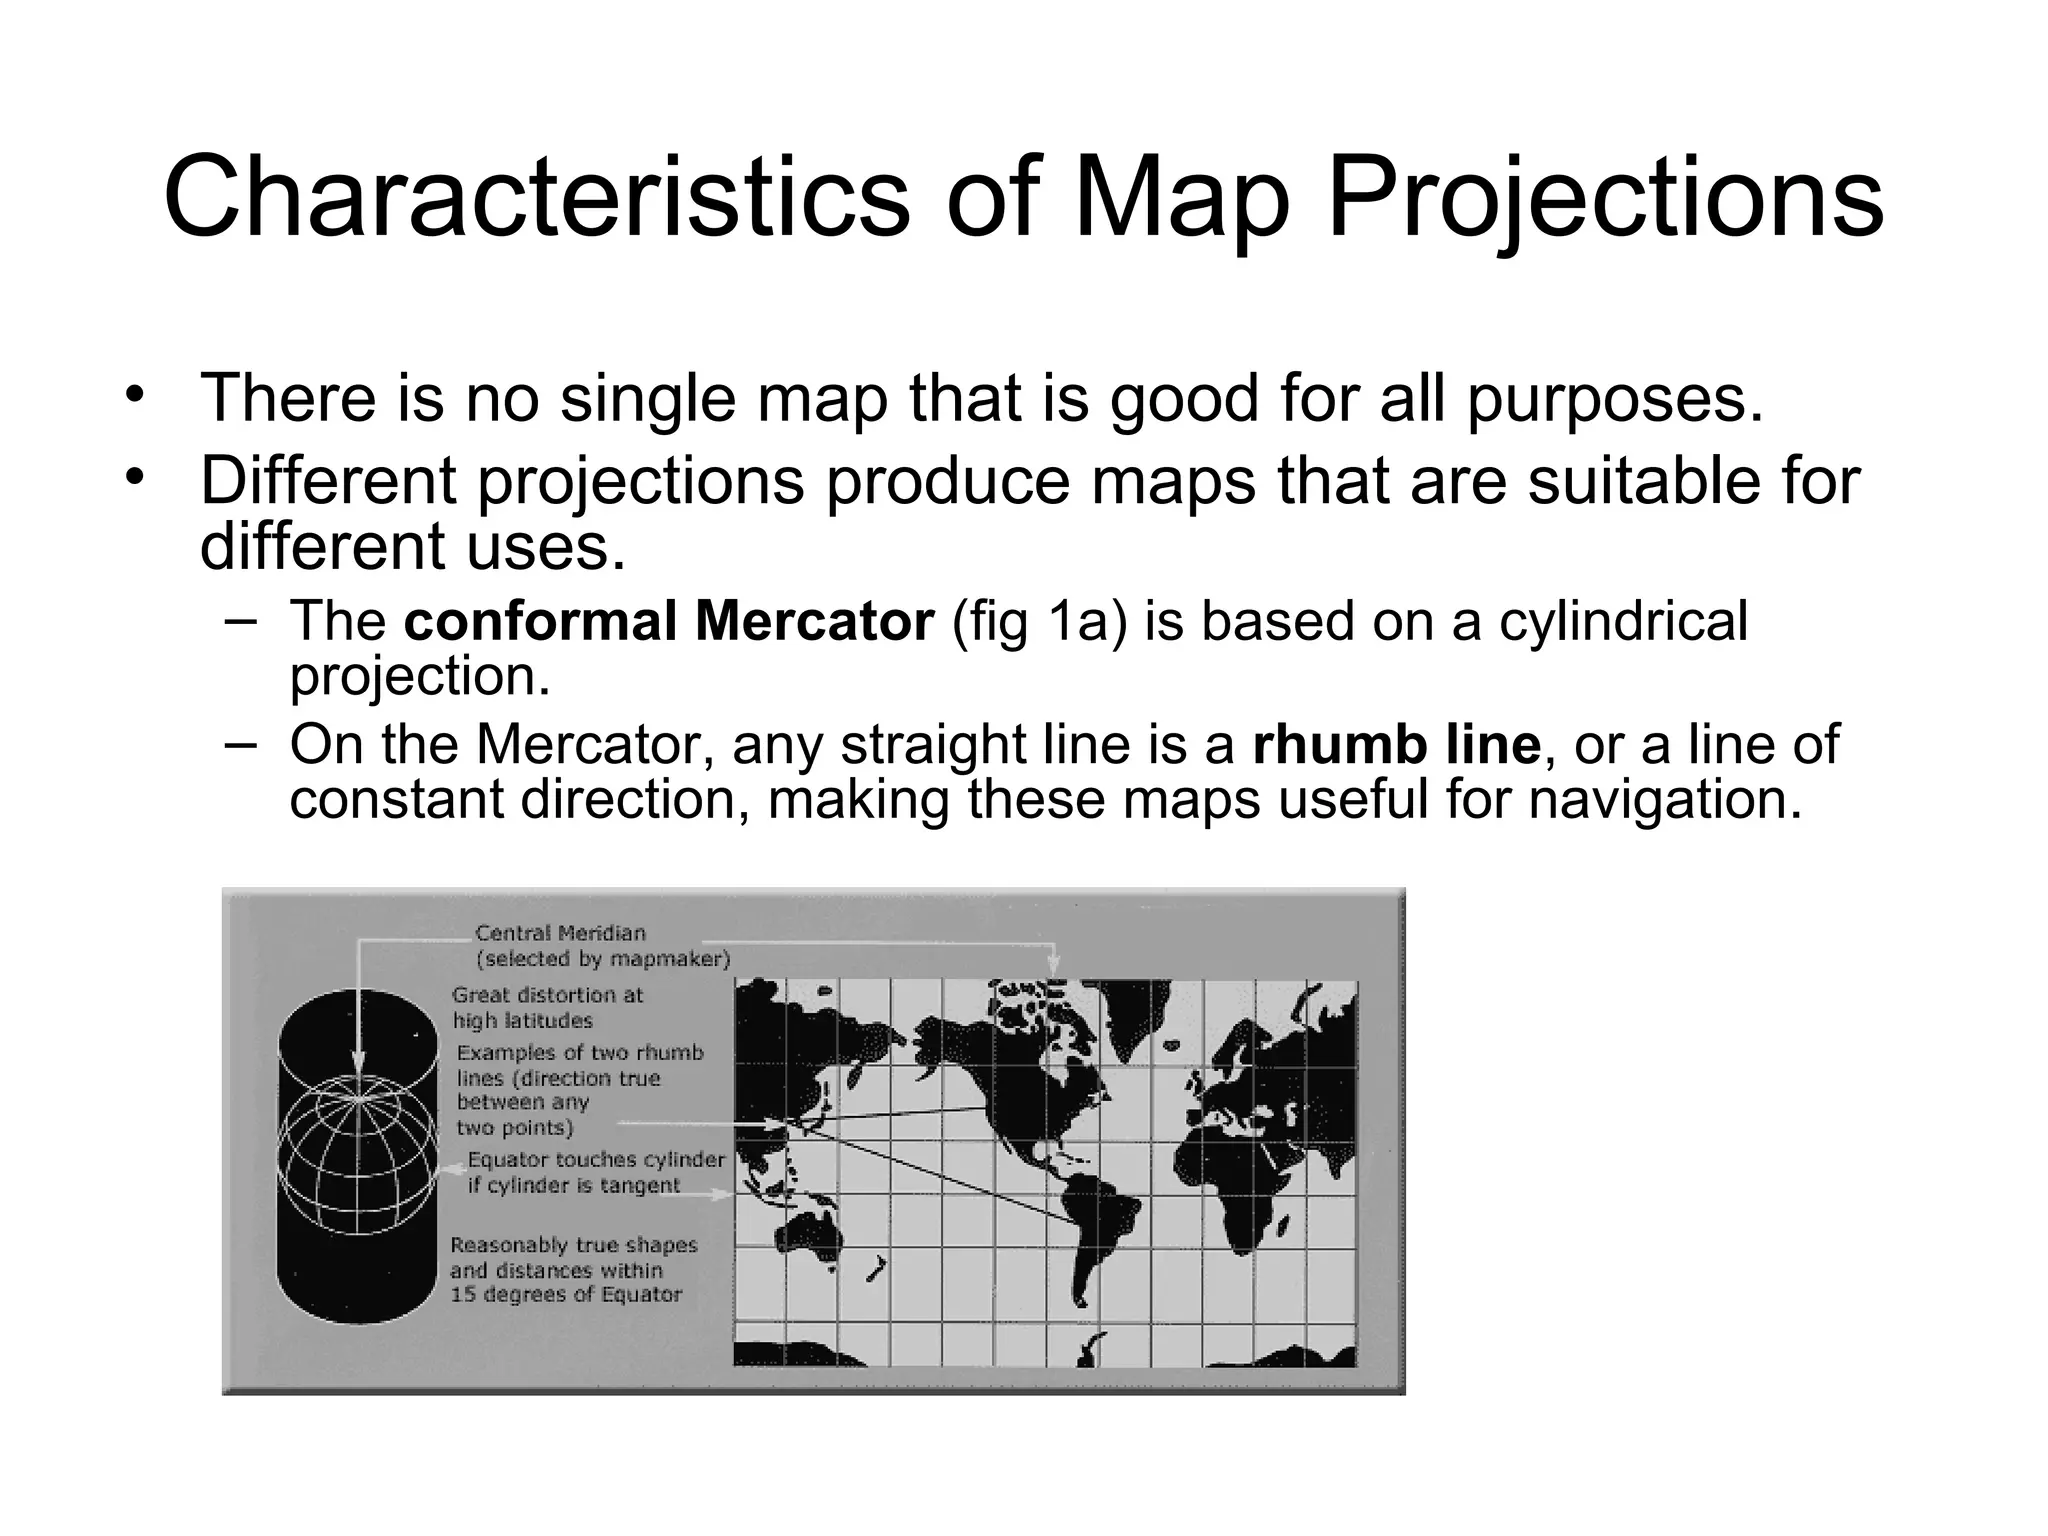
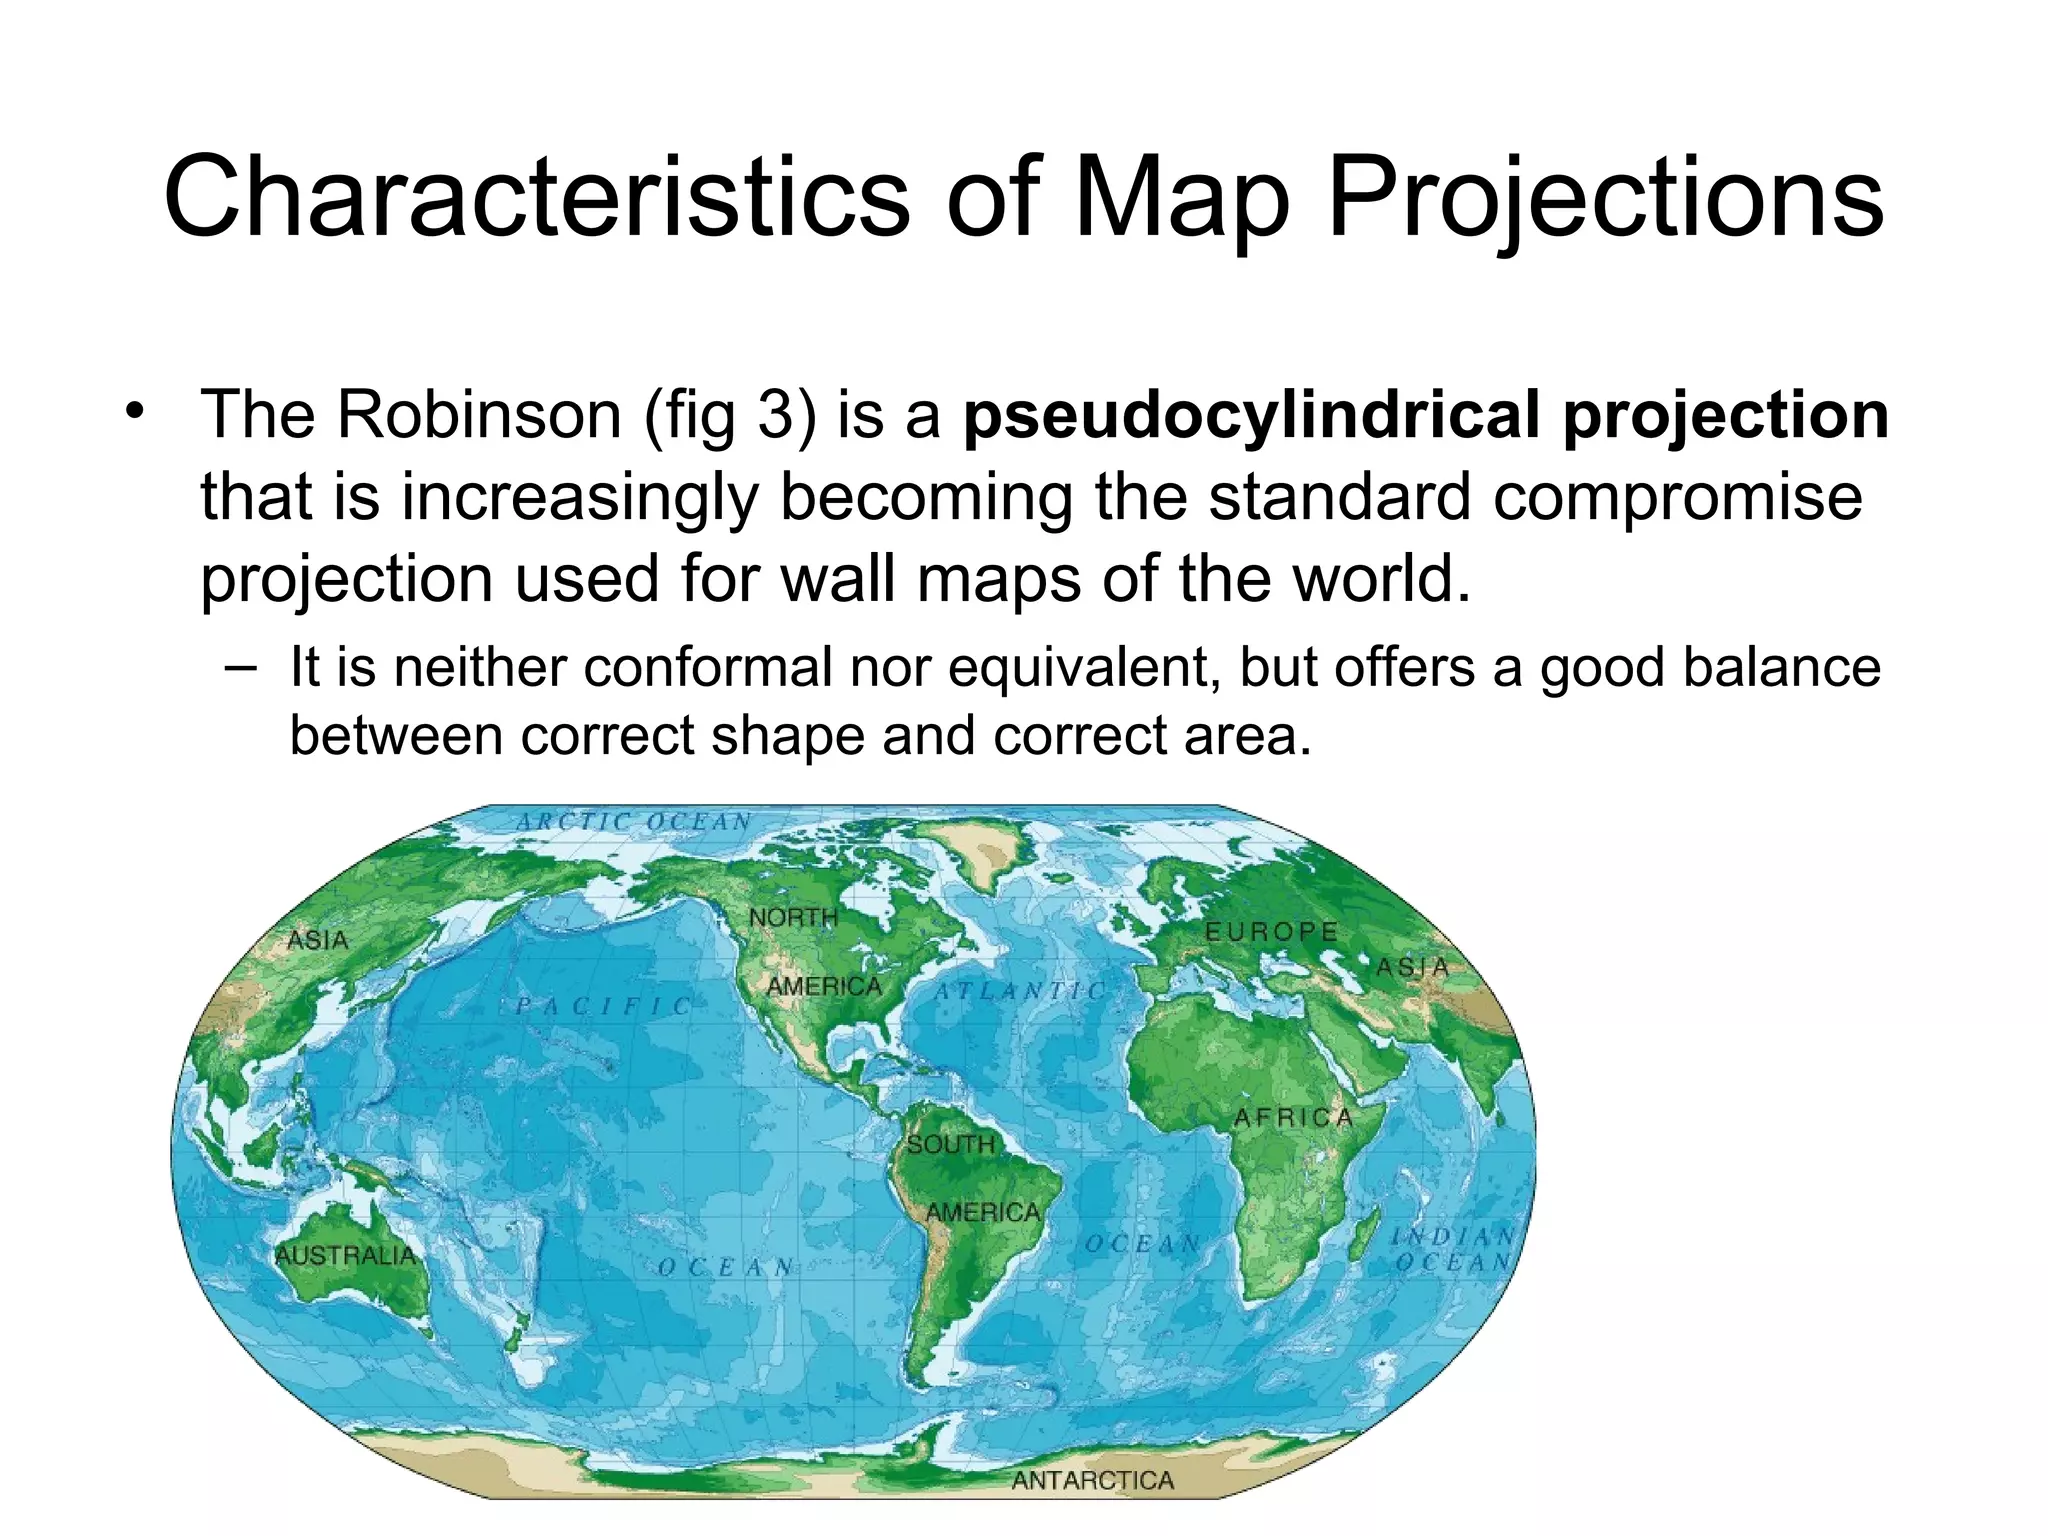
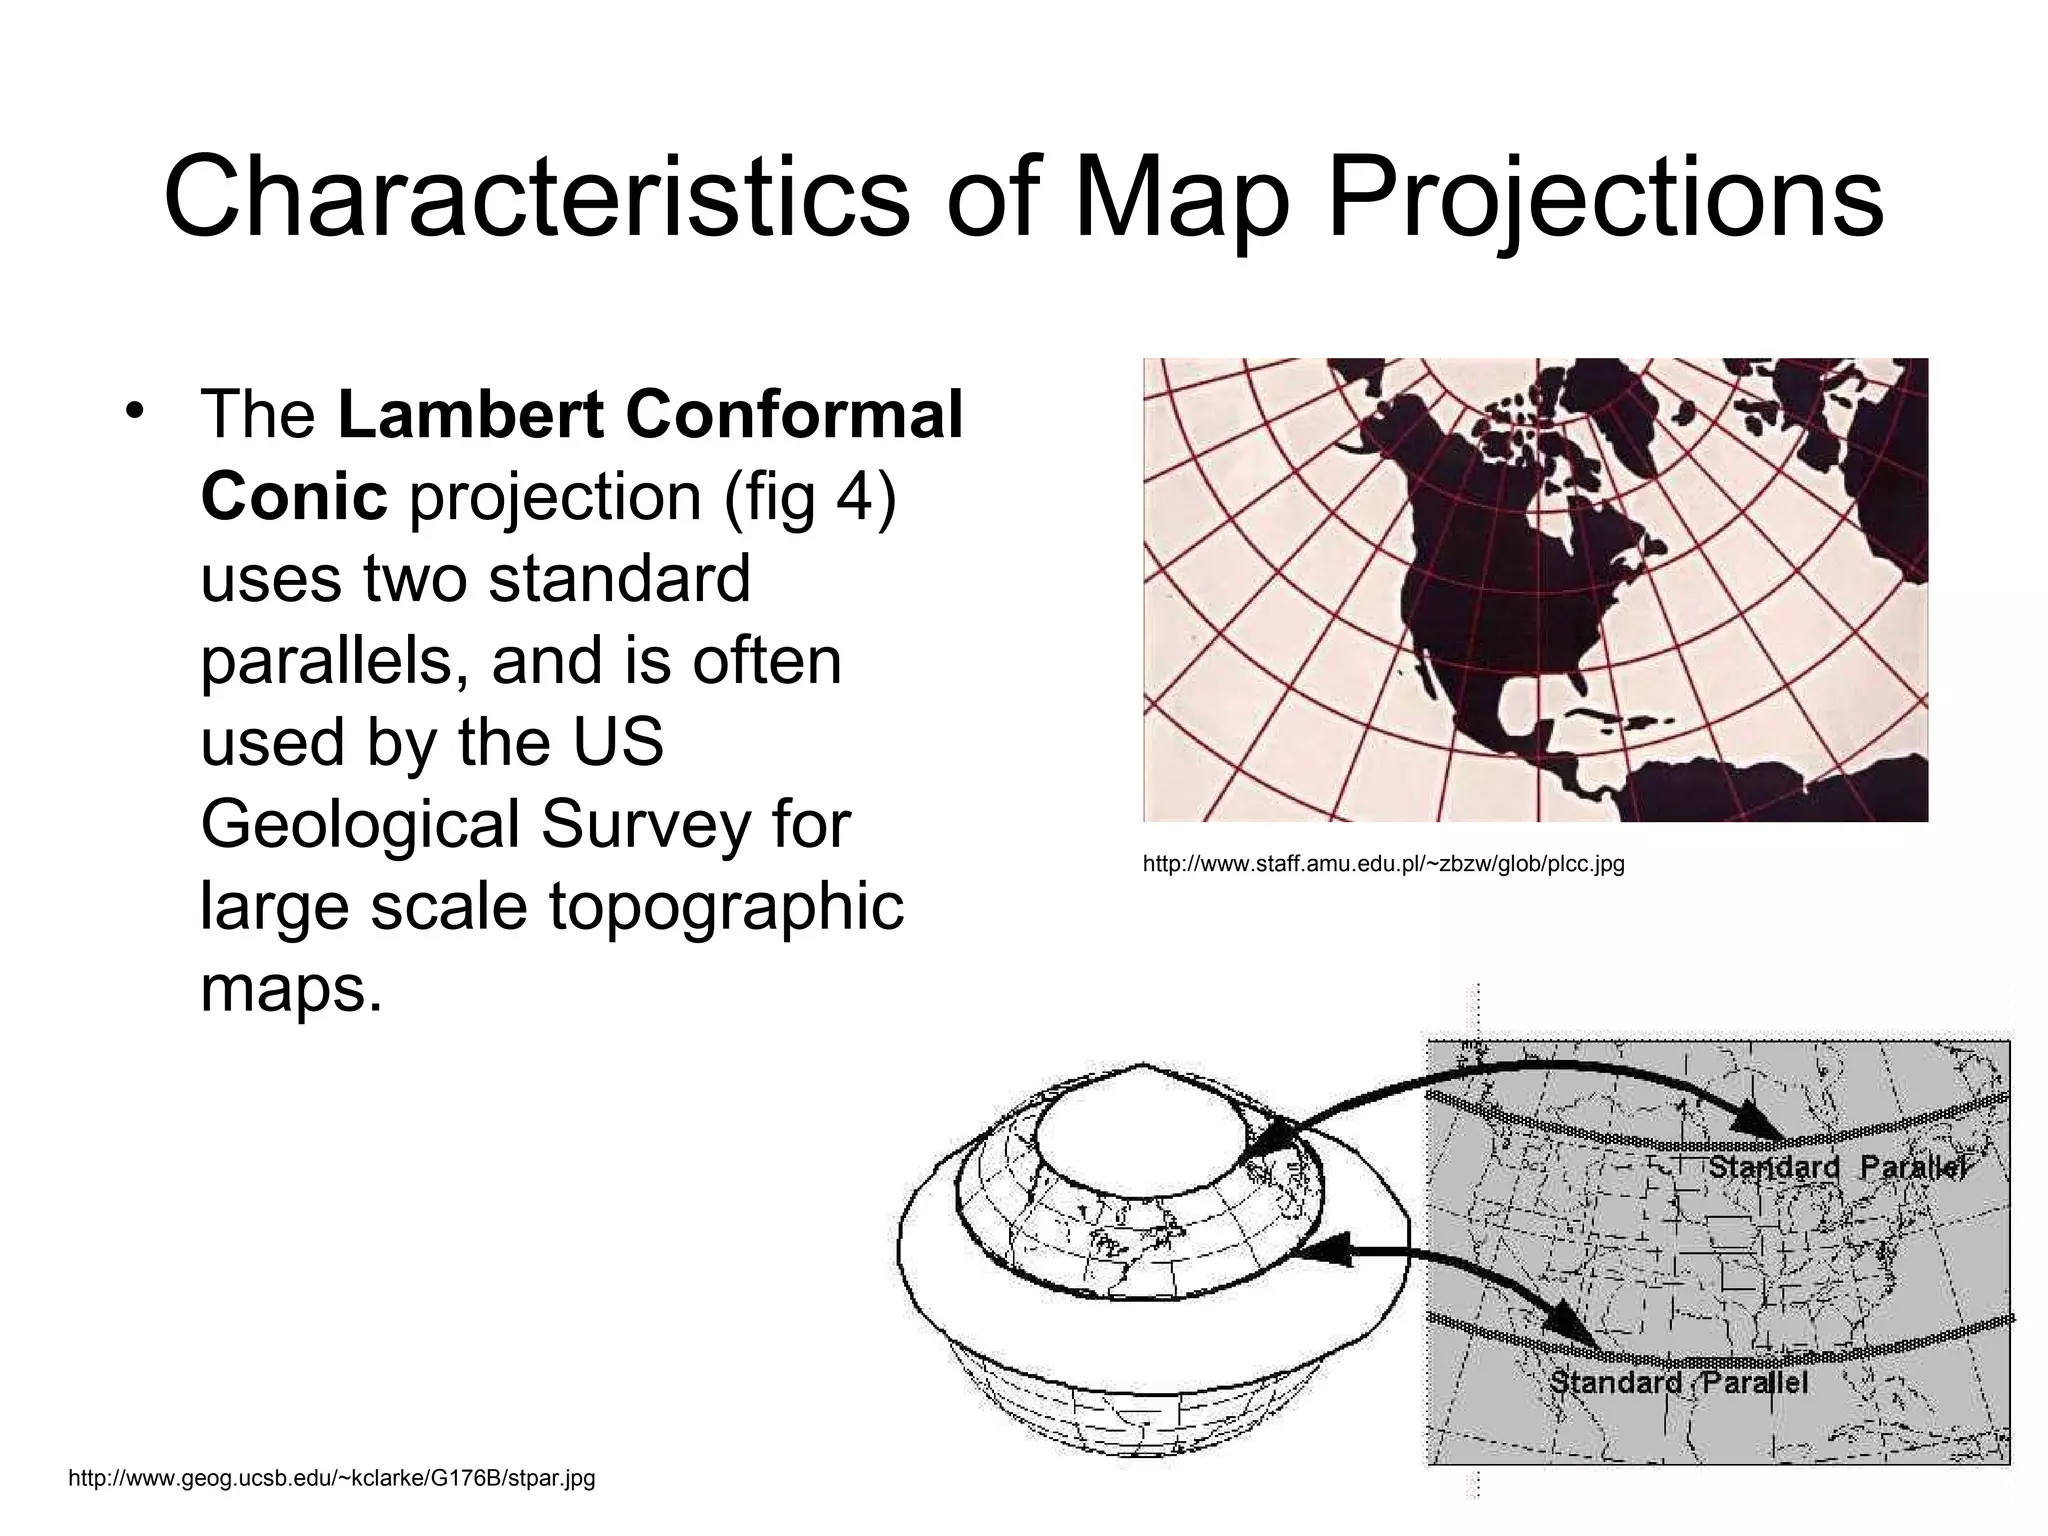
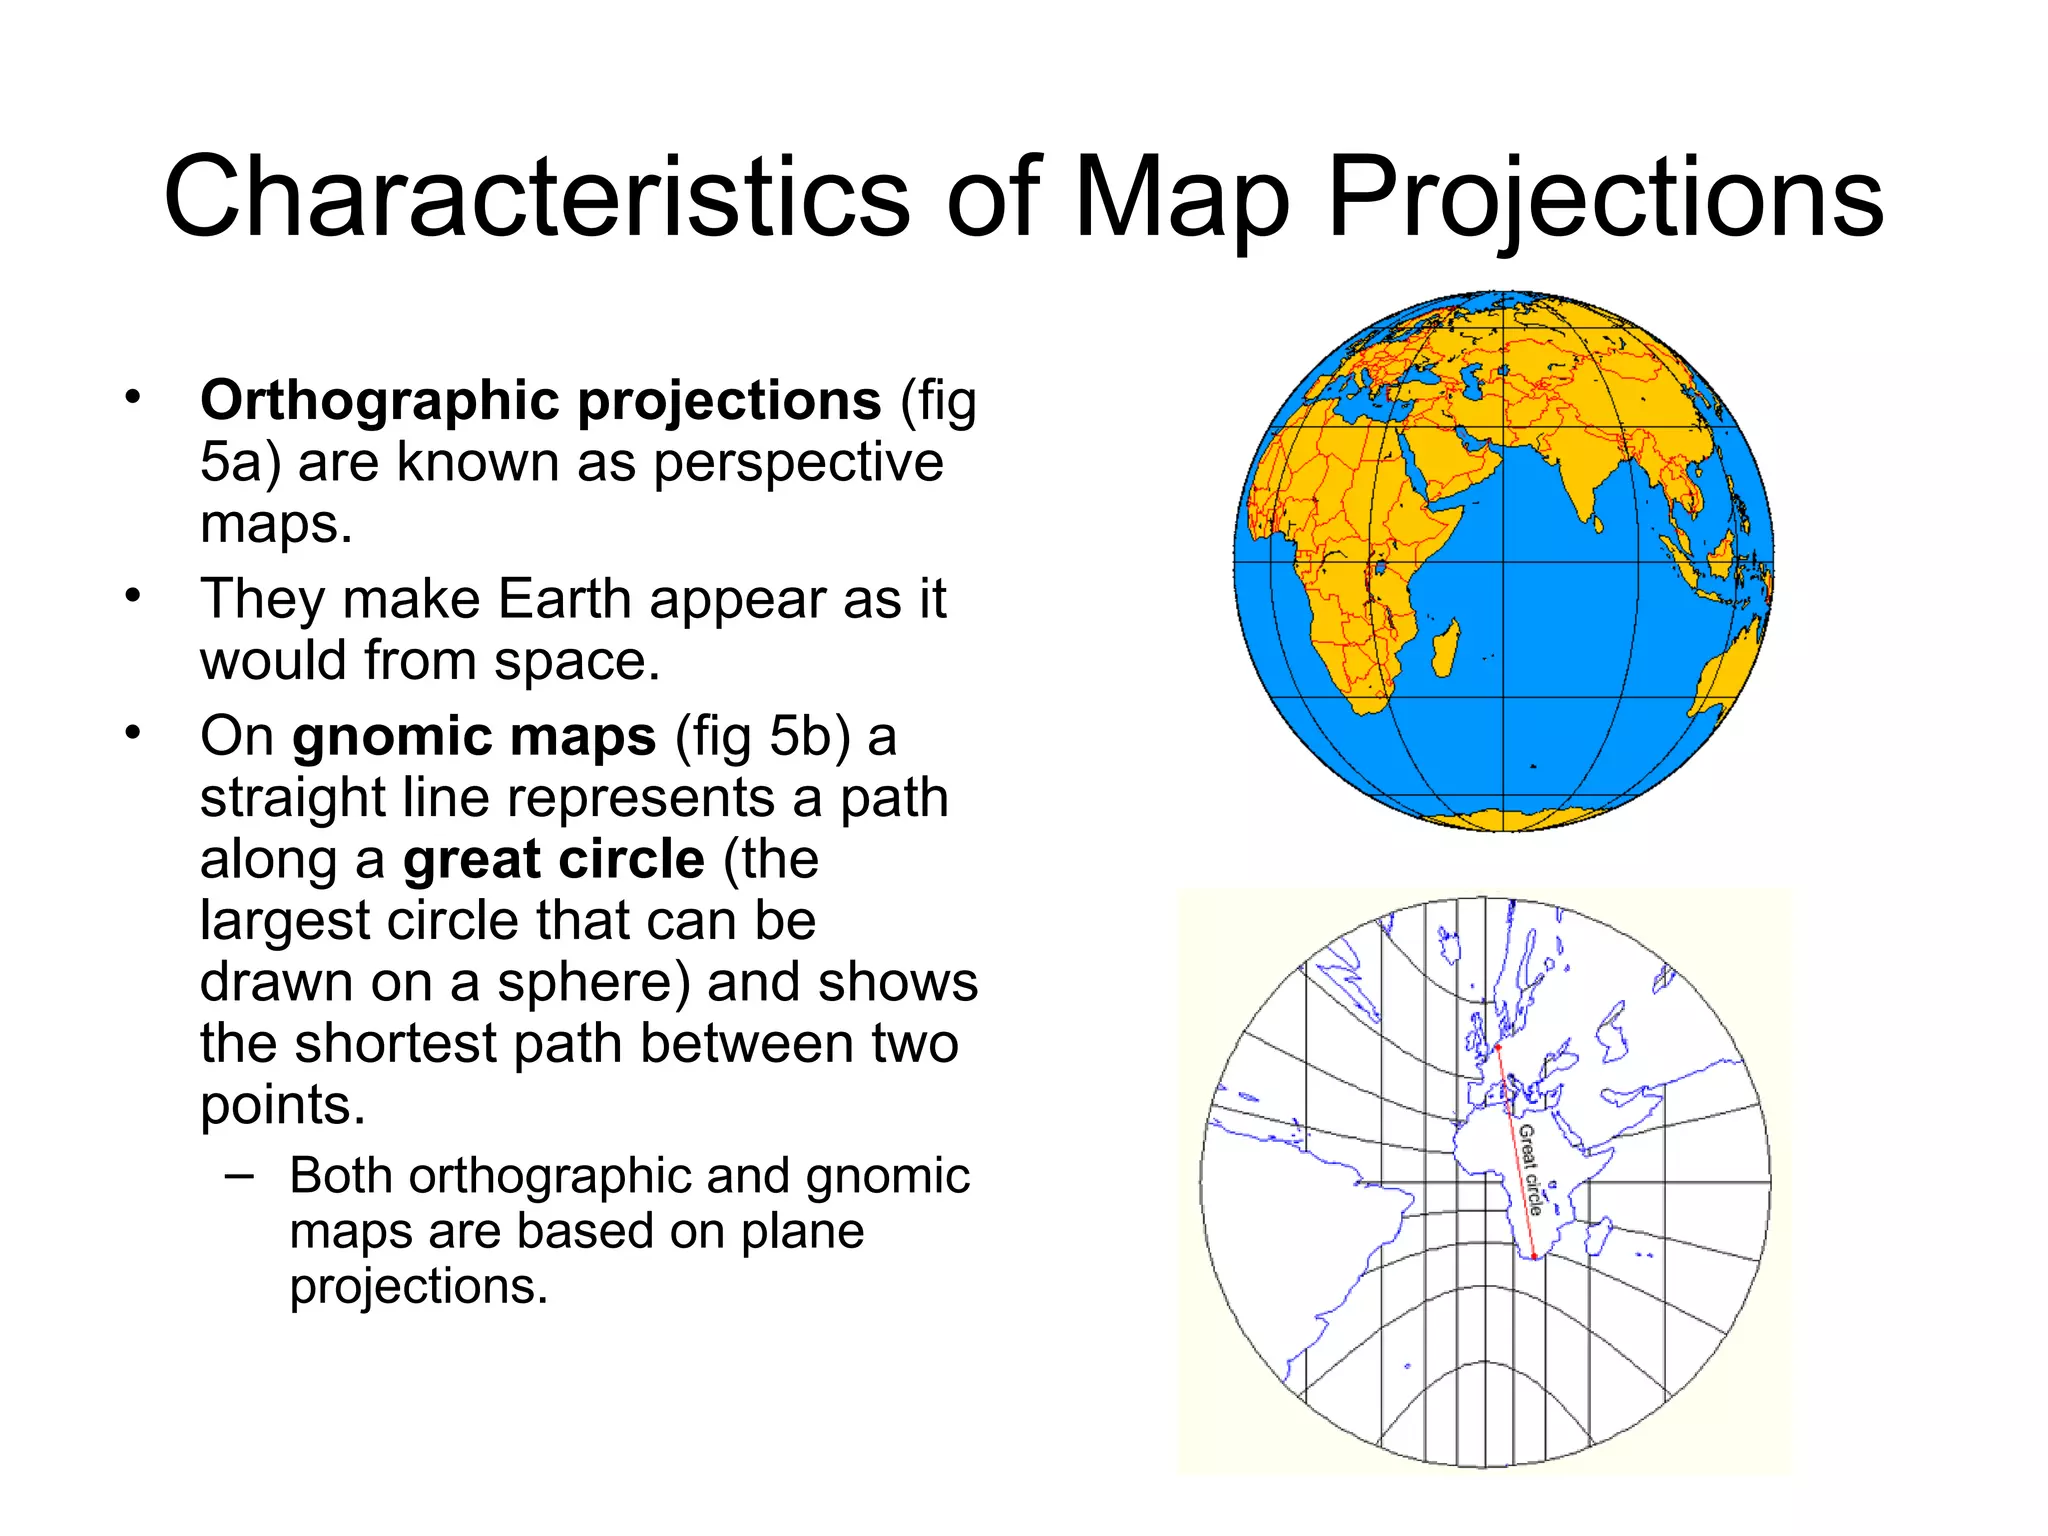
Map Scale and Projection Lab Three
Map Scale The  scale  of a map indicates how much the Earth has been reduced for reproduction on that map.  In practical terms, scale is the relationship between the distance shown on  a map and the actual distance that it represents on the Earth.
Ways to Indicate Scale There are two common ways to indicate the scale of a map: Graphic scales See figure 1 in lab manual Fractional scales Example 1:24,000 Graphic Scale
Graphic Scale The graphic scale of a map is a bar graph graduates by distance. Figure one in the lab manual shows the graphic map scale from a U.S. Geological Survey topographic map.  To use a graphic scale, simply measure a distance on the map (or mark off the distance on the edge of a piece of paper), then compare the measured distance to the bar graph to determine the actual distance represented. On some graphic scales, “zero” is not at the far left, this is to make it easier to read fractions.  Graphic scales are useful since they remain accurate even if the map is enlarged or reduced.
Fractional Scale The fractional scale or the representative scale expresses the scale of a map as a fraction or ratio. 1/24,000 or 1:24,000 This scale, which is read “one to twenty-four thousand”, says that one unit of measurement on the map represents 24,000 units of measurement on the Earth. At this scale, one centimeter on the map represents an actual distance of 24,000 centimeters on the Earth, and one inch on the map equals 24,000 inches on the map. Units of measurement must be the same in both the numerator and the denominator.
Computing Distances with Fractional Scales To determine distances represented on a map by using the fractional scale: Use a ruler to measure the distance on the map in inches (or centimeters).  This is the  measured distance . Multiply the measured distance by the map’s fractional scale denominator.  This will give you the  actual distance  in inches (or centimeters). To convert your actual distance in inches (or centimeters) to other units, use the following formulas:
To determine the distance in  feet , actual distance in inches / 12 To determine the distance in  miles , actual distance in inches / 63,360 To determine the distance in  meters , actual distance in centimeters / 100 To determine the distance in  kilometers , actual distance in centimeters / 100,000
English Measurements 1 mile = 5280 ft  1 mile = 63360 inches  1 foot = 12 inches
Metric Measurements 1 Kilometer (Km) = 1,000 meters (m)  1 Kilometer (Km) = 100,000 cm  1 Kilometer (Km) = 1,000,000 mm  1 meter = 100 centimeters (cm)  1 centimeter = 10 millimeters (mm)
Examples If a map has a scale of 1/24,000, a measured distance of 8.25 inches on the map represents an actual distance of 198,000 inches 8.25 X 24,000 = 198,000 inches 198,000 inches / 12 = 16,500 feet 198,000 inches / 63,360 = 3.1 miles
Examples If a map has a scale of 1/50,000, a measured distance of 22 centimeters on the map represents an actual distance of 1,100,000 cm 22 cm X 50,000 = 1,100,000 cm To calculate the actual distance in meters and kilometers: 1,100,000 cm / 100 = 11,000 meters 1,100,000 cm / 100,000 = 11 kilometers
Large Versus Small Scale Maps Large scale maps refer to maps with a relatively large representative fraction such as 1/10,000. Large scale maps show a small area of the Earth in great detail. Small scale maps refer to maps with a relatively small representative fraction like 1/1,000,000. Small scale maps show large areas in less detail. Small Scale  Medium Scale  Large Scale
Map Projections http://www.classzone.com/books/earth_science/terc/content/investigations/es0301/es0301page01.cfm This is the website that your worksheet came from. It has animations and illustrations beyond what is on your worksheet and you are strongly encouraged to visit it.
Map Projection Only a globe can show the true area, shape, direction, and distance relationships of the spherical surface of Earth. It is impossible to show all of these relationships on a map without distortion.
Equivalence and conformity are the most important properties of maps. An  equivalent map  or an  equal area map  shows correct area relationships over the entire map.  With an equivalent map, the area of one region on the map can be directly compared with the area of any other region. The Lambert cylindrical equal-area projection as an example of an equivalent, cylindrical projection   http://www.kartografie.nl/geometrics/Map%20projections/body.htm
In contrast, a  conformal map  shows the correct angular relationships over the entire map. In other words, a conformal map shows the correct shape of features in a  limited area. The true shapes of the continents can only be shown with a glove. www.kartografie.nl/.../body.htm
It is impossible for a map to be both equivalent and conformal, and many maps are neither, but are a compromise. Distortions are most pronounced on world maps, on large scale maps showing limited areas, distortions may not be a serious problem. Properties other than equivalence and conformity may also be maintained on a map. True direction can be retained in some projections or along a specific set of lines.
Map Projections Cartographers transfer the surface features of the Earth to a map by mathematically “projecting” the  graticule  (the grid of latitude and longitude) out from the spere onto a flat surface.
Map Projections In the example shown in figure 2, the  plane projection  is tangent to the North Pole, and so would be suitable for maps of polar regions. The  cylindrical projection  is tangent to the equator, and would produce a map with low distortion in the equatorial regions. The  conic projection  is tangent to a parallel in the midlatitudes, making is a good choice for the midlatitude regions. Some cylindrical and conic projections are based on more than one standard parallel. A fourth family of map projection is called  pseudocylindrical.  These are mathematically based on a cylinder, tangent to the equator, but the cylinder curves back down toward the pokes so that the projection gives a sense of the curvature of the earth The  Eckert  (figure 1b) is based on a pseudocylindrical projection. http://lh4.ggpht.com/FaizRious73/R8jSlC3rAaI/AAAAAAAAAaU/3Je0VCBRfj8/The+three+classes+of+map+projections%5B5%5D
Characteristics of Map Projections There is no single map that is good for all purposes. Different projections produce maps that are suitable for different uses. The  conformal Mercator  (fig 1a) is based on a cylindrical projection. On the Mercator, any straight line is a  rhumb line , or a line of constant direction, making these maps useful for navigation.
Characteristics of Map Projections The Robinson (fig 3) is a  pseudocylindrical projection  that is increasingly becoming the standard compromise projection used for wall maps of the world. It is neither conformal nor equivalent, but offers a good balance between correct shape and correct area.
Characteristics of Map Projections The  Lambert Conformal Conic  projection (fig 4) uses two standard parallels, and is often used by the US Geological Survey for large scale topographic maps. http://www.geog.ucsb.edu/~kclarke/G176B/stpar.jpg http://www.staff.amu.edu.pl/~zbzw/glob/plcc.jpg
Characteristics of Map Projections Orthographic projections  (fig 5a) are known as perspective maps. They make Earth appear as it would from space. On  gnomic maps  (fig 5b) a straight line represents a path along a  great circle  (the largest circle that can be drawn on a sphere) and shows the shortest path between two points. Both orthographic and gnomic maps are based on plane projections.
Characteristics of Map Projections An interesting type of cylindrical projection is the  Transverse Mercator  (fig 5c). Instead of being tangent to the equator, the Transverse Mercator is tangent to a standard meridian (for example the 90°W / 90°E meridian in the example shown in the lab book). The Transverse Mercator is conformal, and is used on many US Geological Survey topographic maps.
Characteristics of Map Projections Goode’s Interrupted Homolosine  projection (fig 6) is widely used to show the distribution of phenomena on the continents. The Goode’s Interrupted projection is equivalent, yet the shapes of the land masses are also very well maintained.
Map Projection Page: good examples of distortion http://maps.unomaha.edu/Peterson/carta/Assign/ProjectionPage/ProjectionPage.htm What is a map projection? http://www.kartografie.nl/geometrics/Map%20projections/body.htm

Map scale and projection

  • 1.
    Map Scale andProjection Lab Three
  • 2.
    Map Scale The scale of a map indicates how much the Earth has been reduced for reproduction on that map. In practical terms, scale is the relationship between the distance shown on a map and the actual distance that it represents on the Earth.
  • 3.
    Ways to IndicateScale There are two common ways to indicate the scale of a map: Graphic scales See figure 1 in lab manual Fractional scales Example 1:24,000 Graphic Scale
  • 4.
    Graphic Scale Thegraphic scale of a map is a bar graph graduates by distance. Figure one in the lab manual shows the graphic map scale from a U.S. Geological Survey topographic map. To use a graphic scale, simply measure a distance on the map (or mark off the distance on the edge of a piece of paper), then compare the measured distance to the bar graph to determine the actual distance represented. On some graphic scales, “zero” is not at the far left, this is to make it easier to read fractions. Graphic scales are useful since they remain accurate even if the map is enlarged or reduced.
  • 5.
    Fractional Scale Thefractional scale or the representative scale expresses the scale of a map as a fraction or ratio. 1/24,000 or 1:24,000 This scale, which is read “one to twenty-four thousand”, says that one unit of measurement on the map represents 24,000 units of measurement on the Earth. At this scale, one centimeter on the map represents an actual distance of 24,000 centimeters on the Earth, and one inch on the map equals 24,000 inches on the map. Units of measurement must be the same in both the numerator and the denominator.
  • 6.
    Computing Distances withFractional Scales To determine distances represented on a map by using the fractional scale: Use a ruler to measure the distance on the map in inches (or centimeters). This is the measured distance . Multiply the measured distance by the map’s fractional scale denominator. This will give you the actual distance in inches (or centimeters). To convert your actual distance in inches (or centimeters) to other units, use the following formulas:
  • 7.
    To determine thedistance in feet , actual distance in inches / 12 To determine the distance in miles , actual distance in inches / 63,360 To determine the distance in meters , actual distance in centimeters / 100 To determine the distance in kilometers , actual distance in centimeters / 100,000
  • 8.
    English Measurements 1mile = 5280 ft 1 mile = 63360 inches 1 foot = 12 inches
  • 9.
    Metric Measurements 1Kilometer (Km) = 1,000 meters (m) 1 Kilometer (Km) = 100,000 cm 1 Kilometer (Km) = 1,000,000 mm 1 meter = 100 centimeters (cm) 1 centimeter = 10 millimeters (mm)
  • 10.
    Examples If amap has a scale of 1/24,000, a measured distance of 8.25 inches on the map represents an actual distance of 198,000 inches 8.25 X 24,000 = 198,000 inches 198,000 inches / 12 = 16,500 feet 198,000 inches / 63,360 = 3.1 miles
  • 11.
    Examples If amap has a scale of 1/50,000, a measured distance of 22 centimeters on the map represents an actual distance of 1,100,000 cm 22 cm X 50,000 = 1,100,000 cm To calculate the actual distance in meters and kilometers: 1,100,000 cm / 100 = 11,000 meters 1,100,000 cm / 100,000 = 11 kilometers
  • 12.
    Large Versus SmallScale Maps Large scale maps refer to maps with a relatively large representative fraction such as 1/10,000. Large scale maps show a small area of the Earth in great detail. Small scale maps refer to maps with a relatively small representative fraction like 1/1,000,000. Small scale maps show large areas in less detail. Small Scale Medium Scale Large Scale
  • 13.
    Map Projections http://www.classzone.com/books/earth_science/terc/content/investigations/es0301/es0301page01.cfmThis is the website that your worksheet came from. It has animations and illustrations beyond what is on your worksheet and you are strongly encouraged to visit it.
  • 14.
    Map Projection Onlya globe can show the true area, shape, direction, and distance relationships of the spherical surface of Earth. It is impossible to show all of these relationships on a map without distortion.
  • 15.
    Equivalence and conformityare the most important properties of maps. An equivalent map or an equal area map shows correct area relationships over the entire map. With an equivalent map, the area of one region on the map can be directly compared with the area of any other region. The Lambert cylindrical equal-area projection as an example of an equivalent, cylindrical projection http://www.kartografie.nl/geometrics/Map%20projections/body.htm
  • 16.
    In contrast, a conformal map shows the correct angular relationships over the entire map. In other words, a conformal map shows the correct shape of features in a limited area. The true shapes of the continents can only be shown with a glove. www.kartografie.nl/.../body.htm
  • 17.
    It is impossiblefor a map to be both equivalent and conformal, and many maps are neither, but are a compromise. Distortions are most pronounced on world maps, on large scale maps showing limited areas, distortions may not be a serious problem. Properties other than equivalence and conformity may also be maintained on a map. True direction can be retained in some projections or along a specific set of lines.
  • 18.
    Map Projections Cartographerstransfer the surface features of the Earth to a map by mathematically “projecting” the graticule (the grid of latitude and longitude) out from the spere onto a flat surface.
  • 19.
    Map Projections Inthe example shown in figure 2, the plane projection is tangent to the North Pole, and so would be suitable for maps of polar regions. The cylindrical projection is tangent to the equator, and would produce a map with low distortion in the equatorial regions. The conic projection is tangent to a parallel in the midlatitudes, making is a good choice for the midlatitude regions. Some cylindrical and conic projections are based on more than one standard parallel. A fourth family of map projection is called pseudocylindrical. These are mathematically based on a cylinder, tangent to the equator, but the cylinder curves back down toward the pokes so that the projection gives a sense of the curvature of the earth The Eckert (figure 1b) is based on a pseudocylindrical projection. http://lh4.ggpht.com/FaizRious73/R8jSlC3rAaI/AAAAAAAAAaU/3Je0VCBRfj8/The+three+classes+of+map+projections%5B5%5D
  • 20.
    Characteristics of MapProjections There is no single map that is good for all purposes. Different projections produce maps that are suitable for different uses. The conformal Mercator (fig 1a) is based on a cylindrical projection. On the Mercator, any straight line is a rhumb line , or a line of constant direction, making these maps useful for navigation.
  • 21.
    Characteristics of MapProjections The Robinson (fig 3) is a pseudocylindrical projection that is increasingly becoming the standard compromise projection used for wall maps of the world. It is neither conformal nor equivalent, but offers a good balance between correct shape and correct area.
  • 22.
    Characteristics of MapProjections The Lambert Conformal Conic projection (fig 4) uses two standard parallels, and is often used by the US Geological Survey for large scale topographic maps. http://www.geog.ucsb.edu/~kclarke/G176B/stpar.jpg http://www.staff.amu.edu.pl/~zbzw/glob/plcc.jpg
  • 23.
    Characteristics of MapProjections Orthographic projections (fig 5a) are known as perspective maps. They make Earth appear as it would from space. On gnomic maps (fig 5b) a straight line represents a path along a great circle (the largest circle that can be drawn on a sphere) and shows the shortest path between two points. Both orthographic and gnomic maps are based on plane projections.
  • 24.
    Characteristics of MapProjections An interesting type of cylindrical projection is the Transverse Mercator (fig 5c). Instead of being tangent to the equator, the Transverse Mercator is tangent to a standard meridian (for example the 90°W / 90°E meridian in the example shown in the lab book). The Transverse Mercator is conformal, and is used on many US Geological Survey topographic maps.
  • 25.
    Characteristics of MapProjections Goode’s Interrupted Homolosine projection (fig 6) is widely used to show the distribution of phenomena on the continents. The Goode’s Interrupted projection is equivalent, yet the shapes of the land masses are also very well maintained.
  • 26.
    Map Projection Page:good examples of distortion http://maps.unomaha.edu/Peterson/carta/Assign/ProjectionPage/ProjectionPage.htm What is a map projection? http://www.kartografie.nl/geometrics/Map%20projections/body.htm