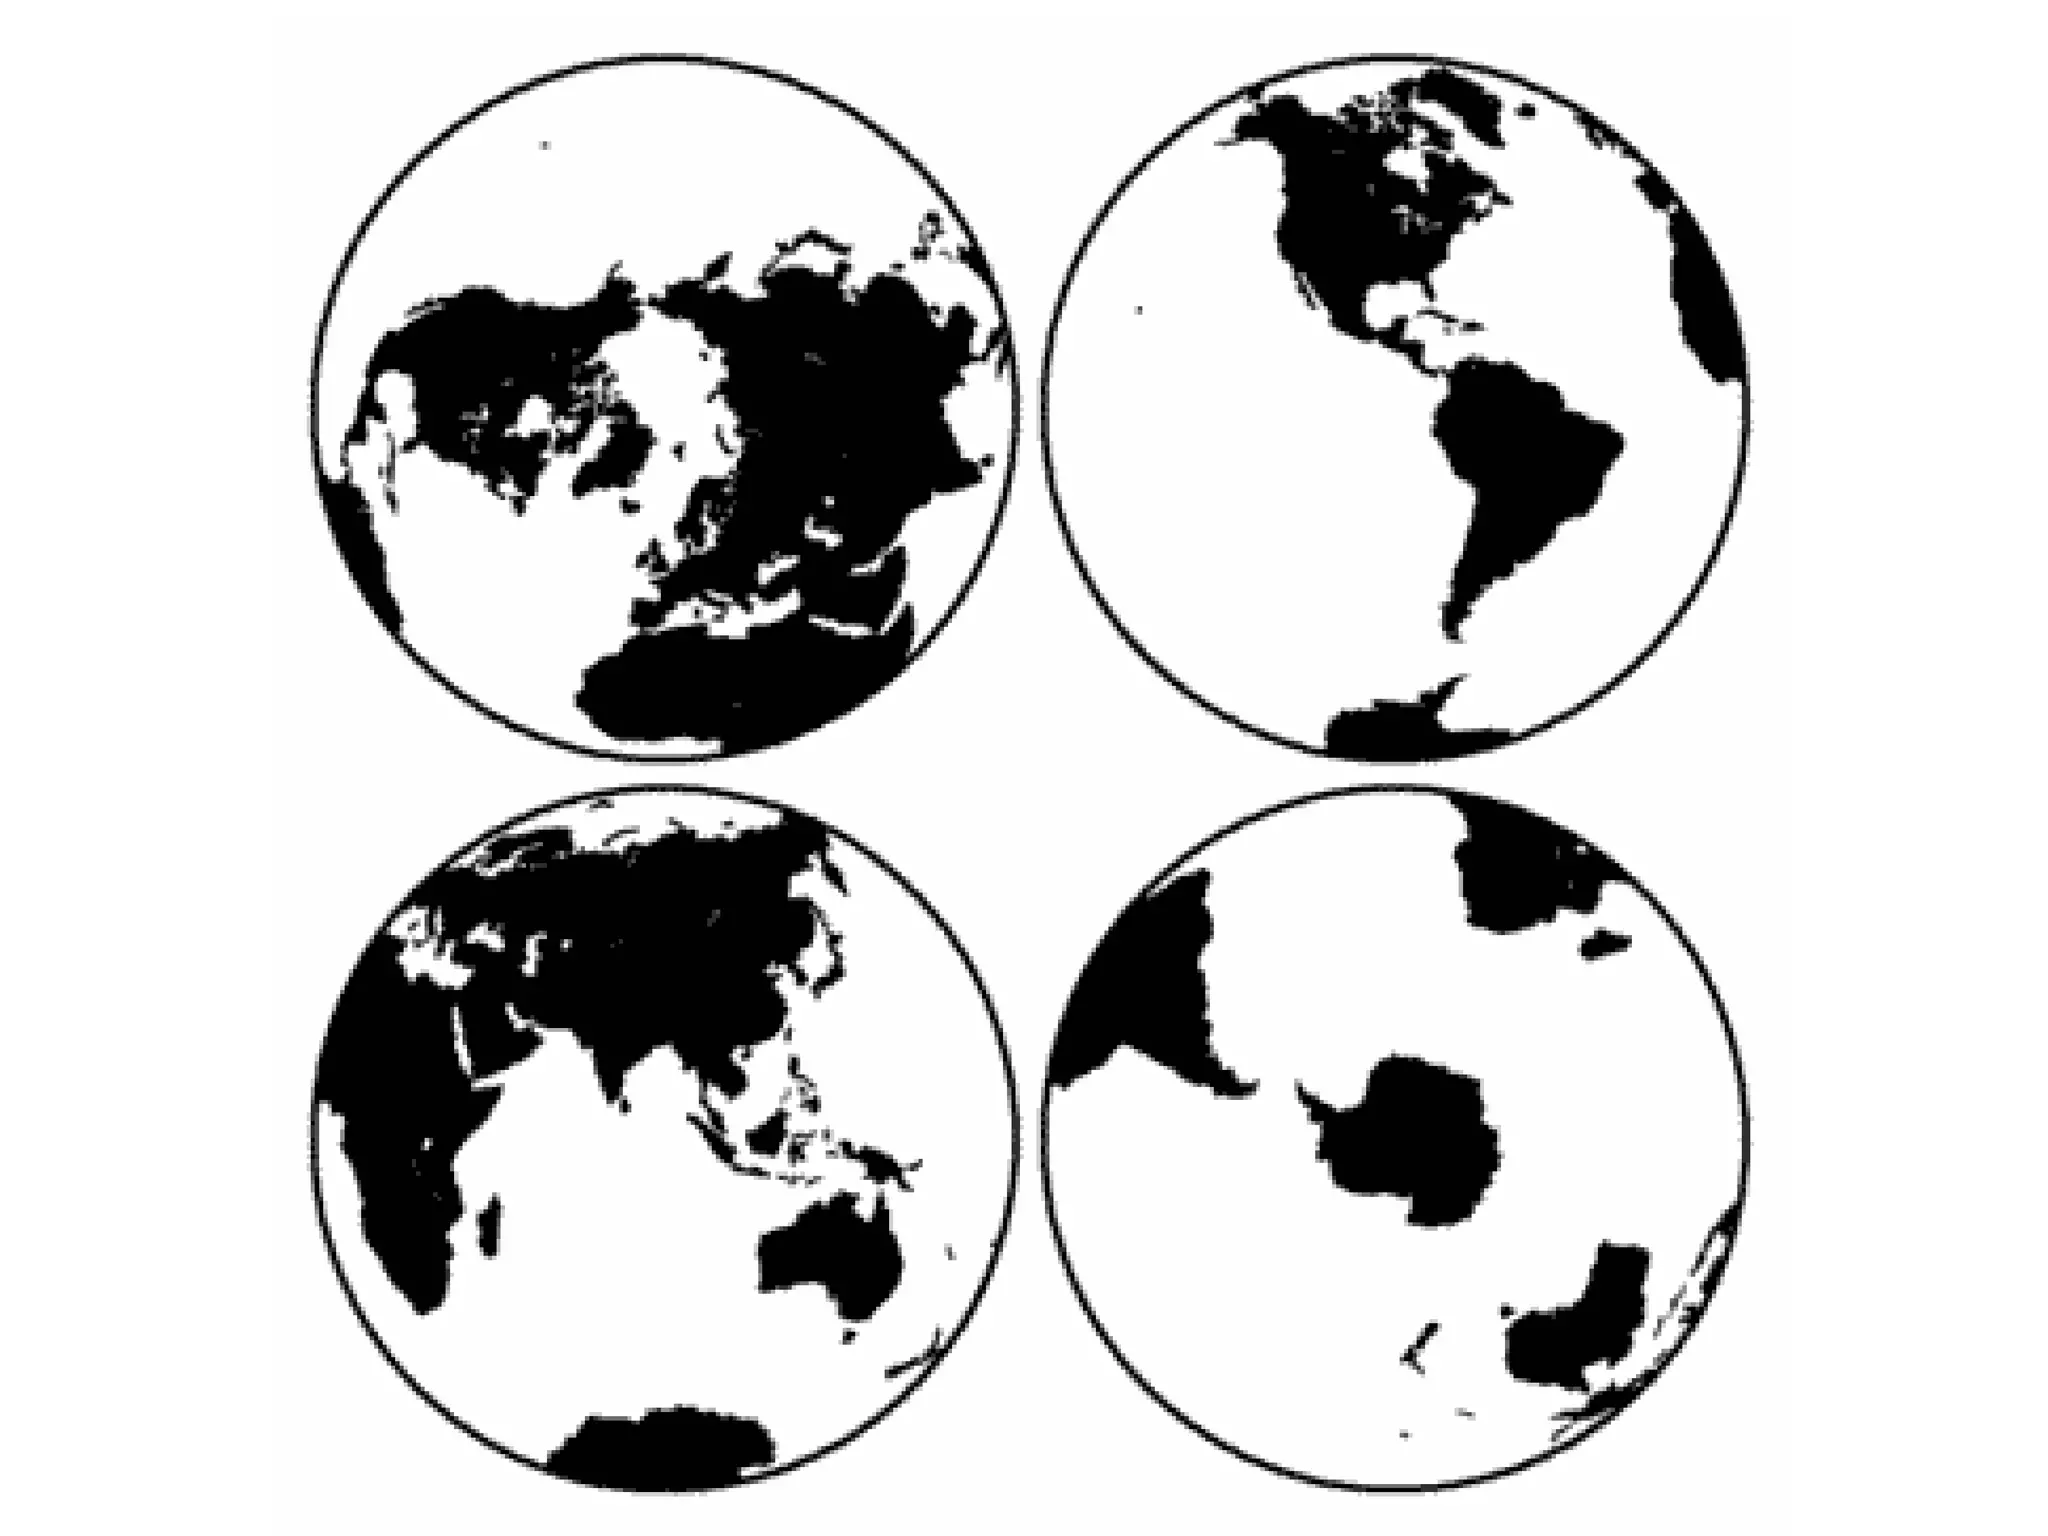
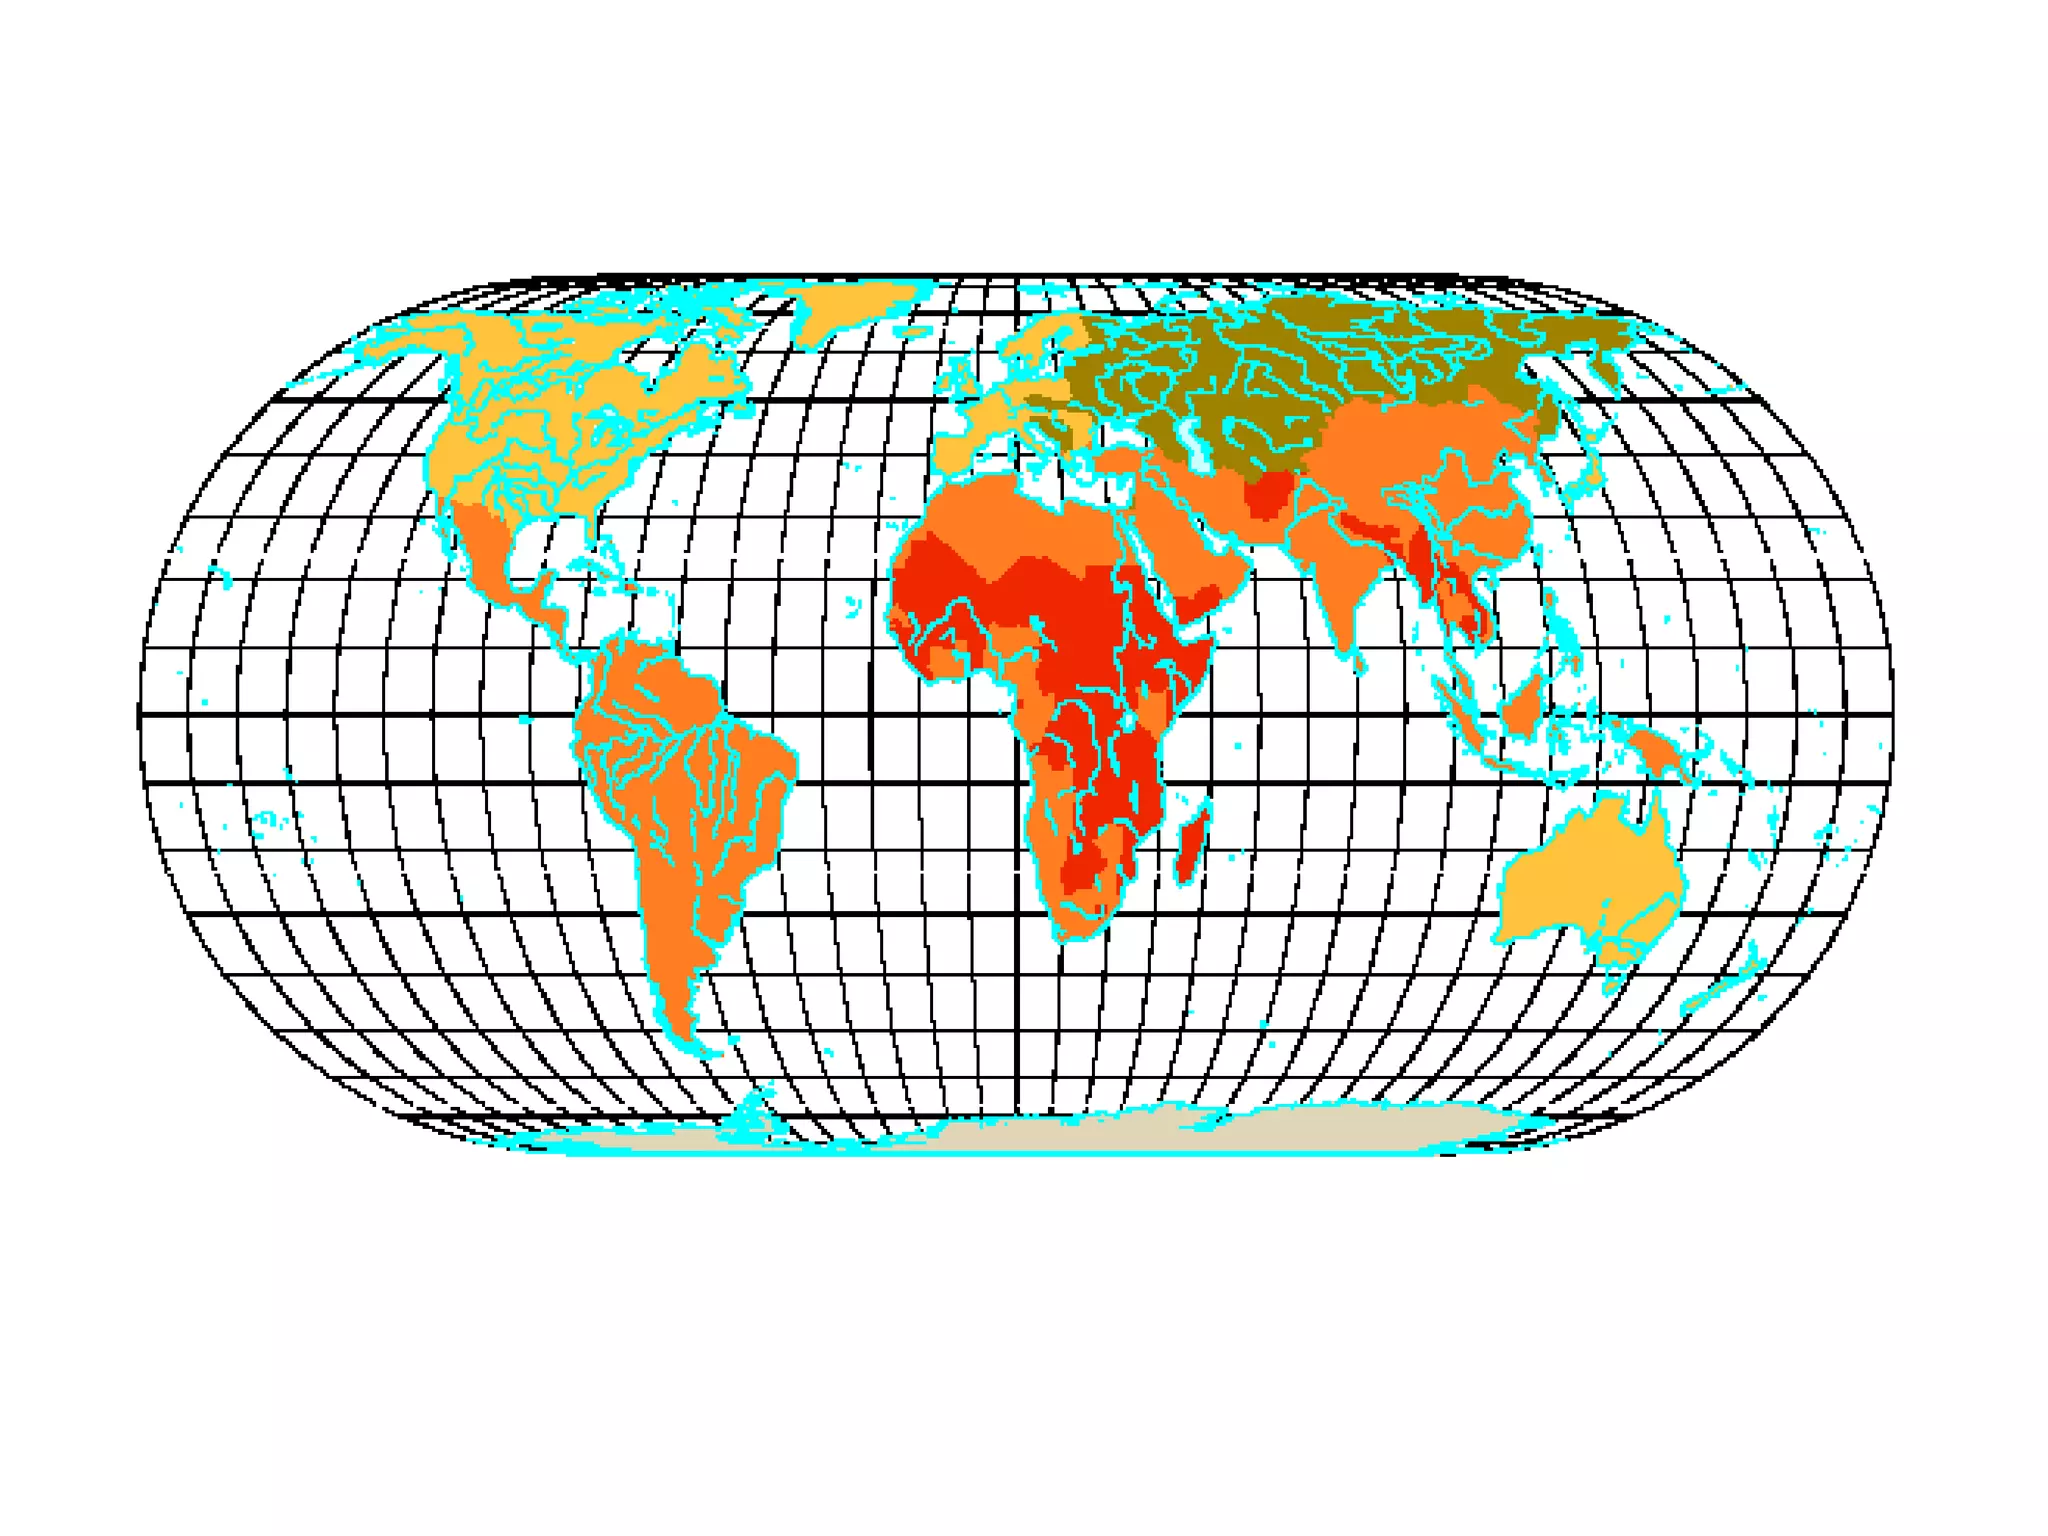
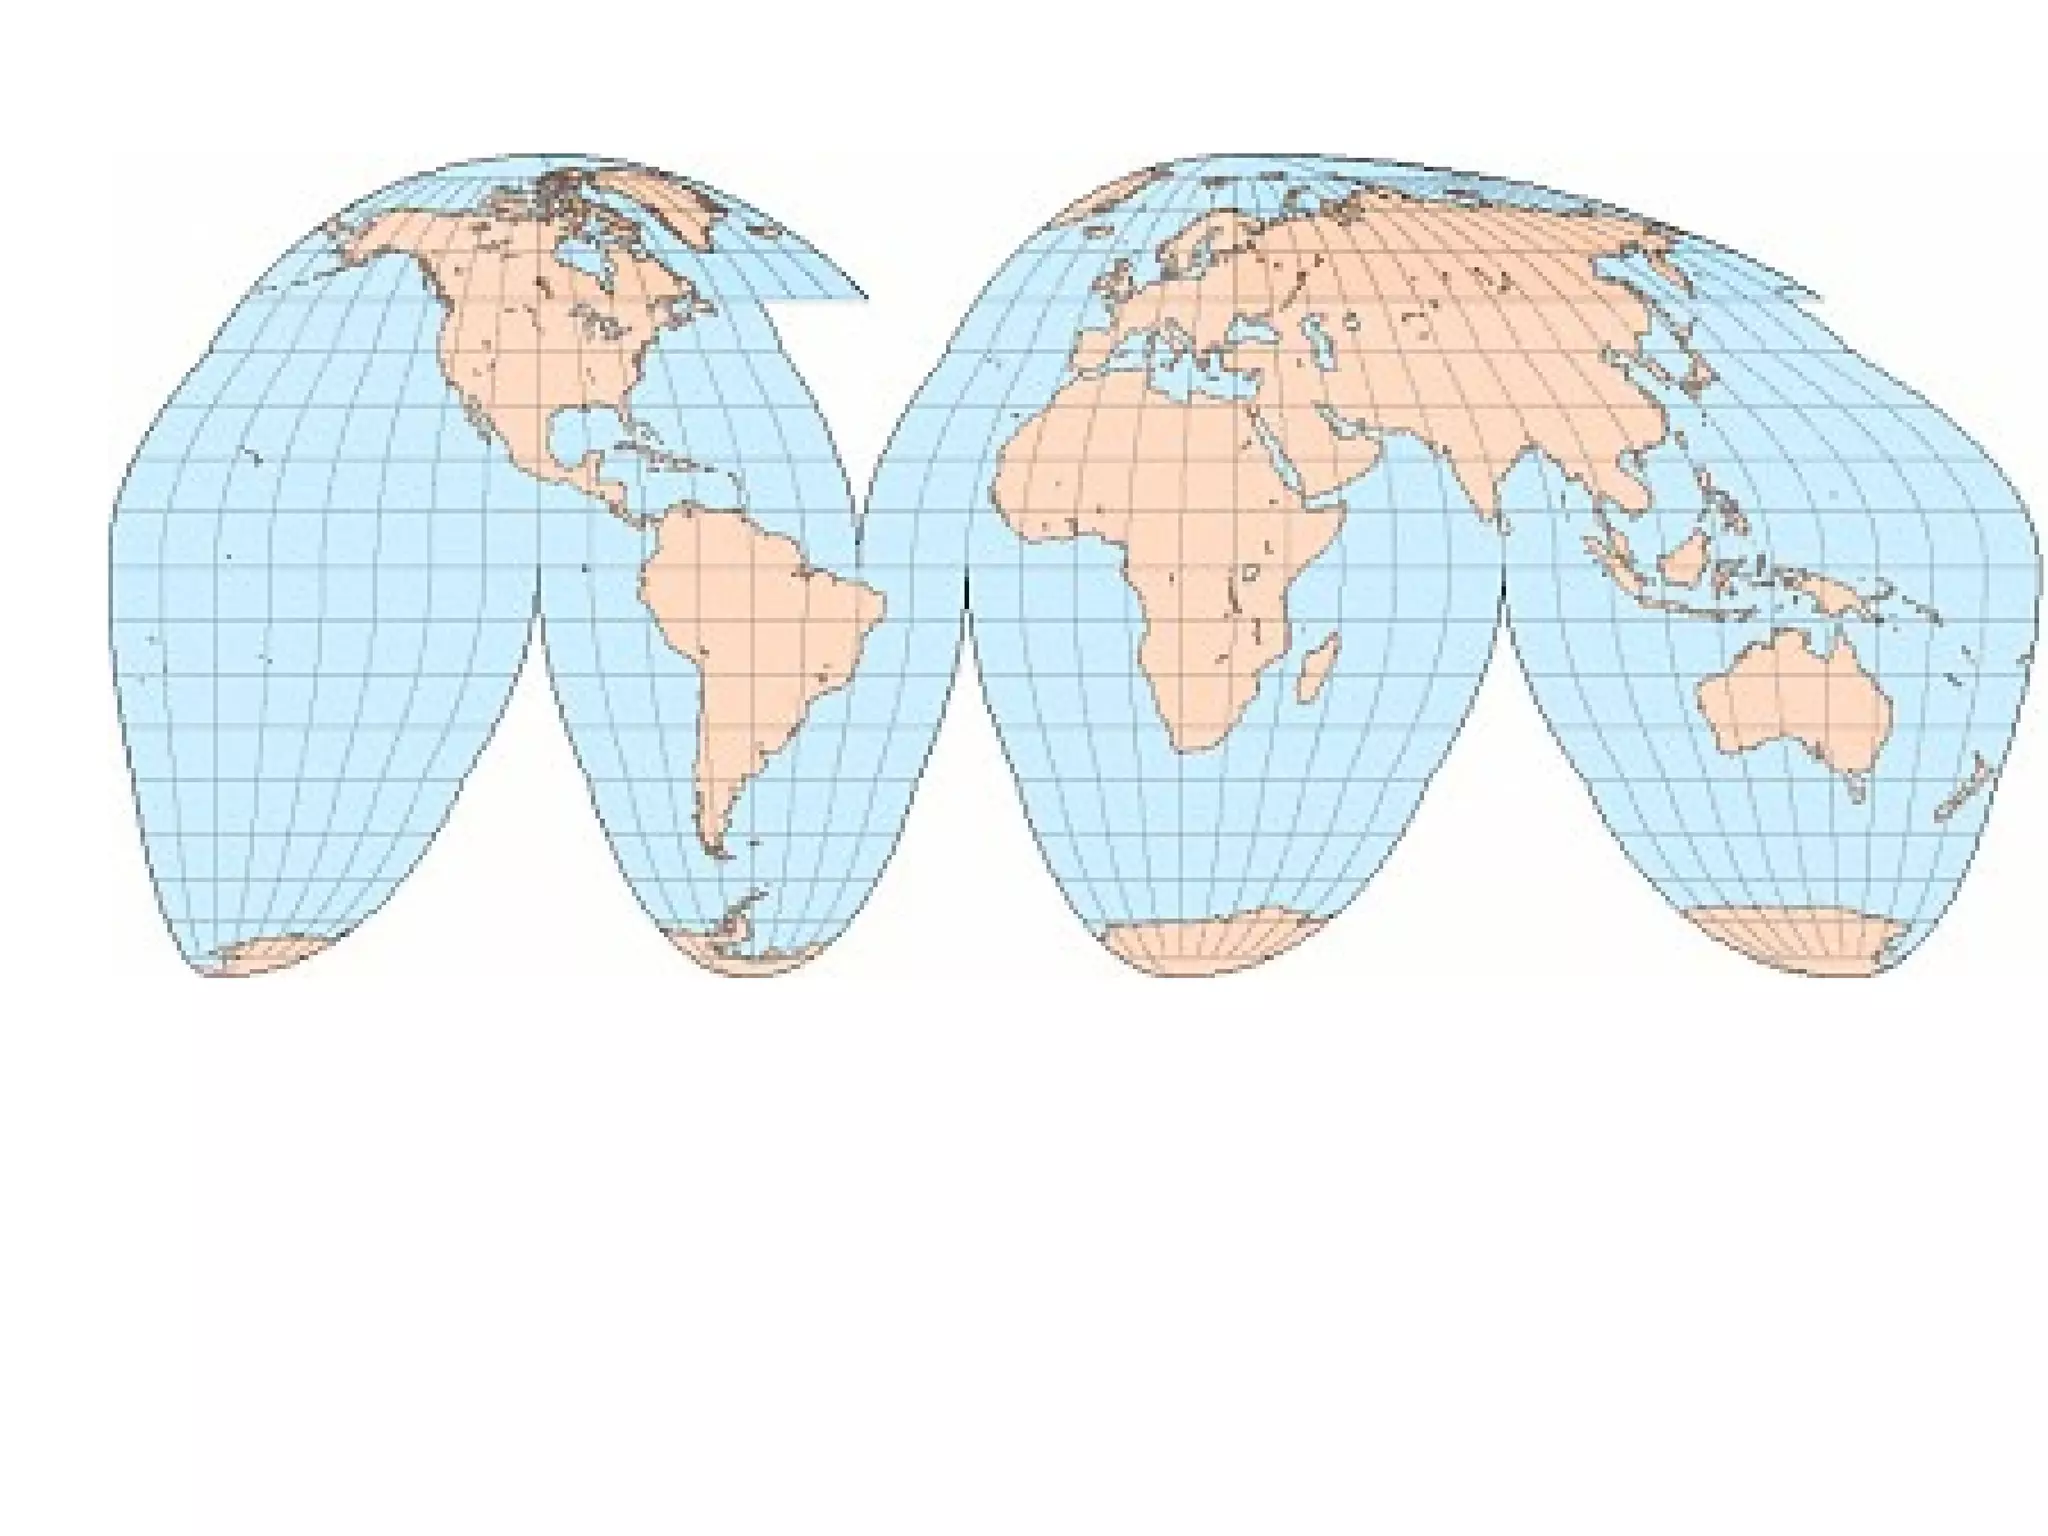
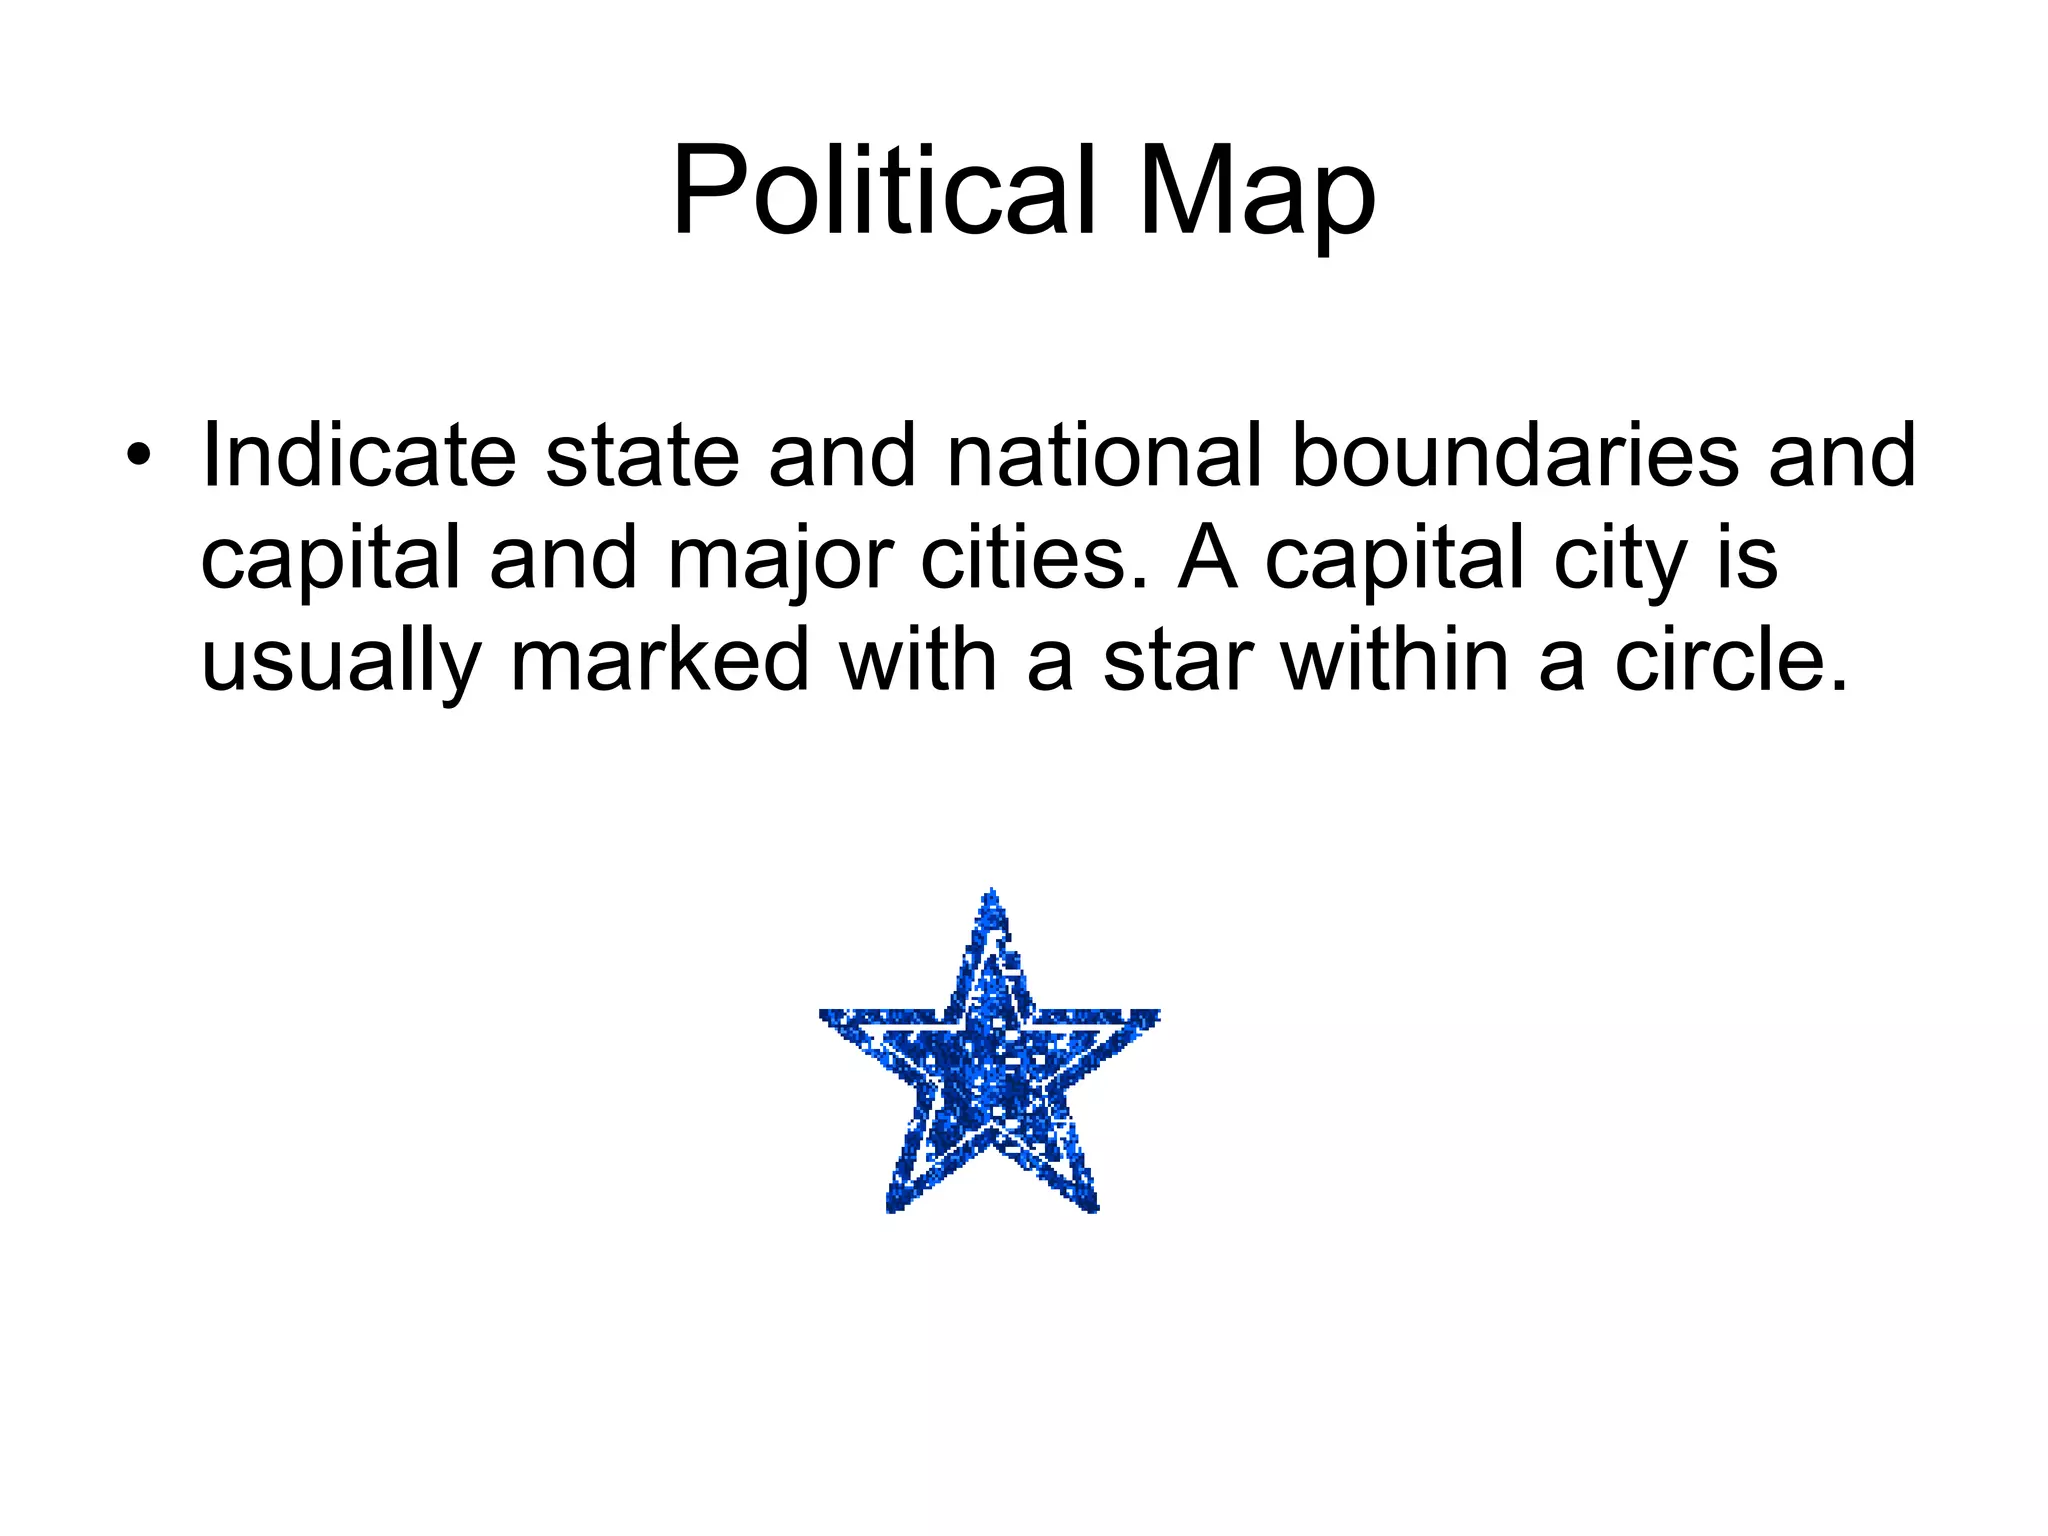
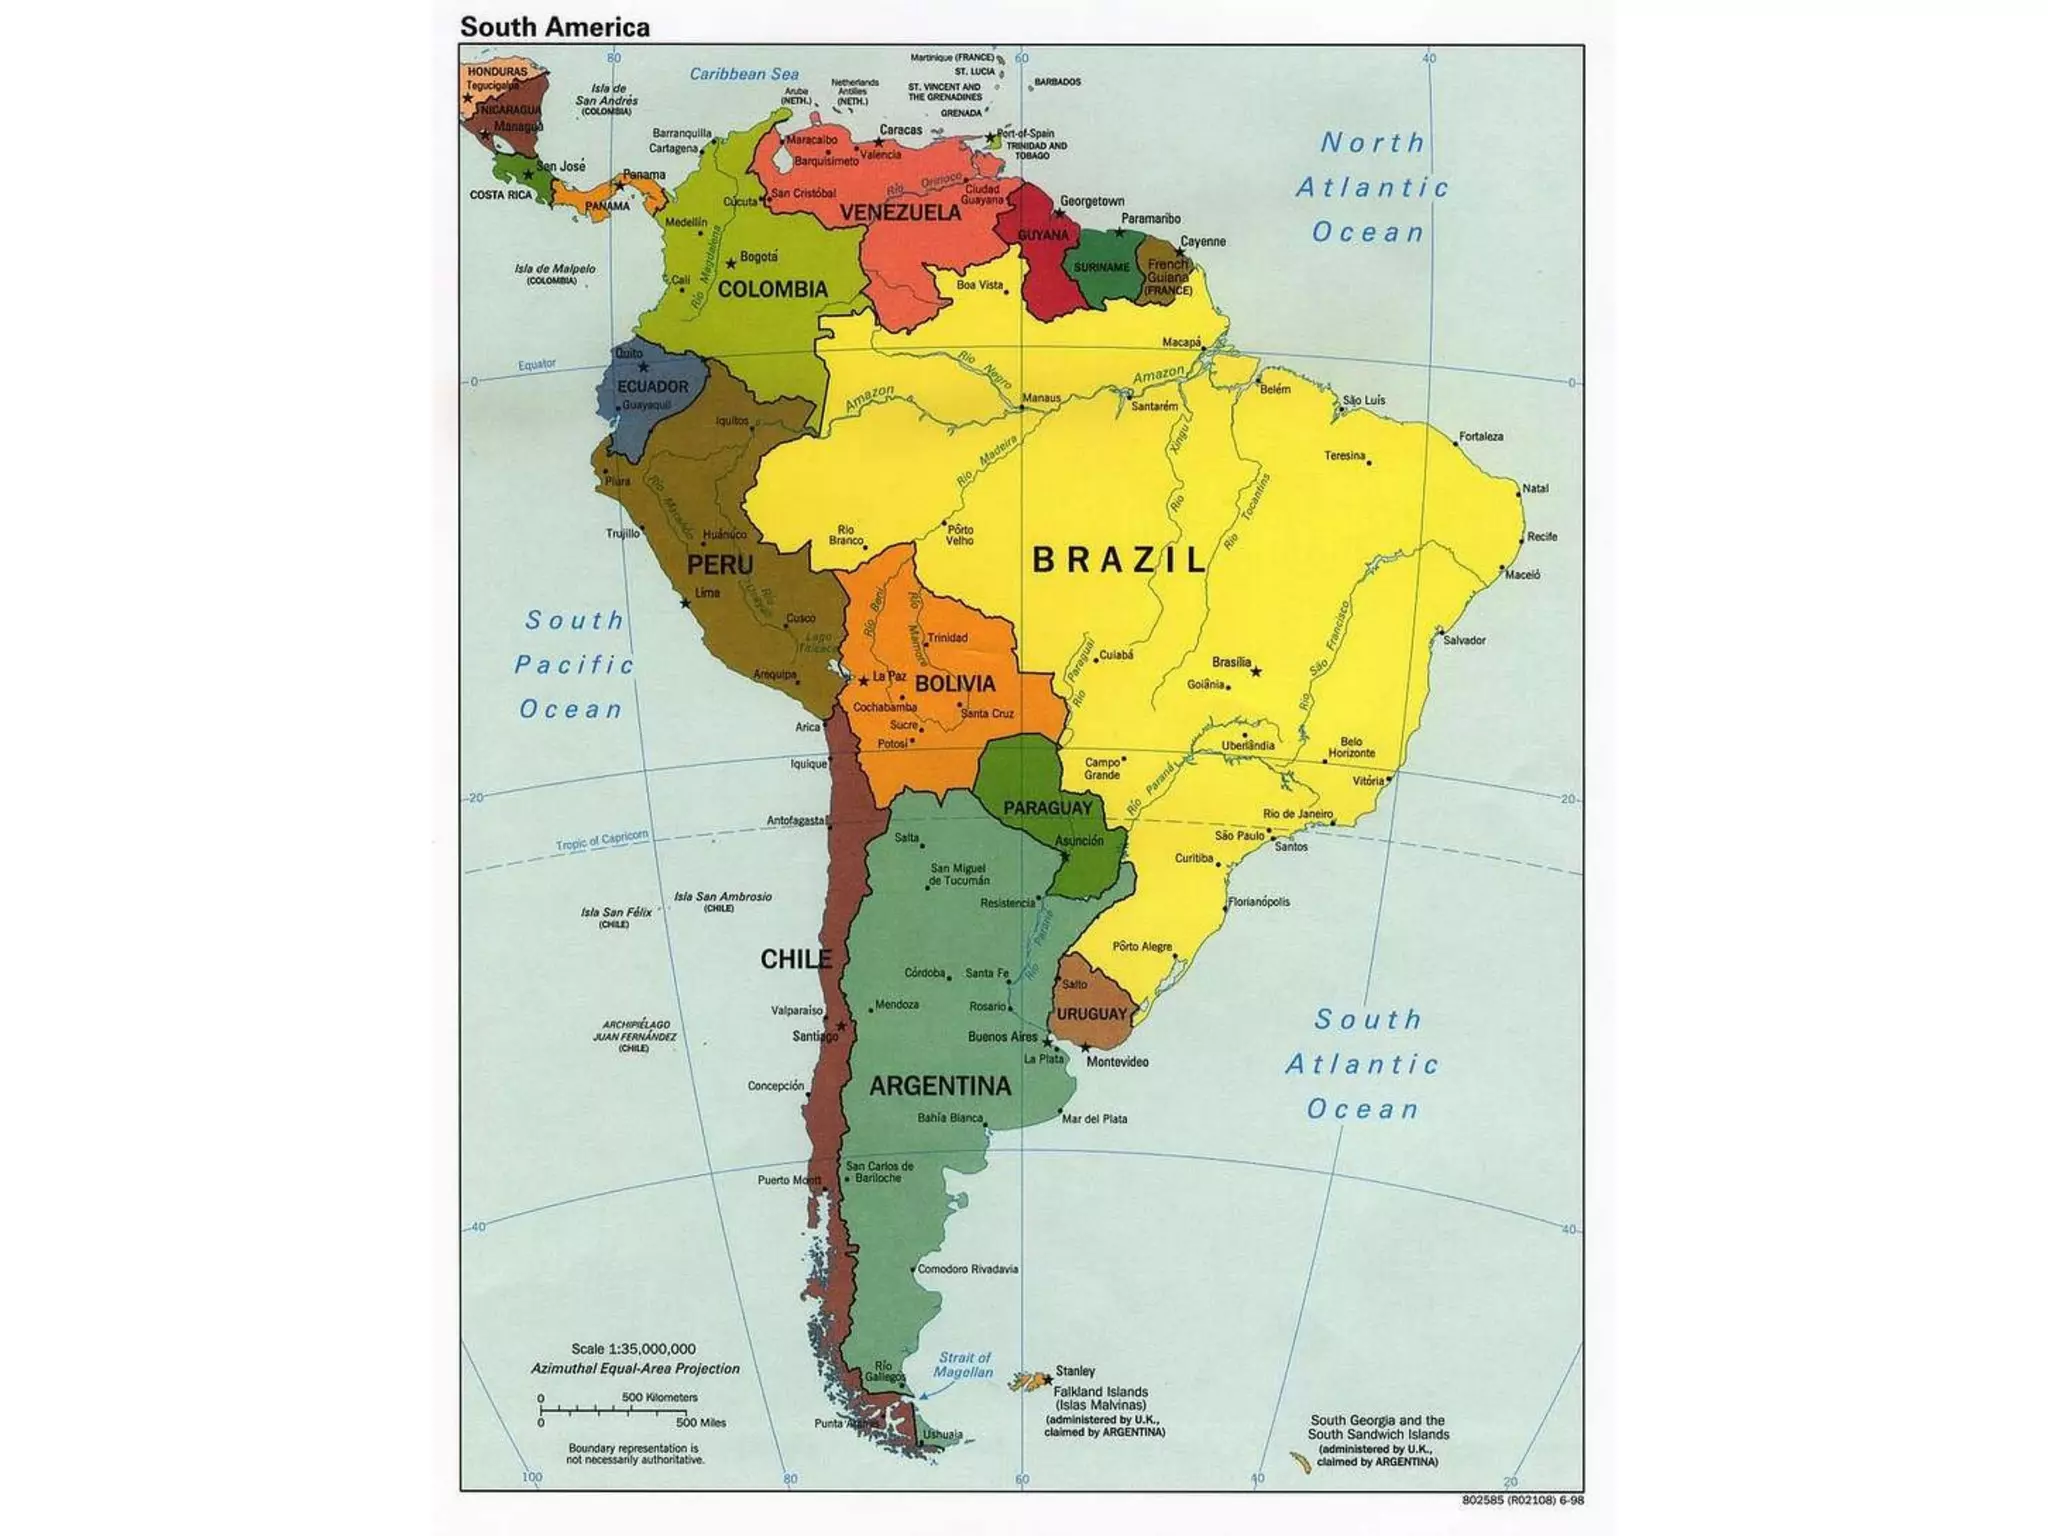
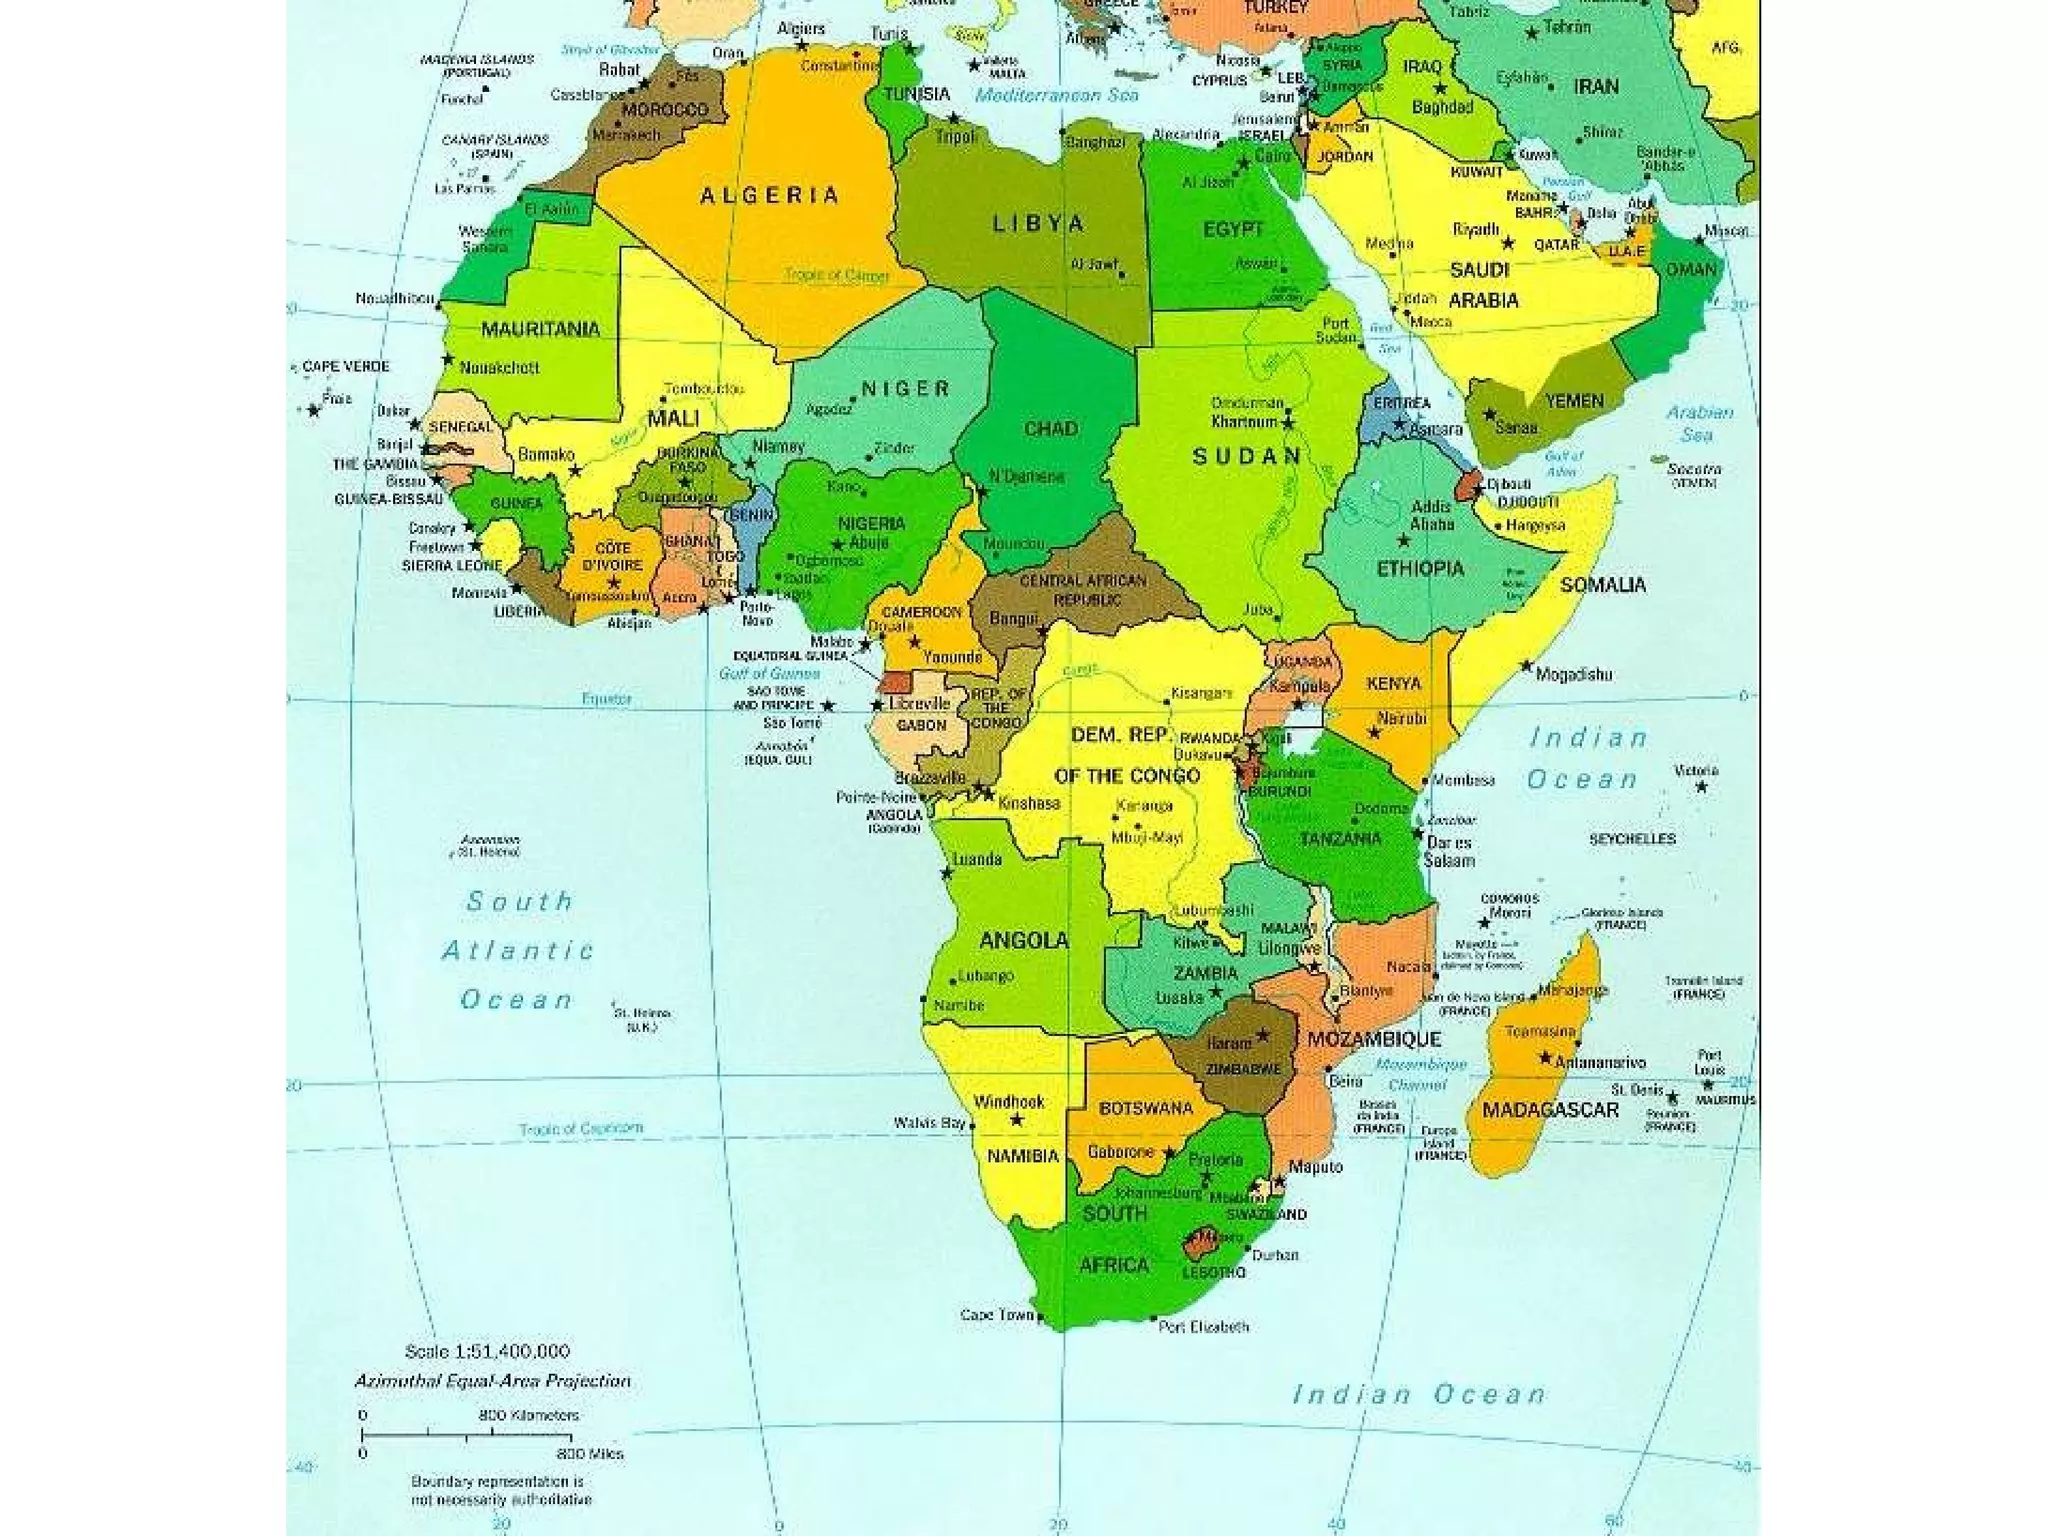
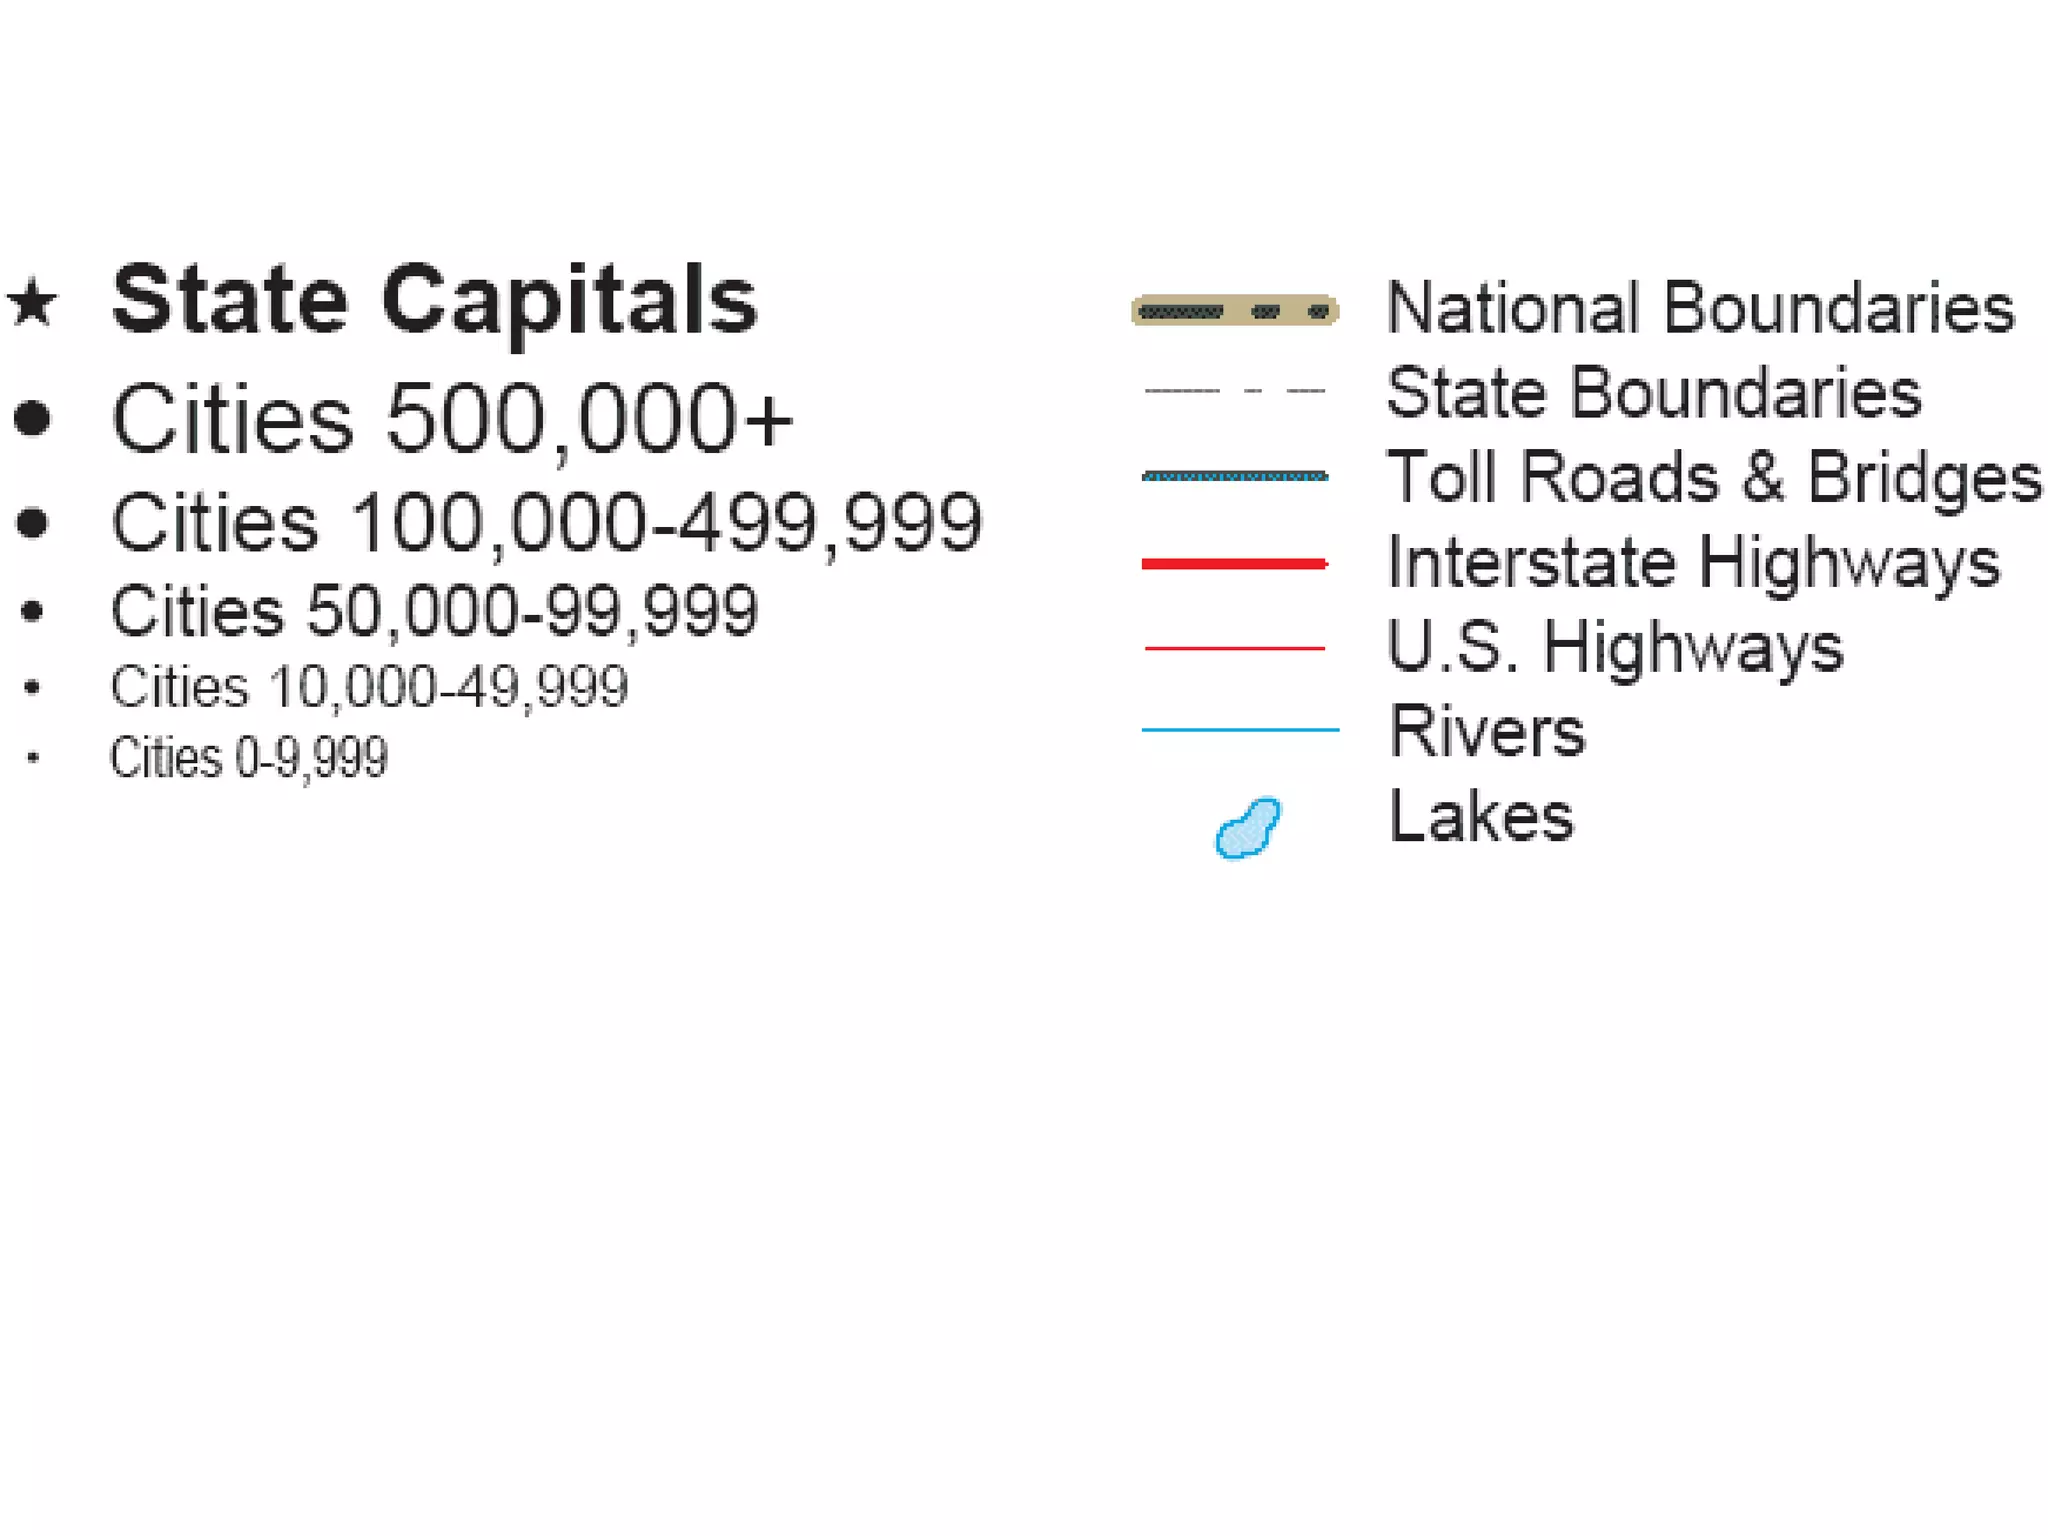
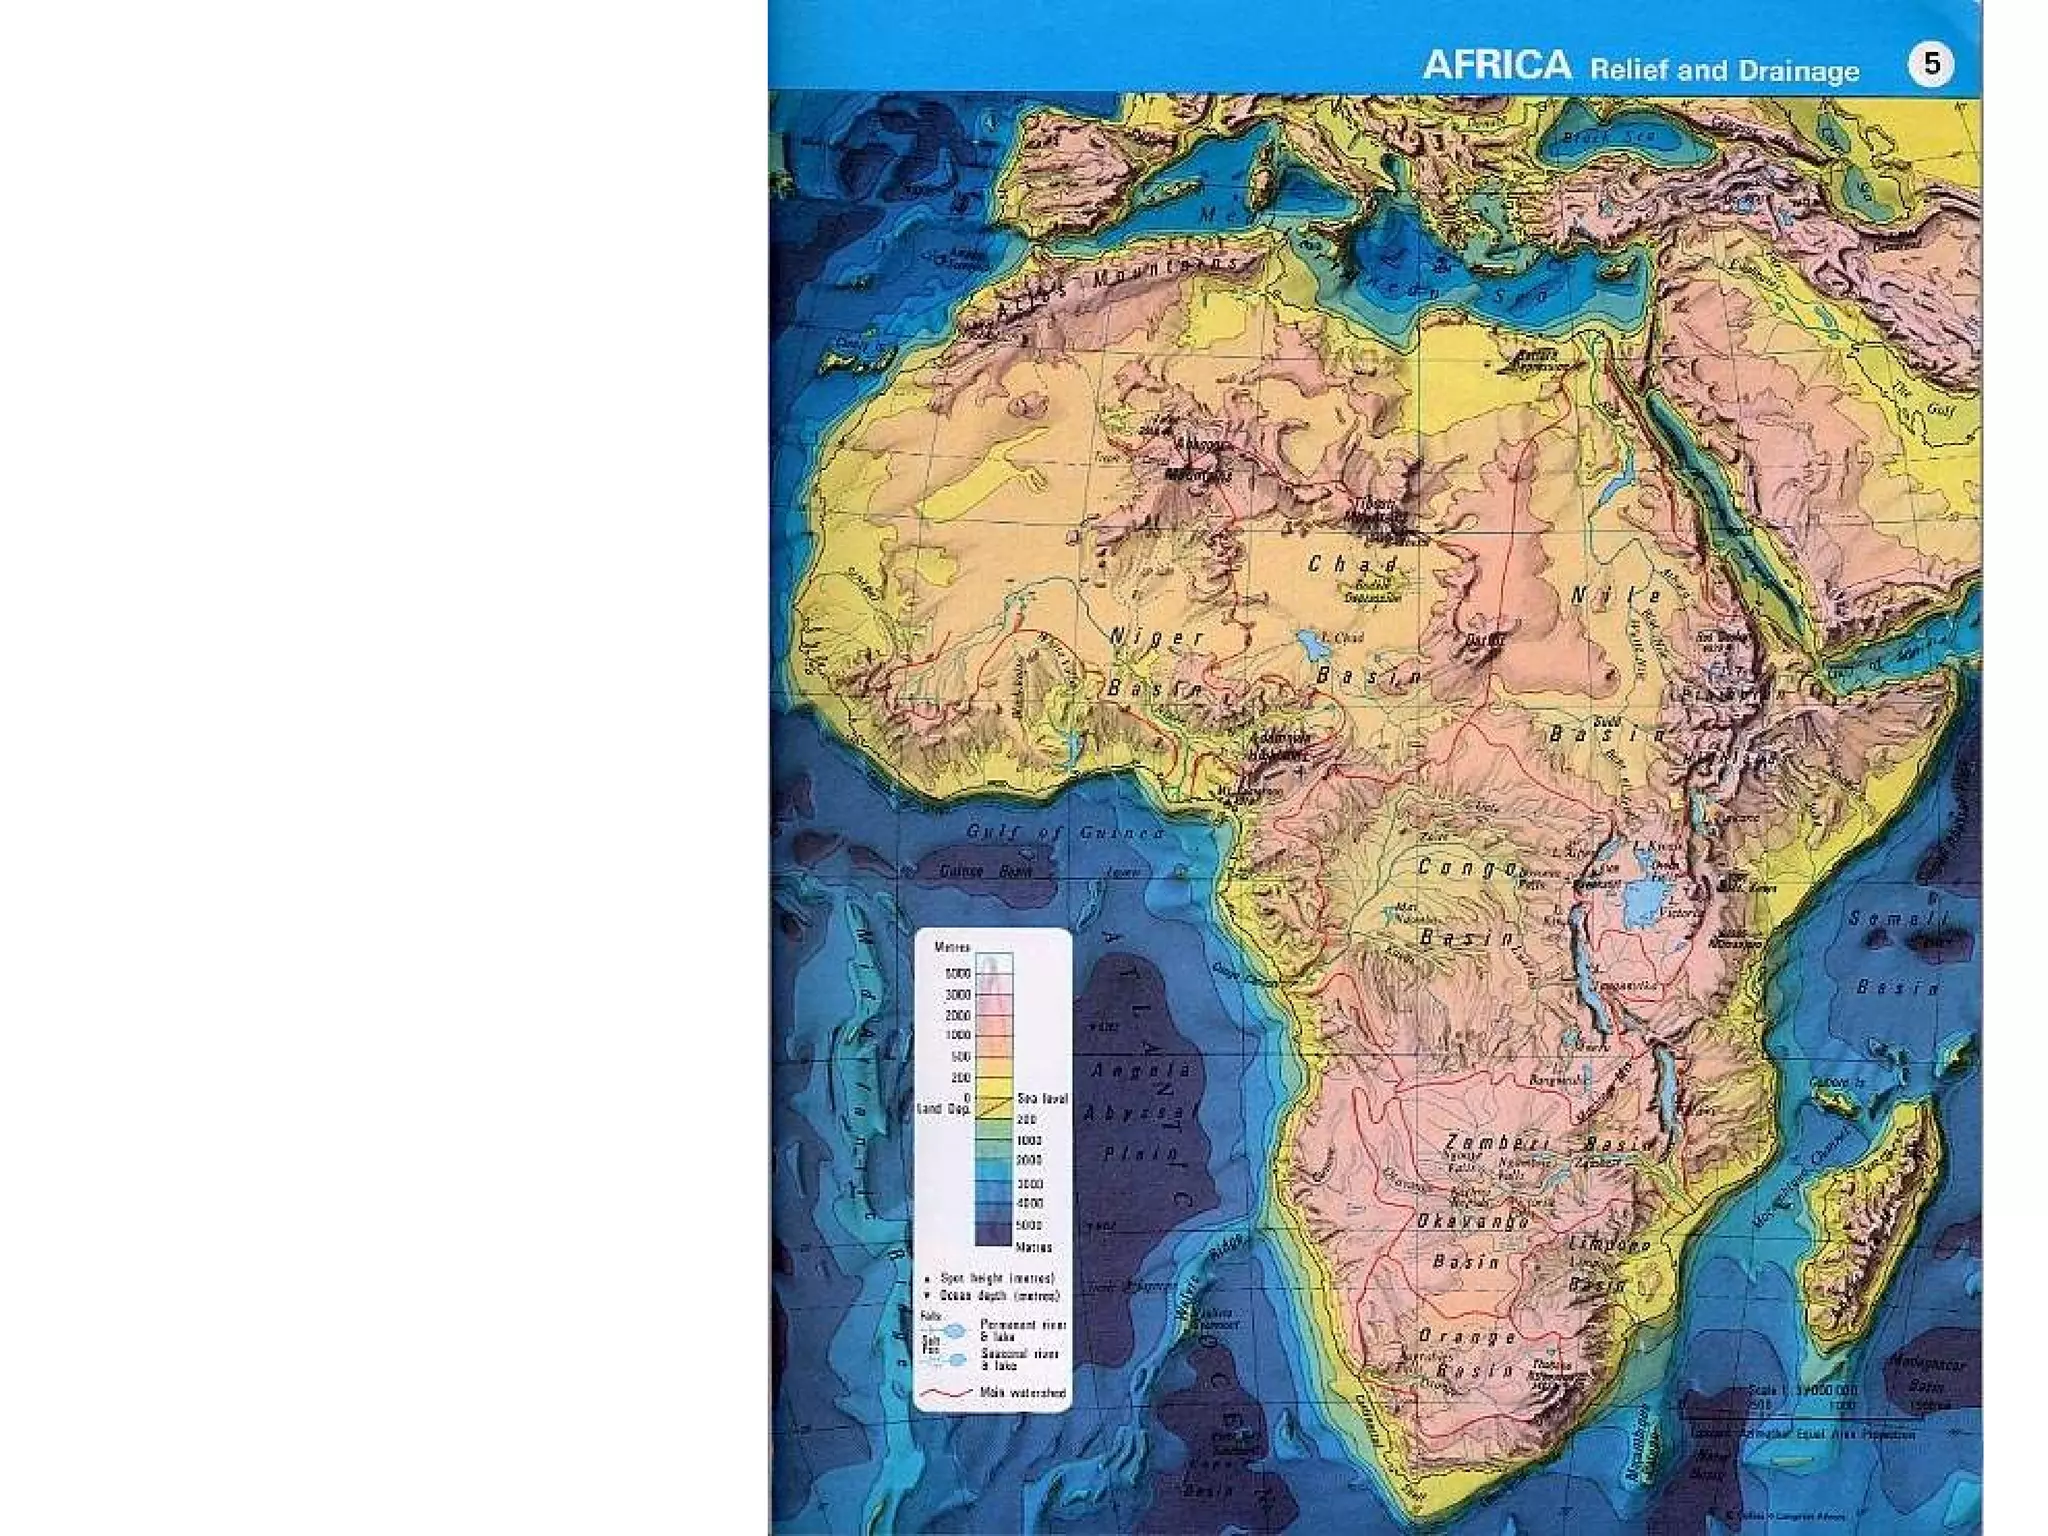
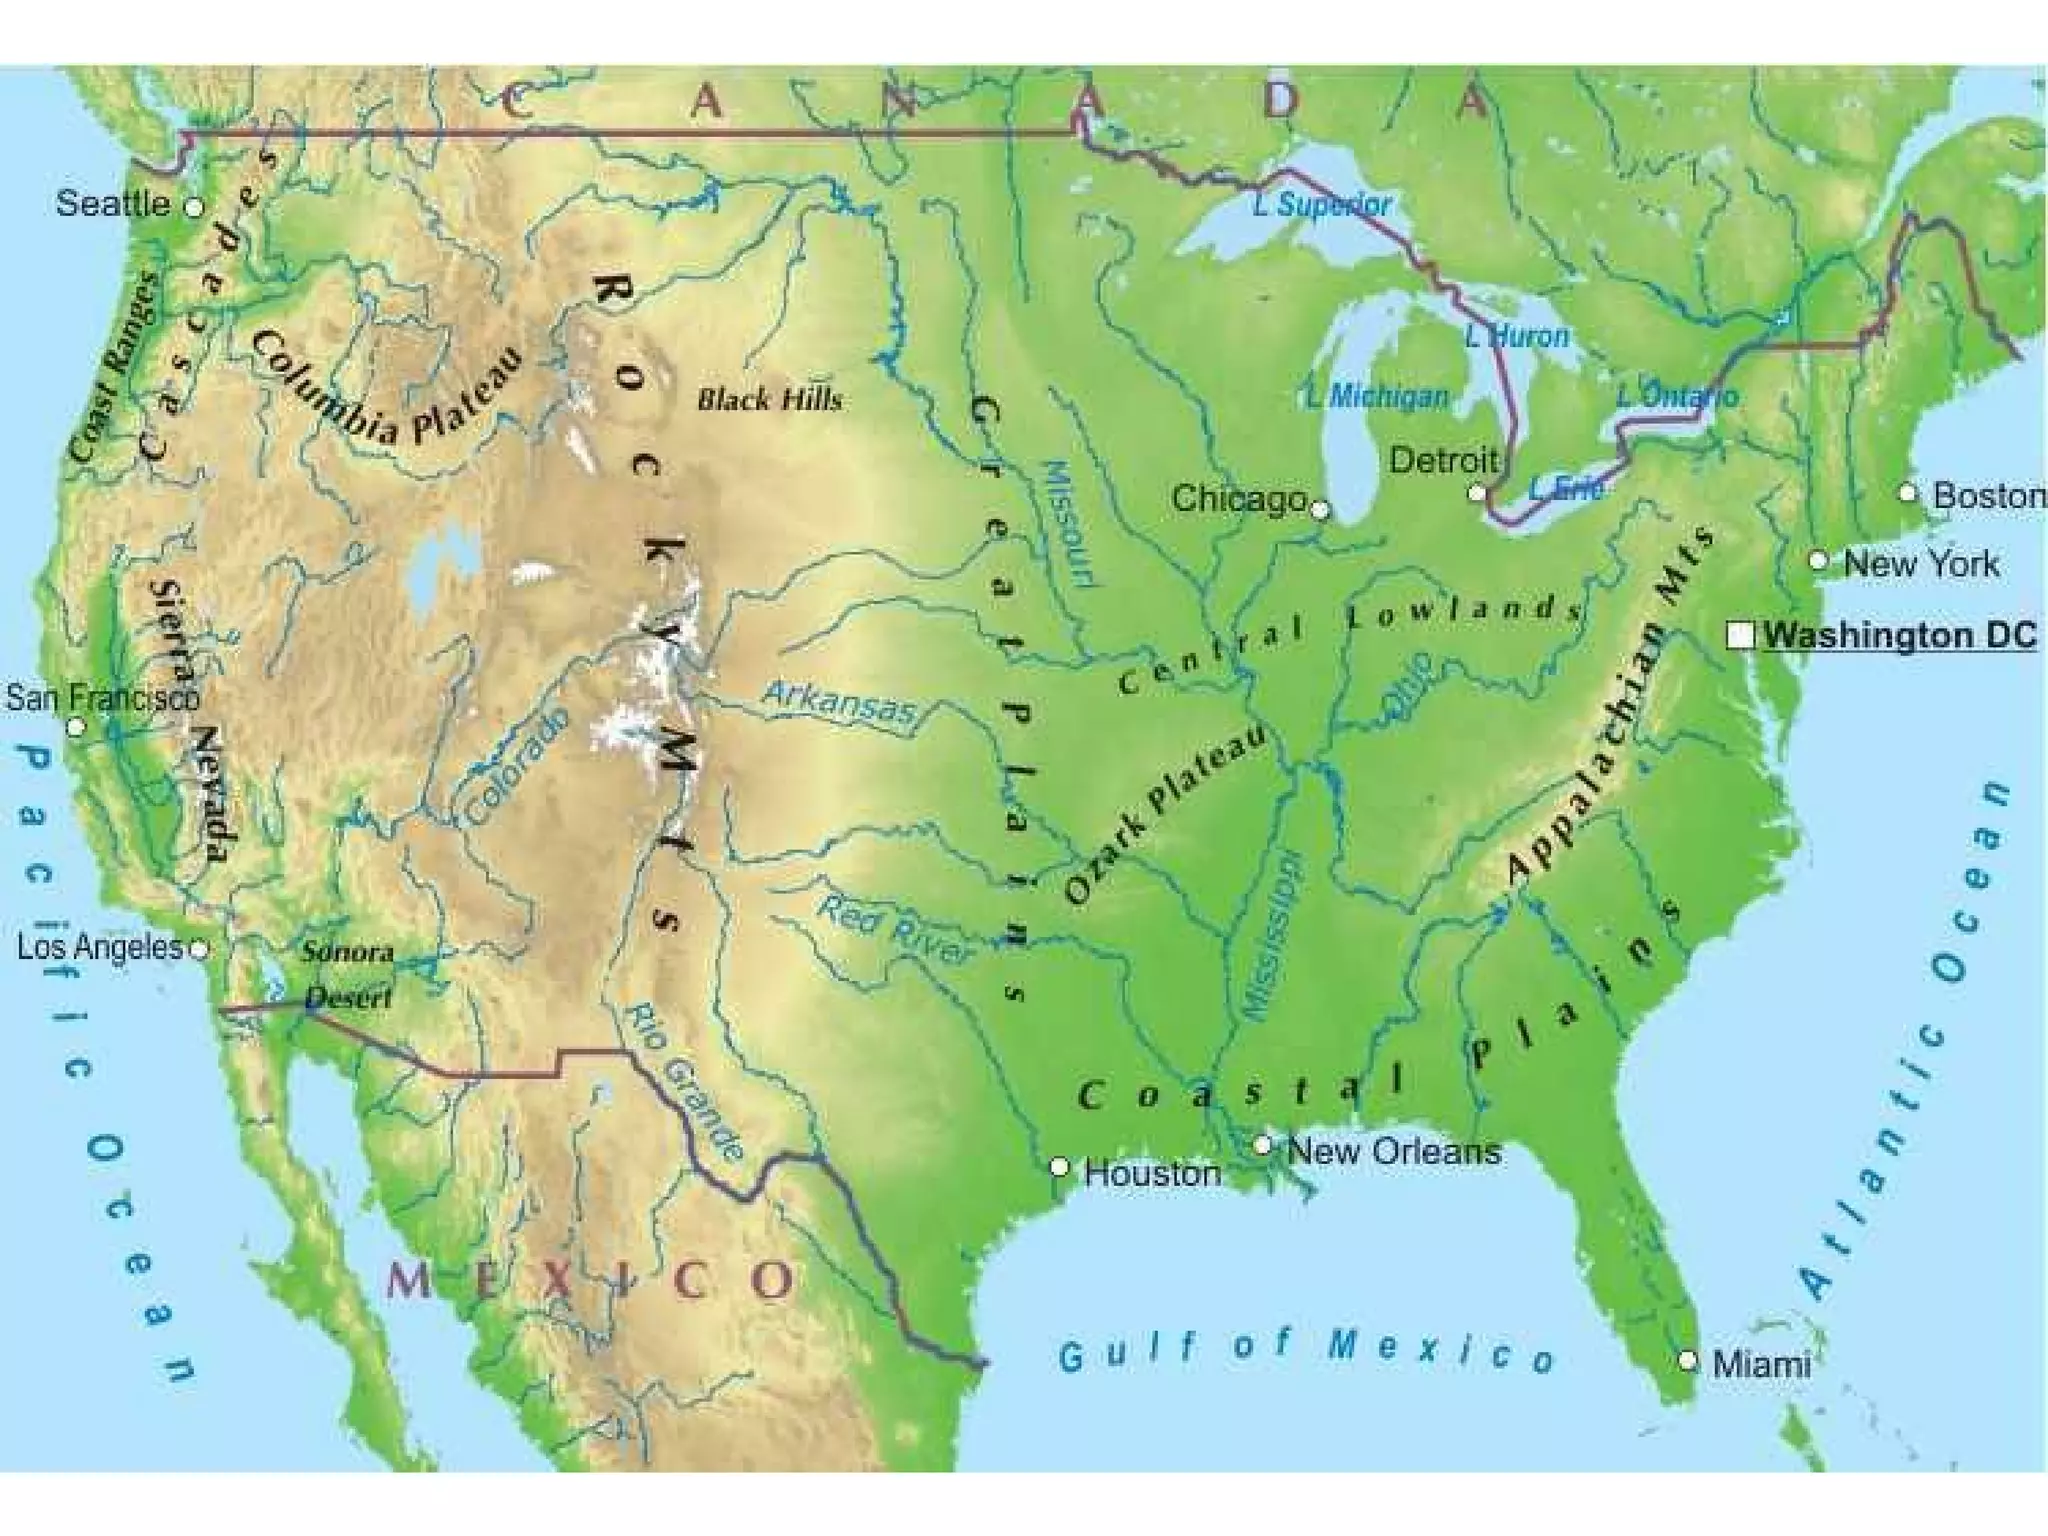
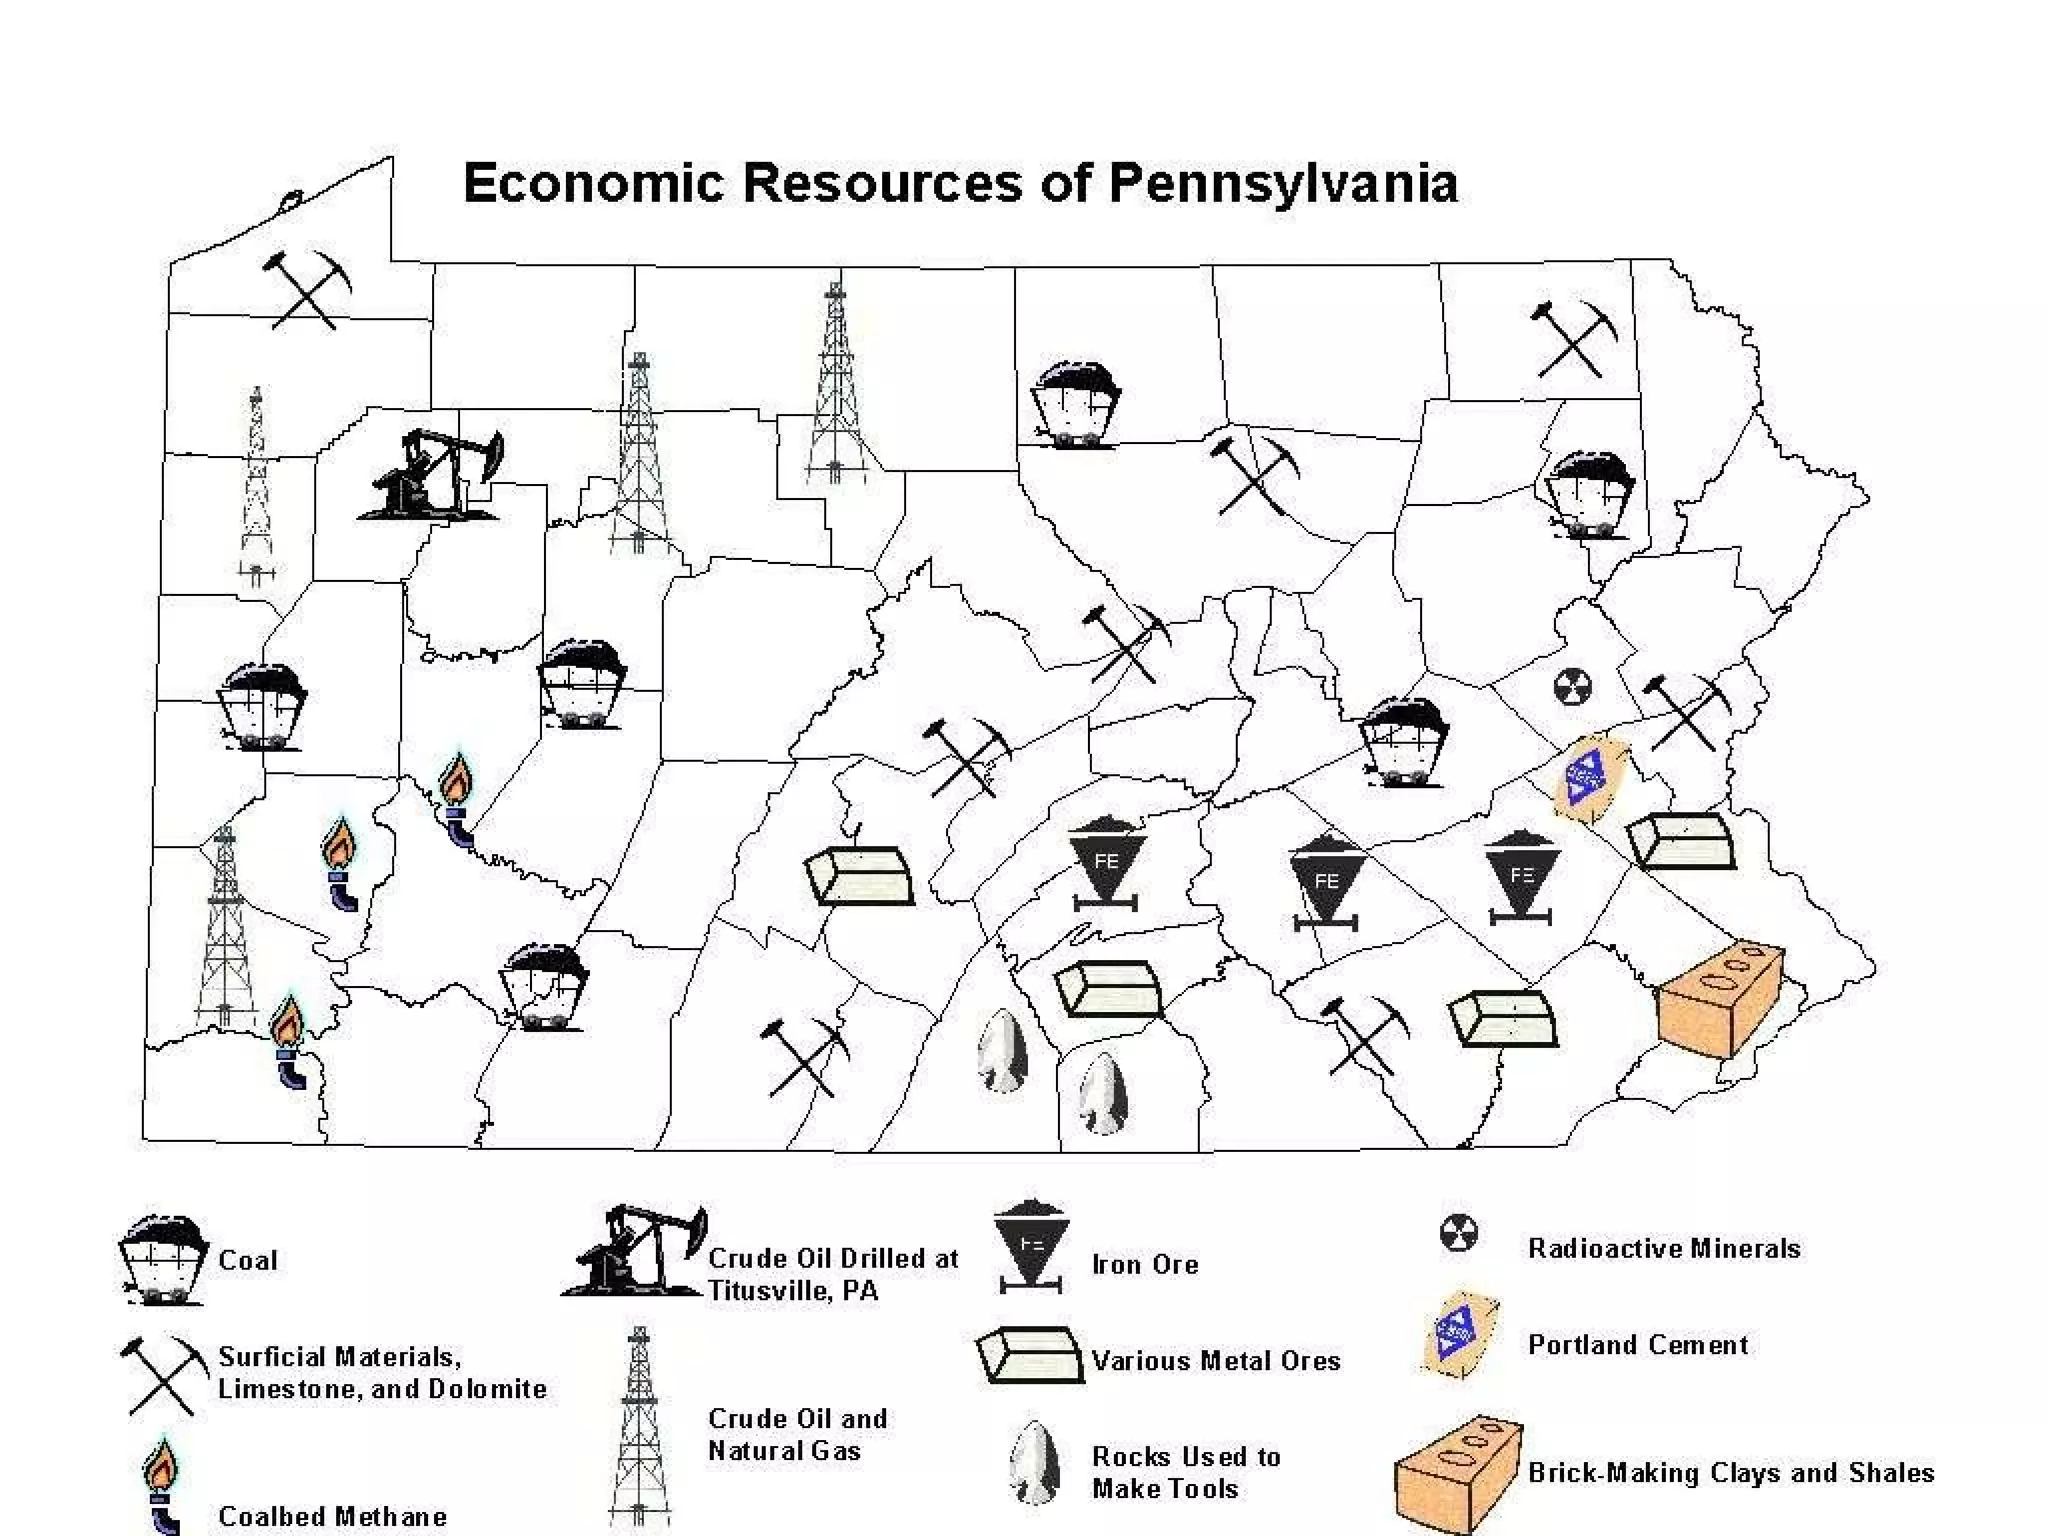
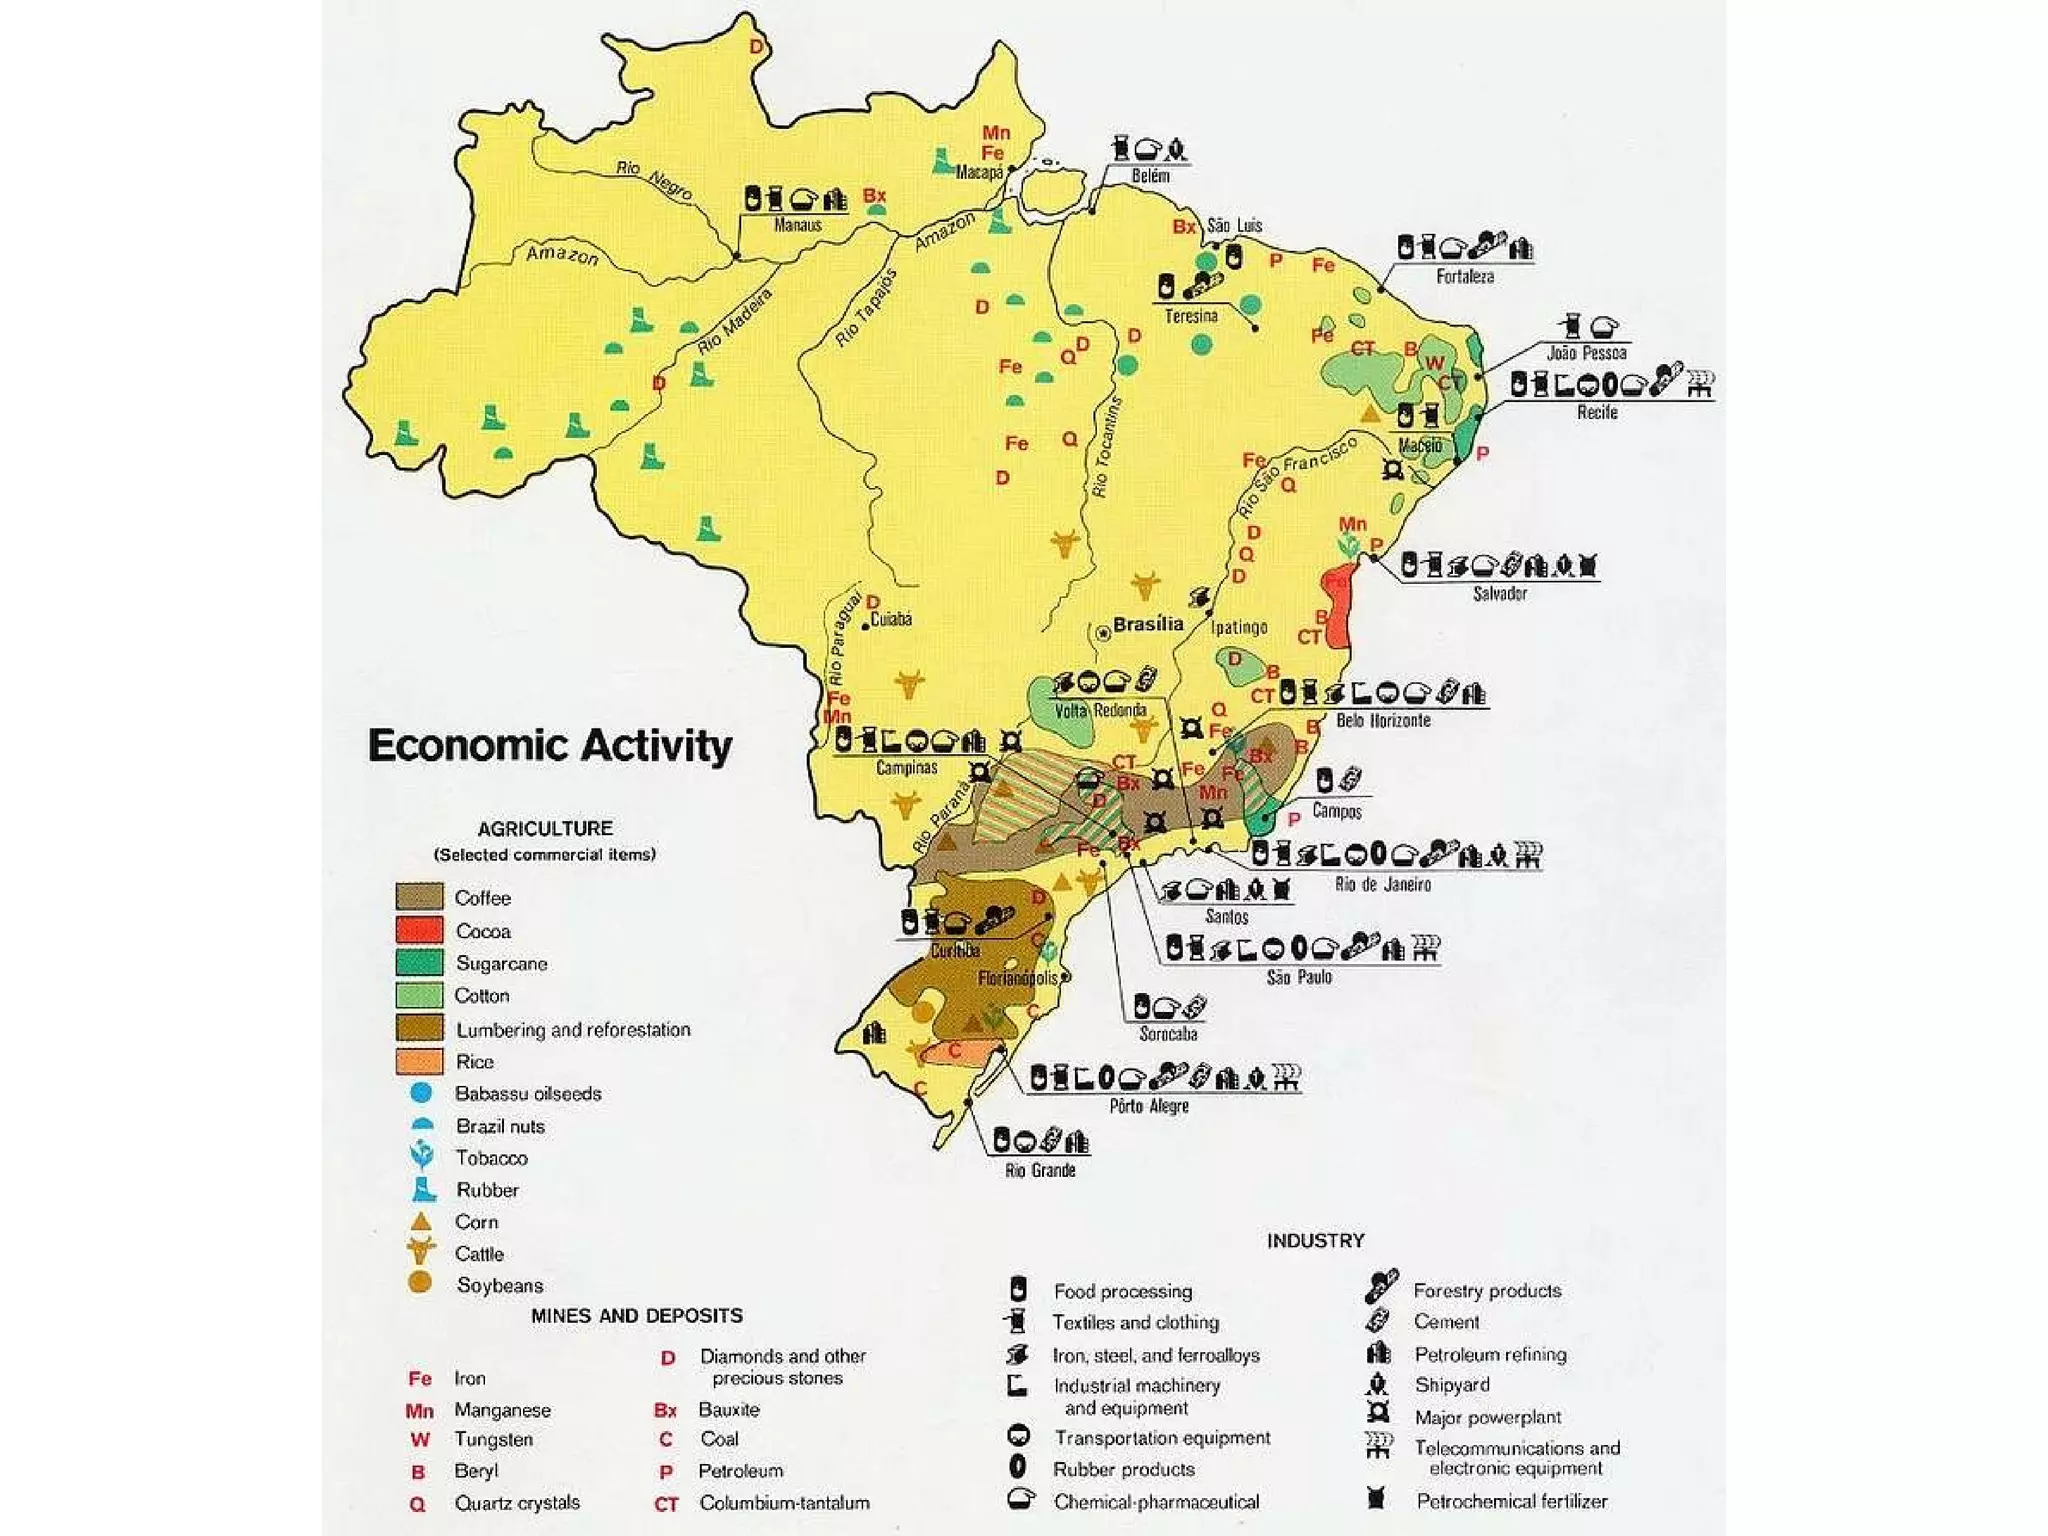
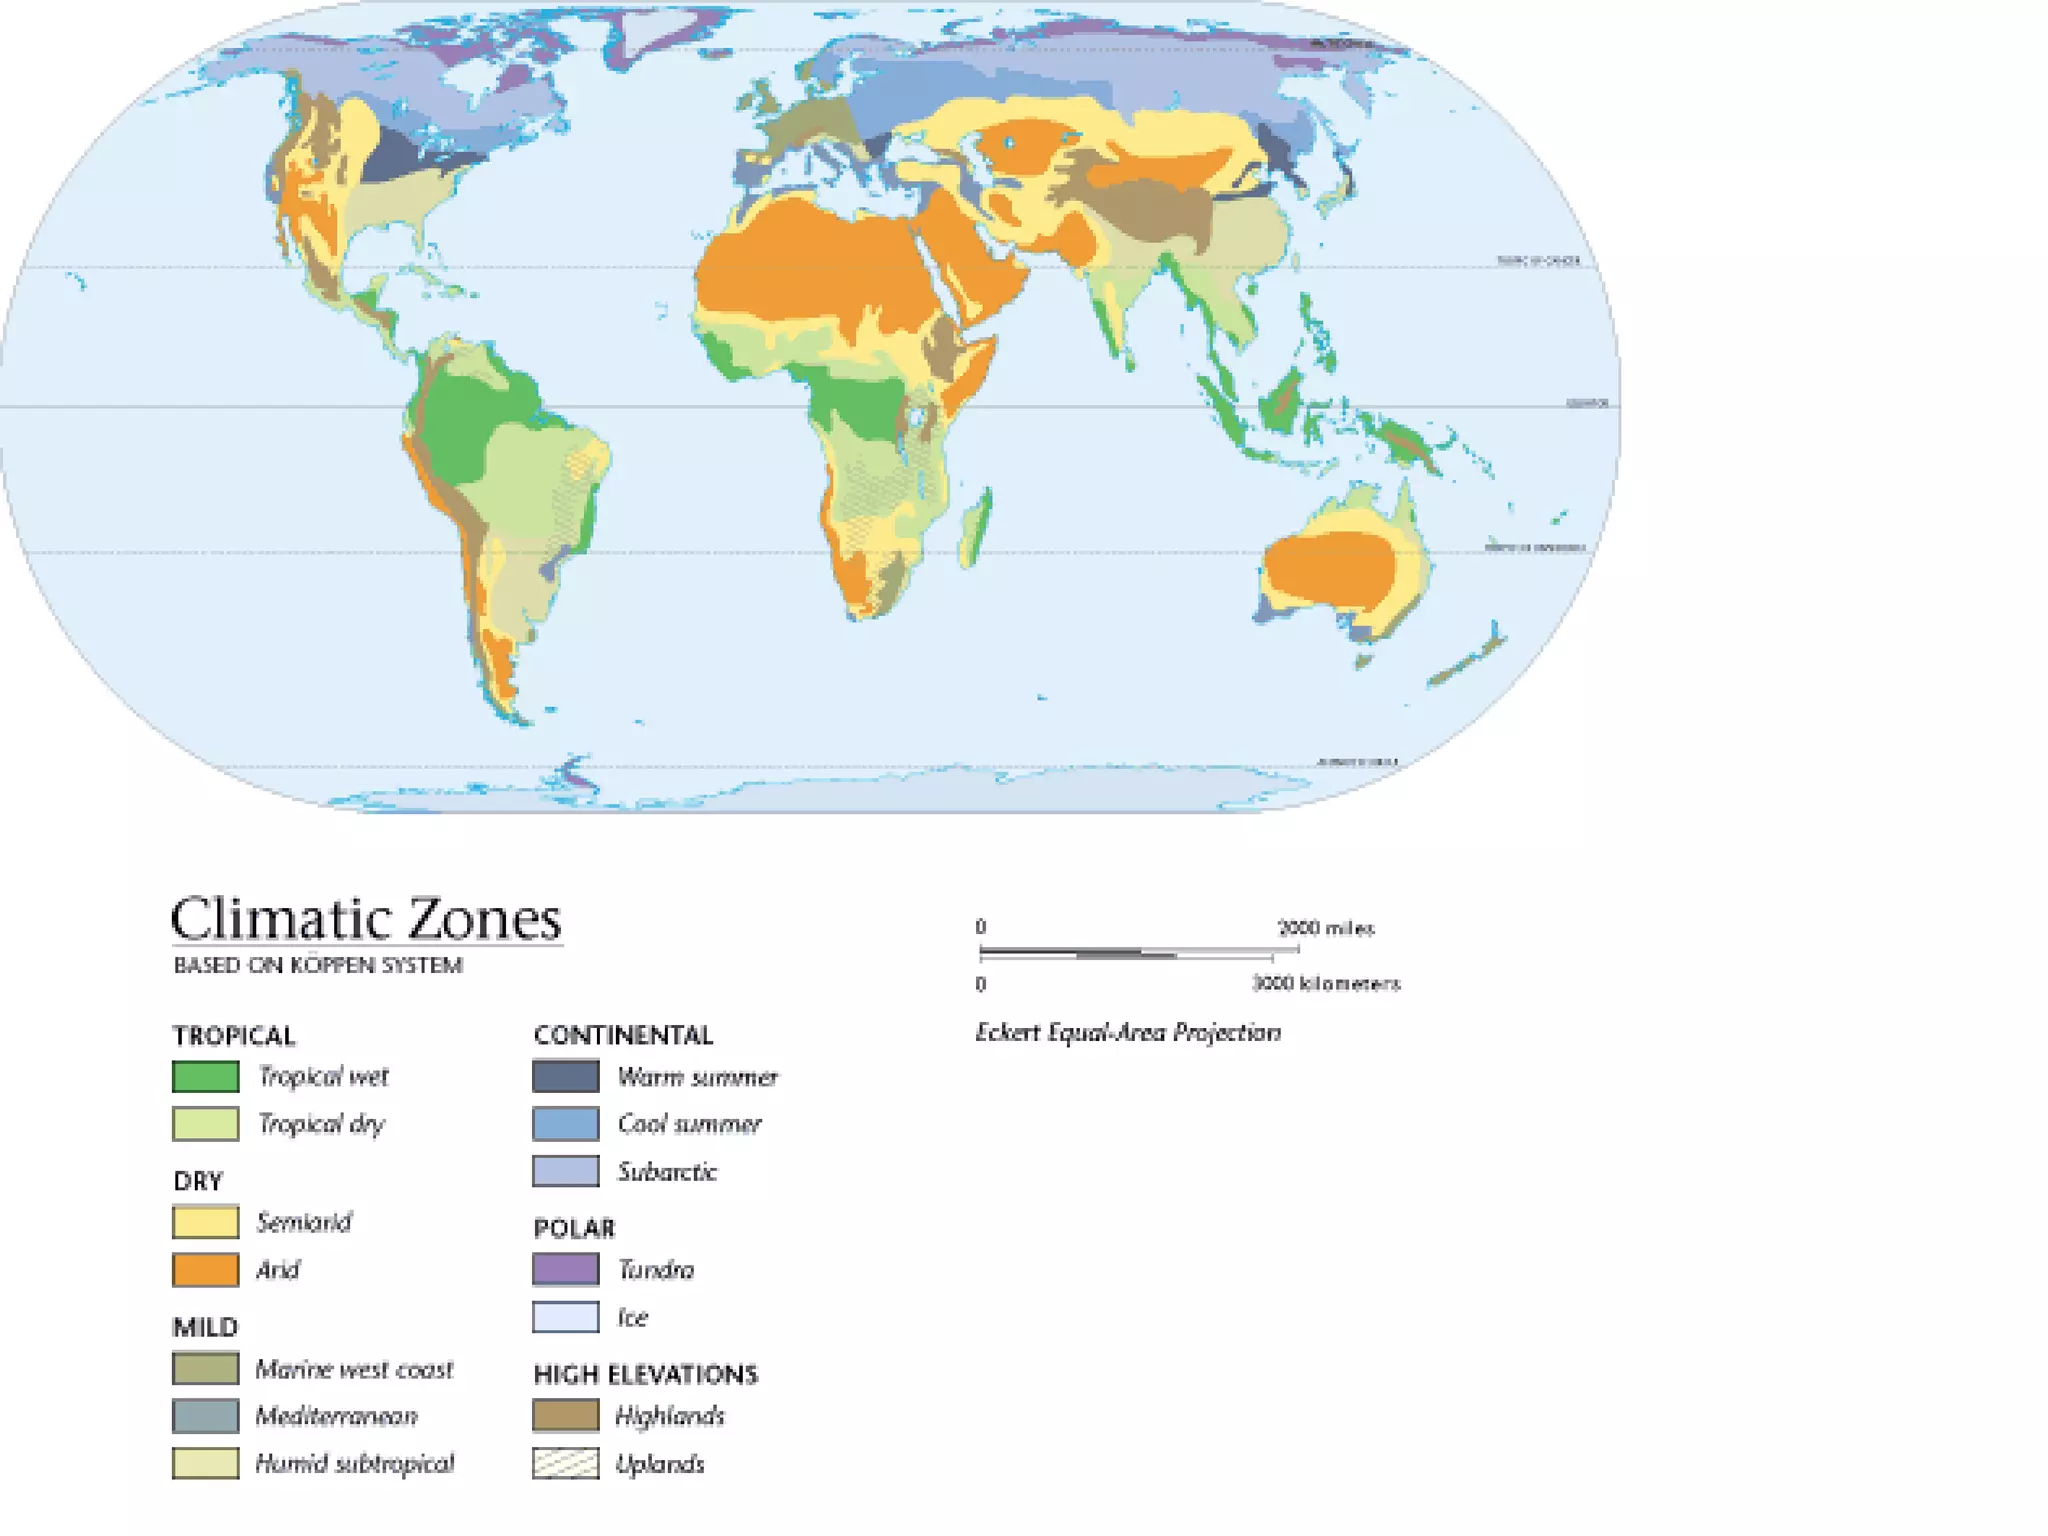
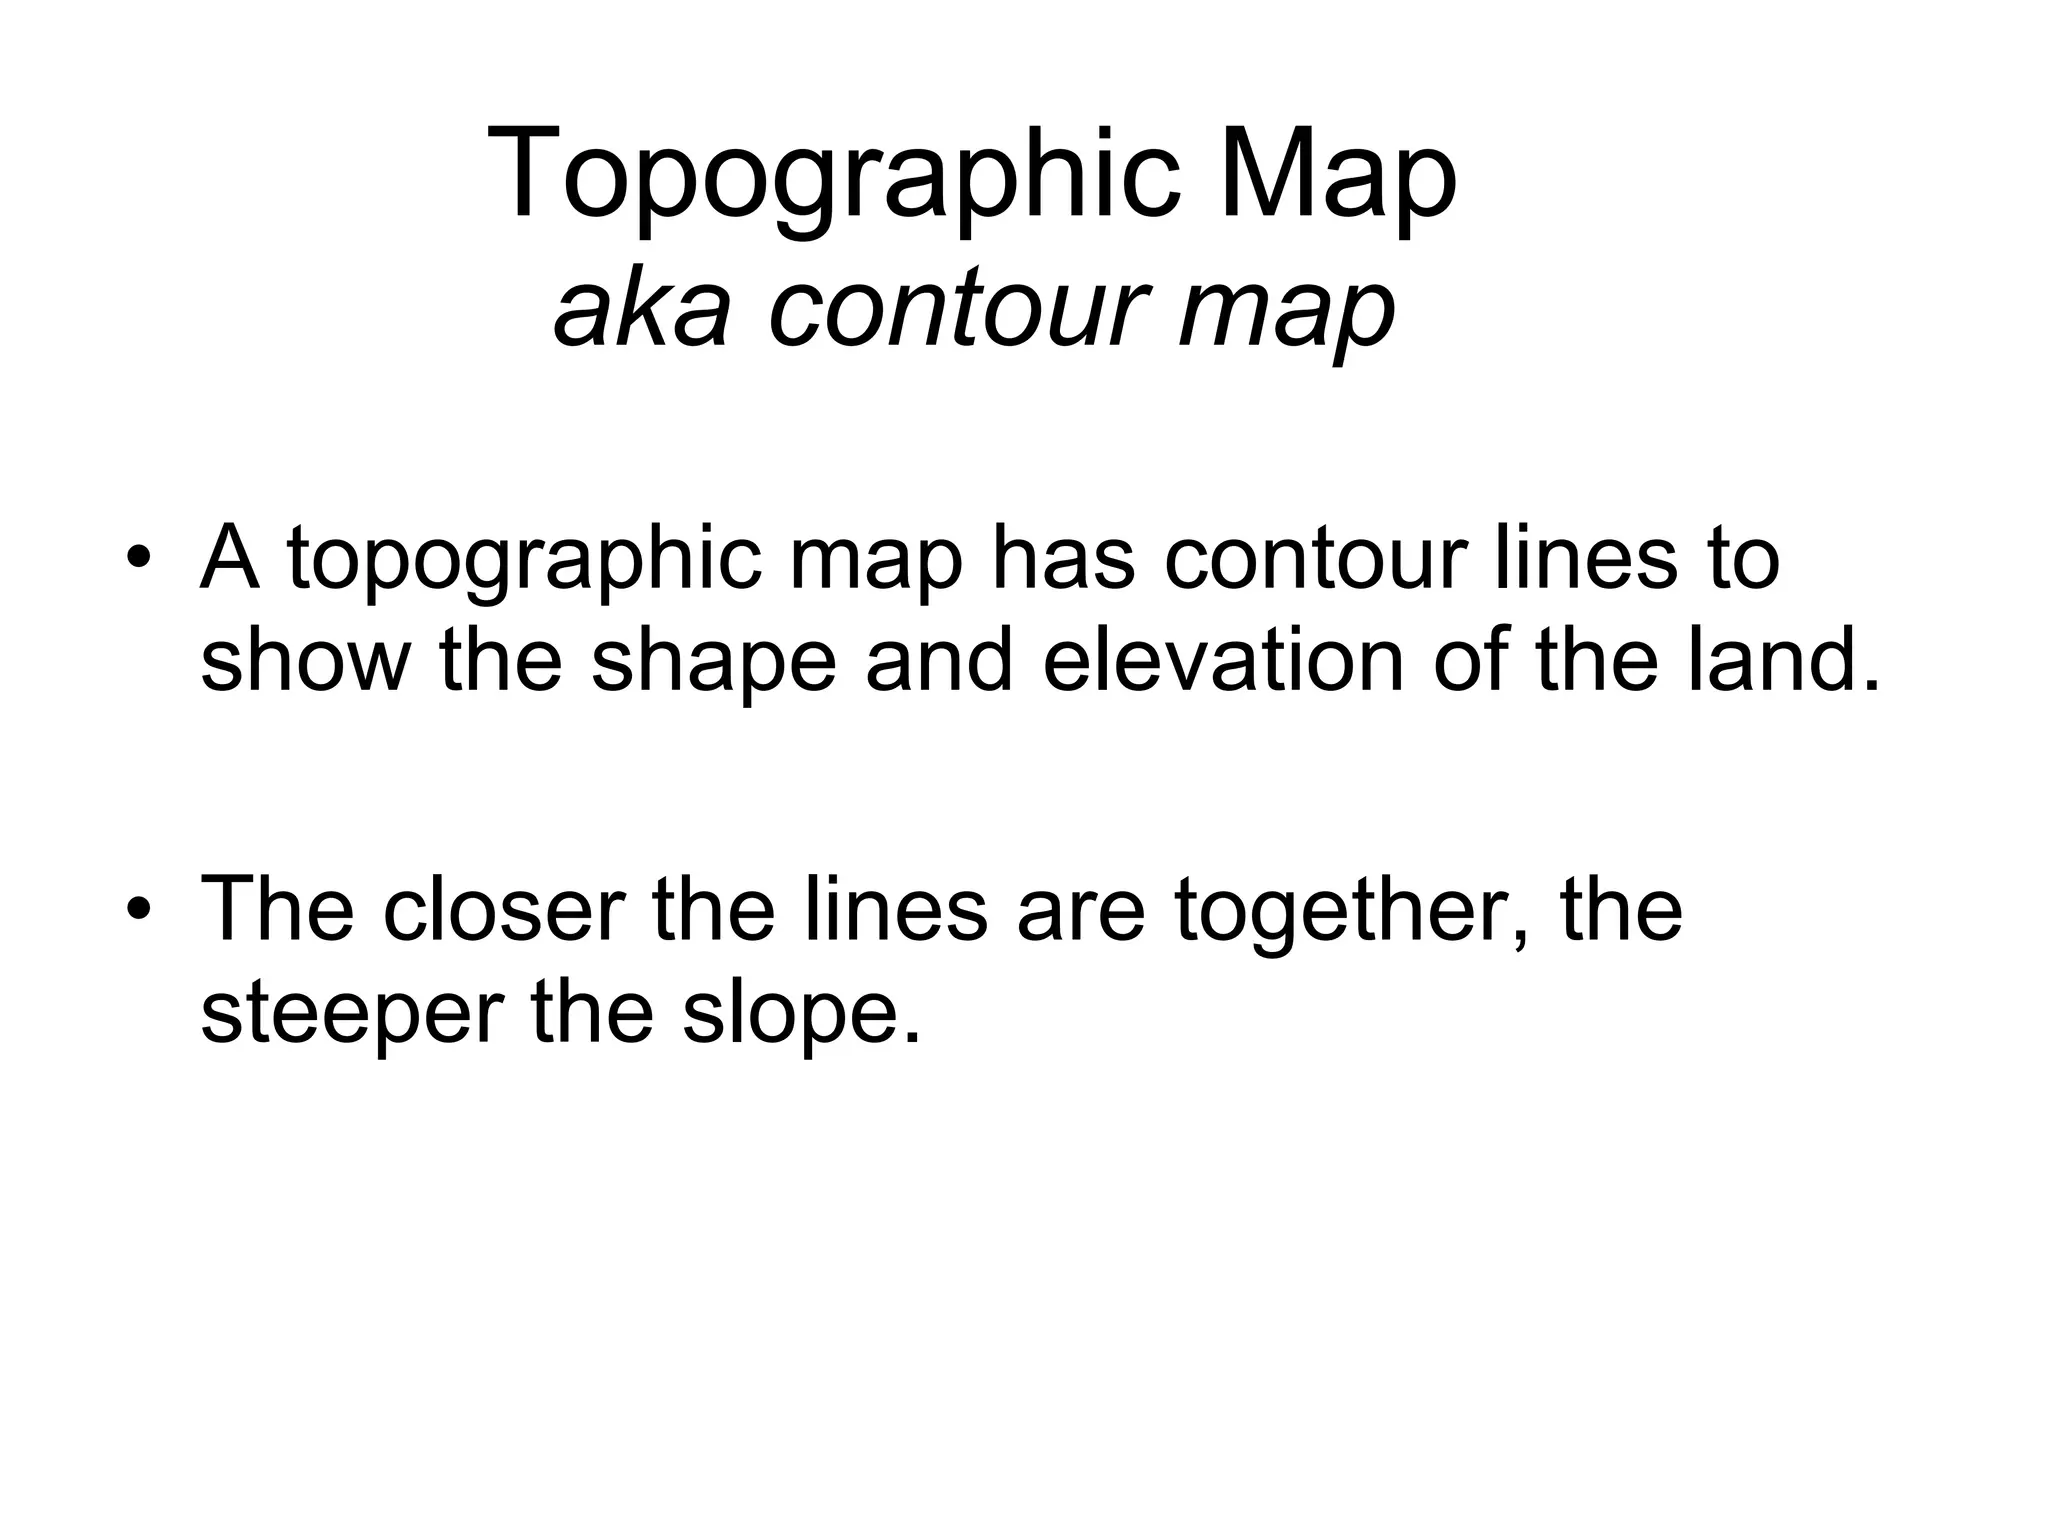
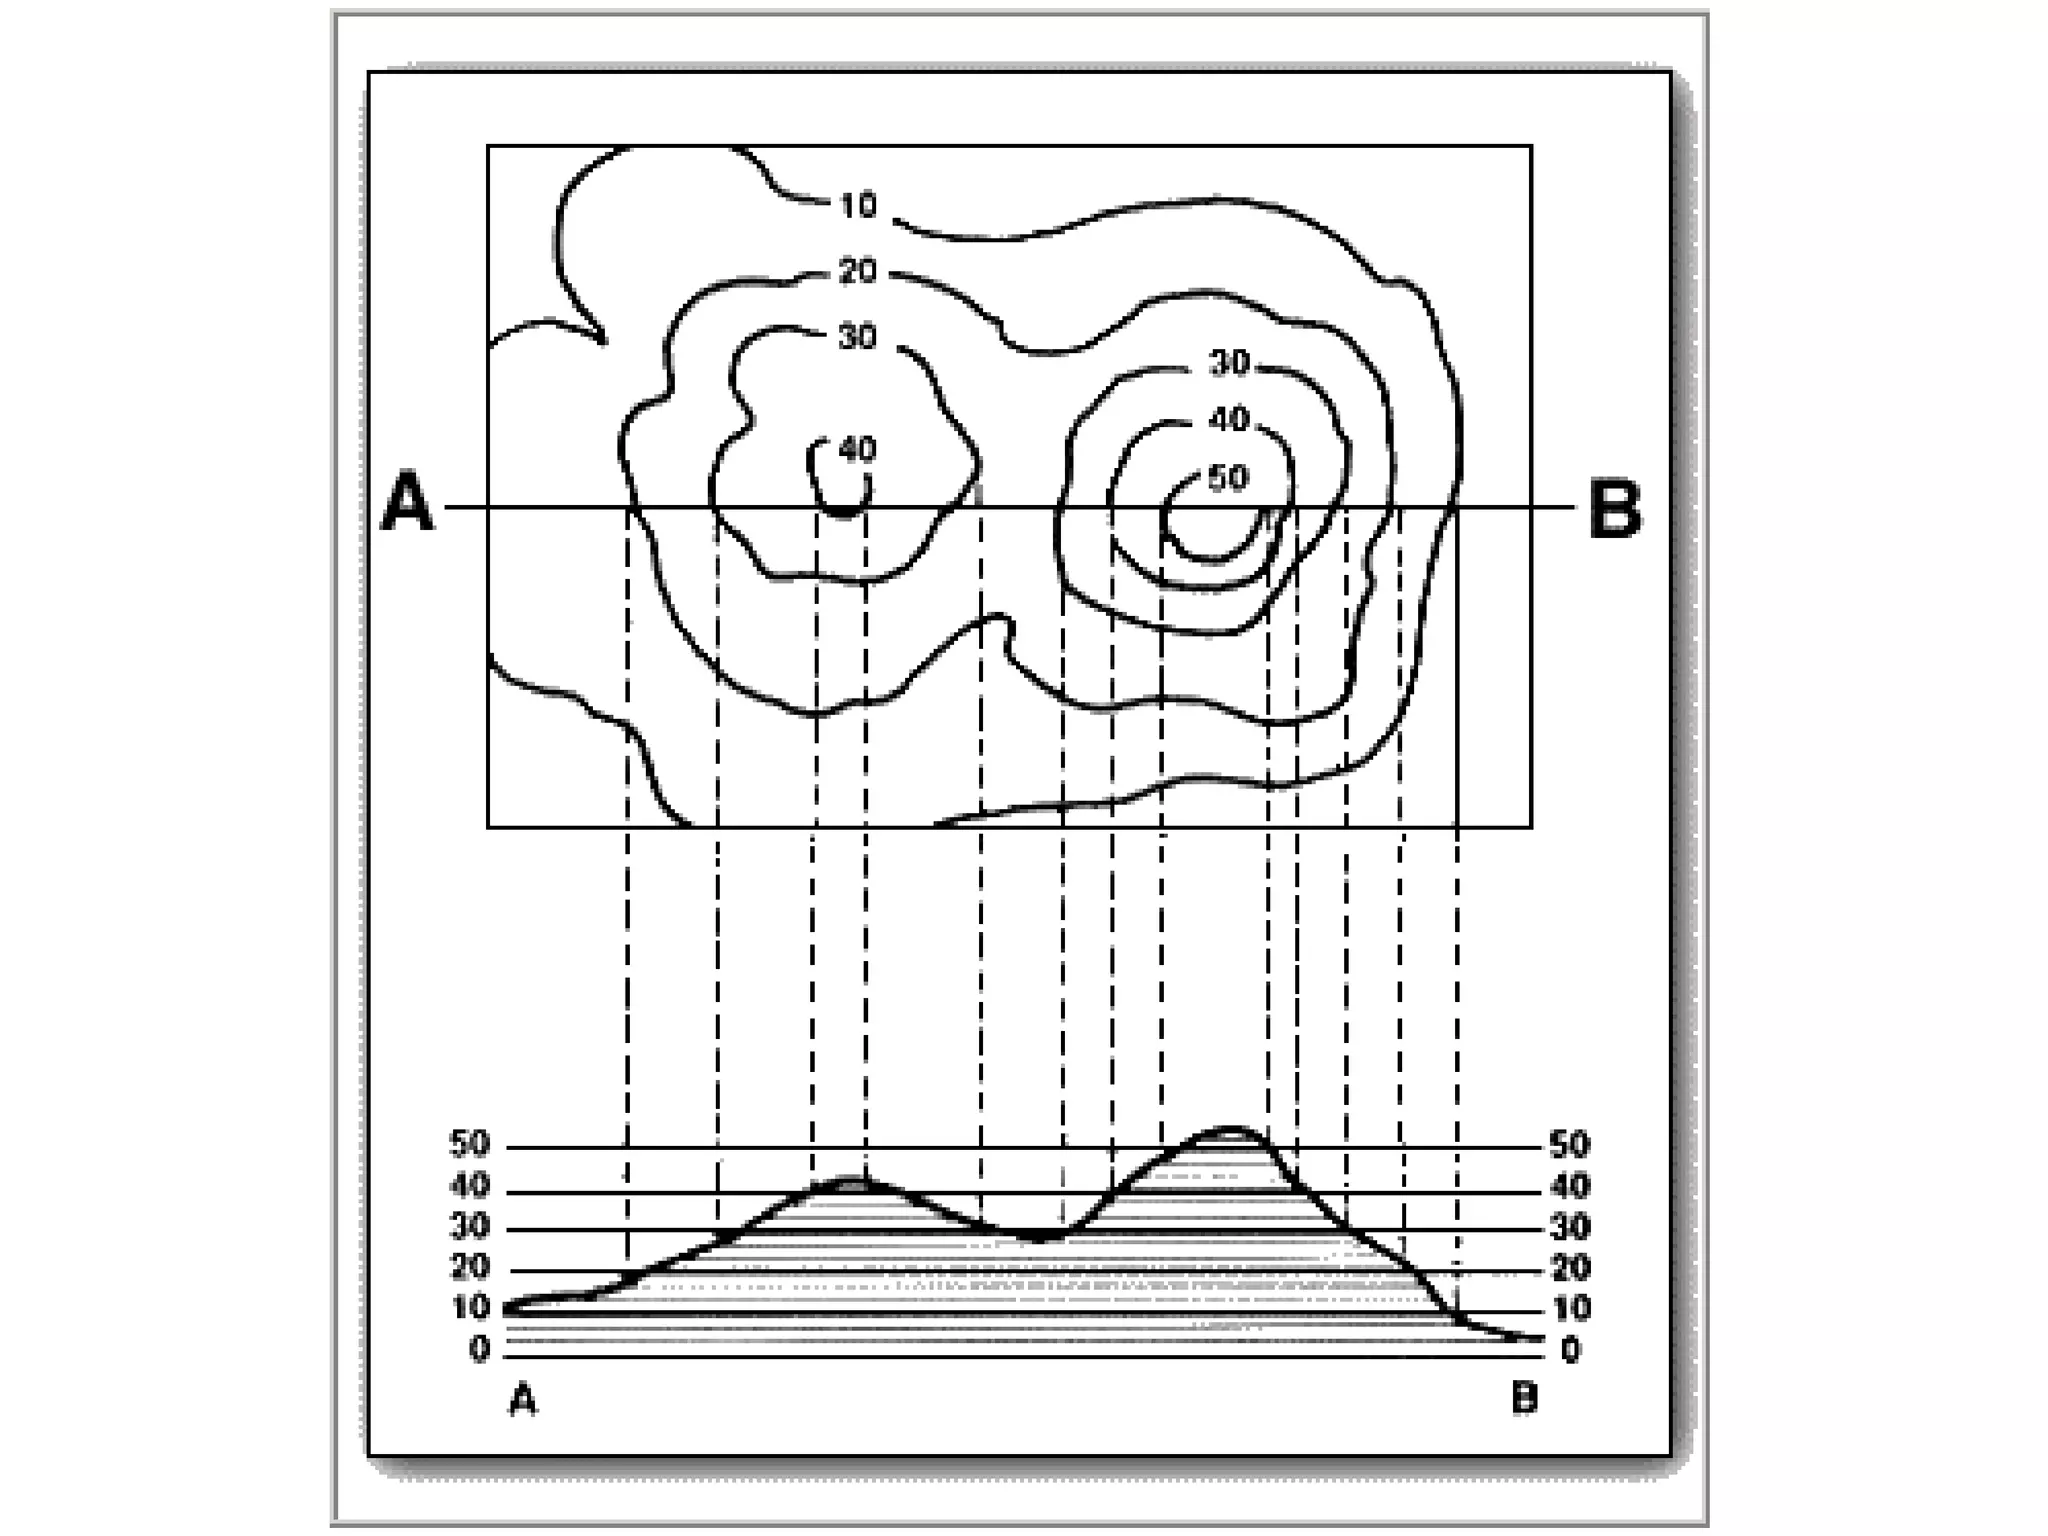
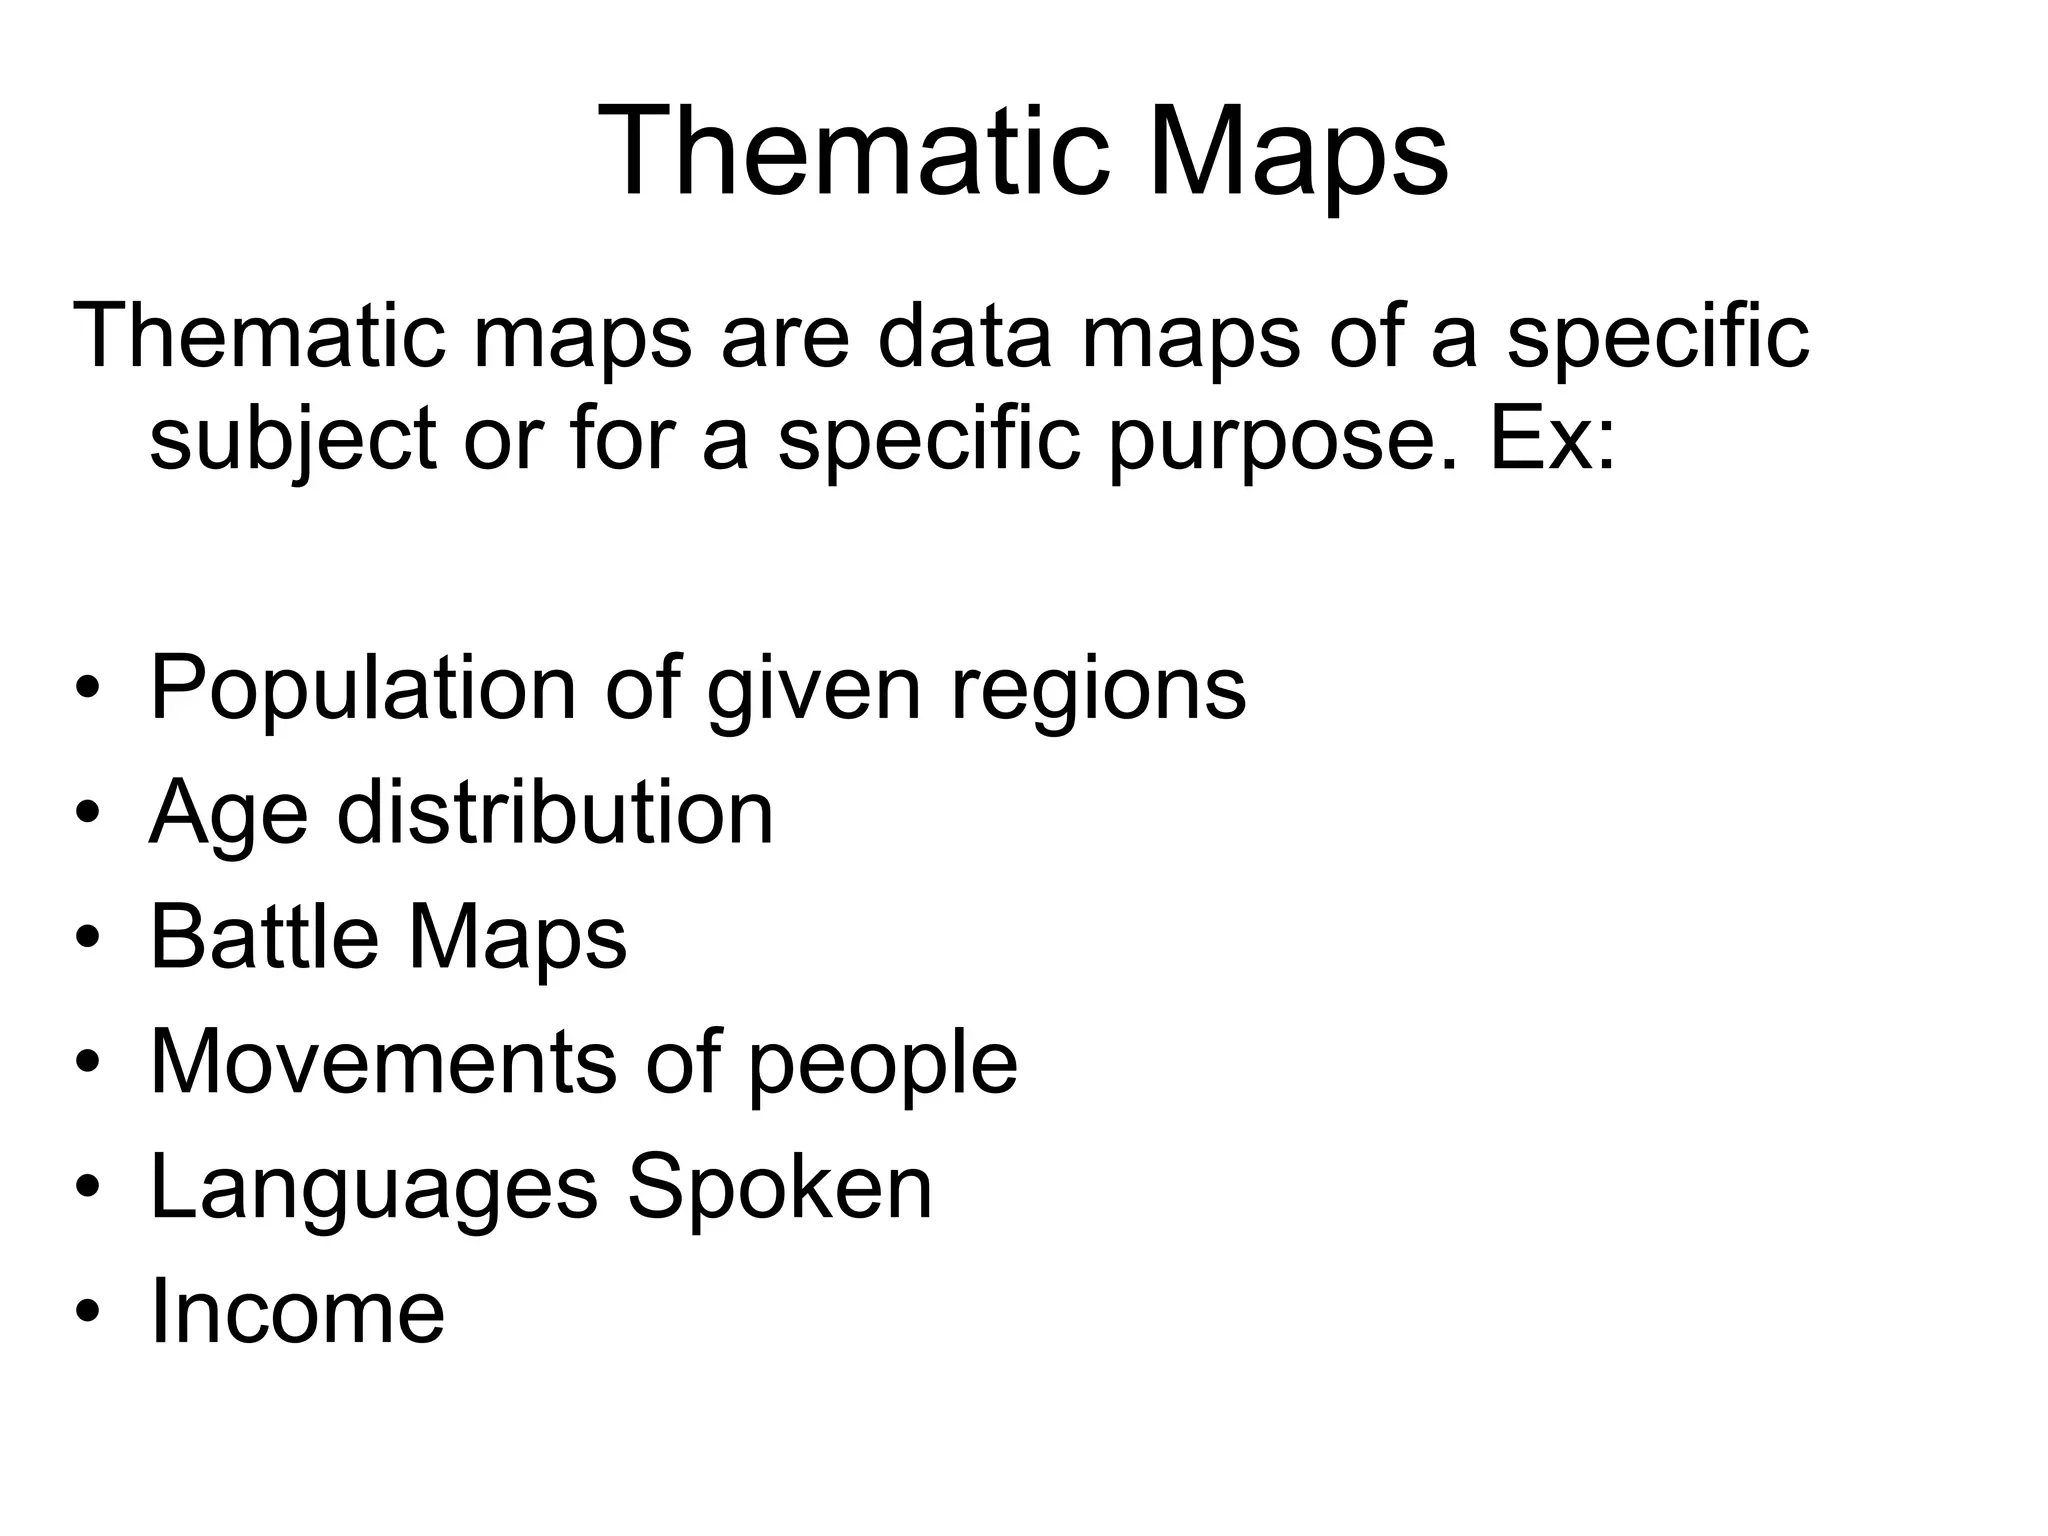
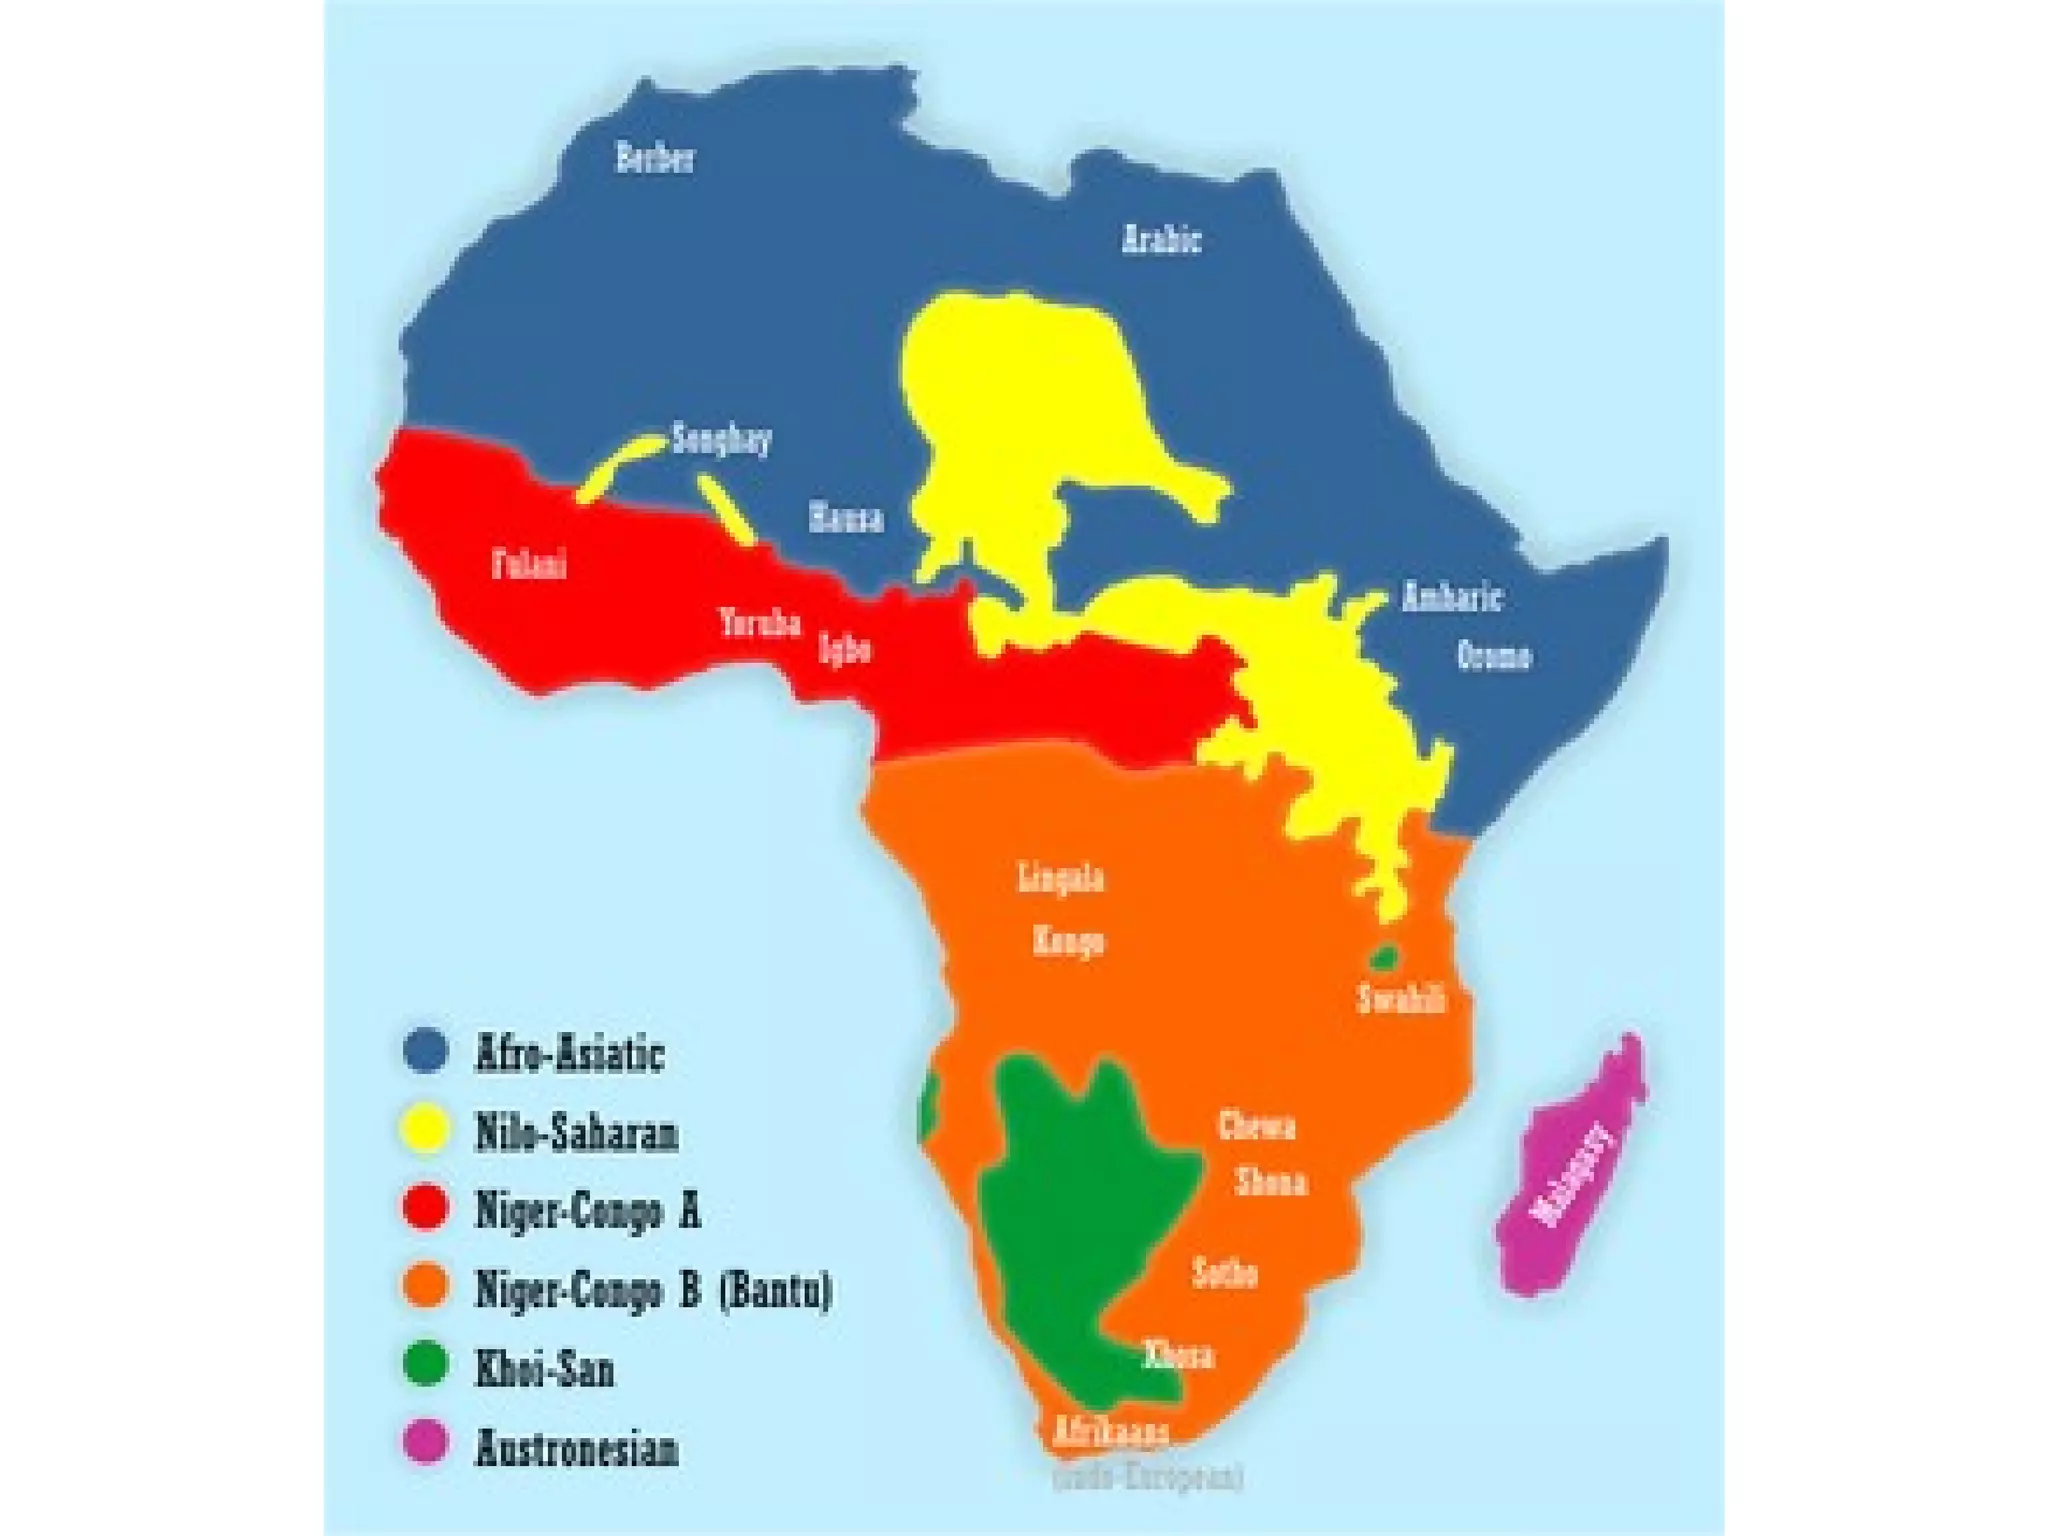
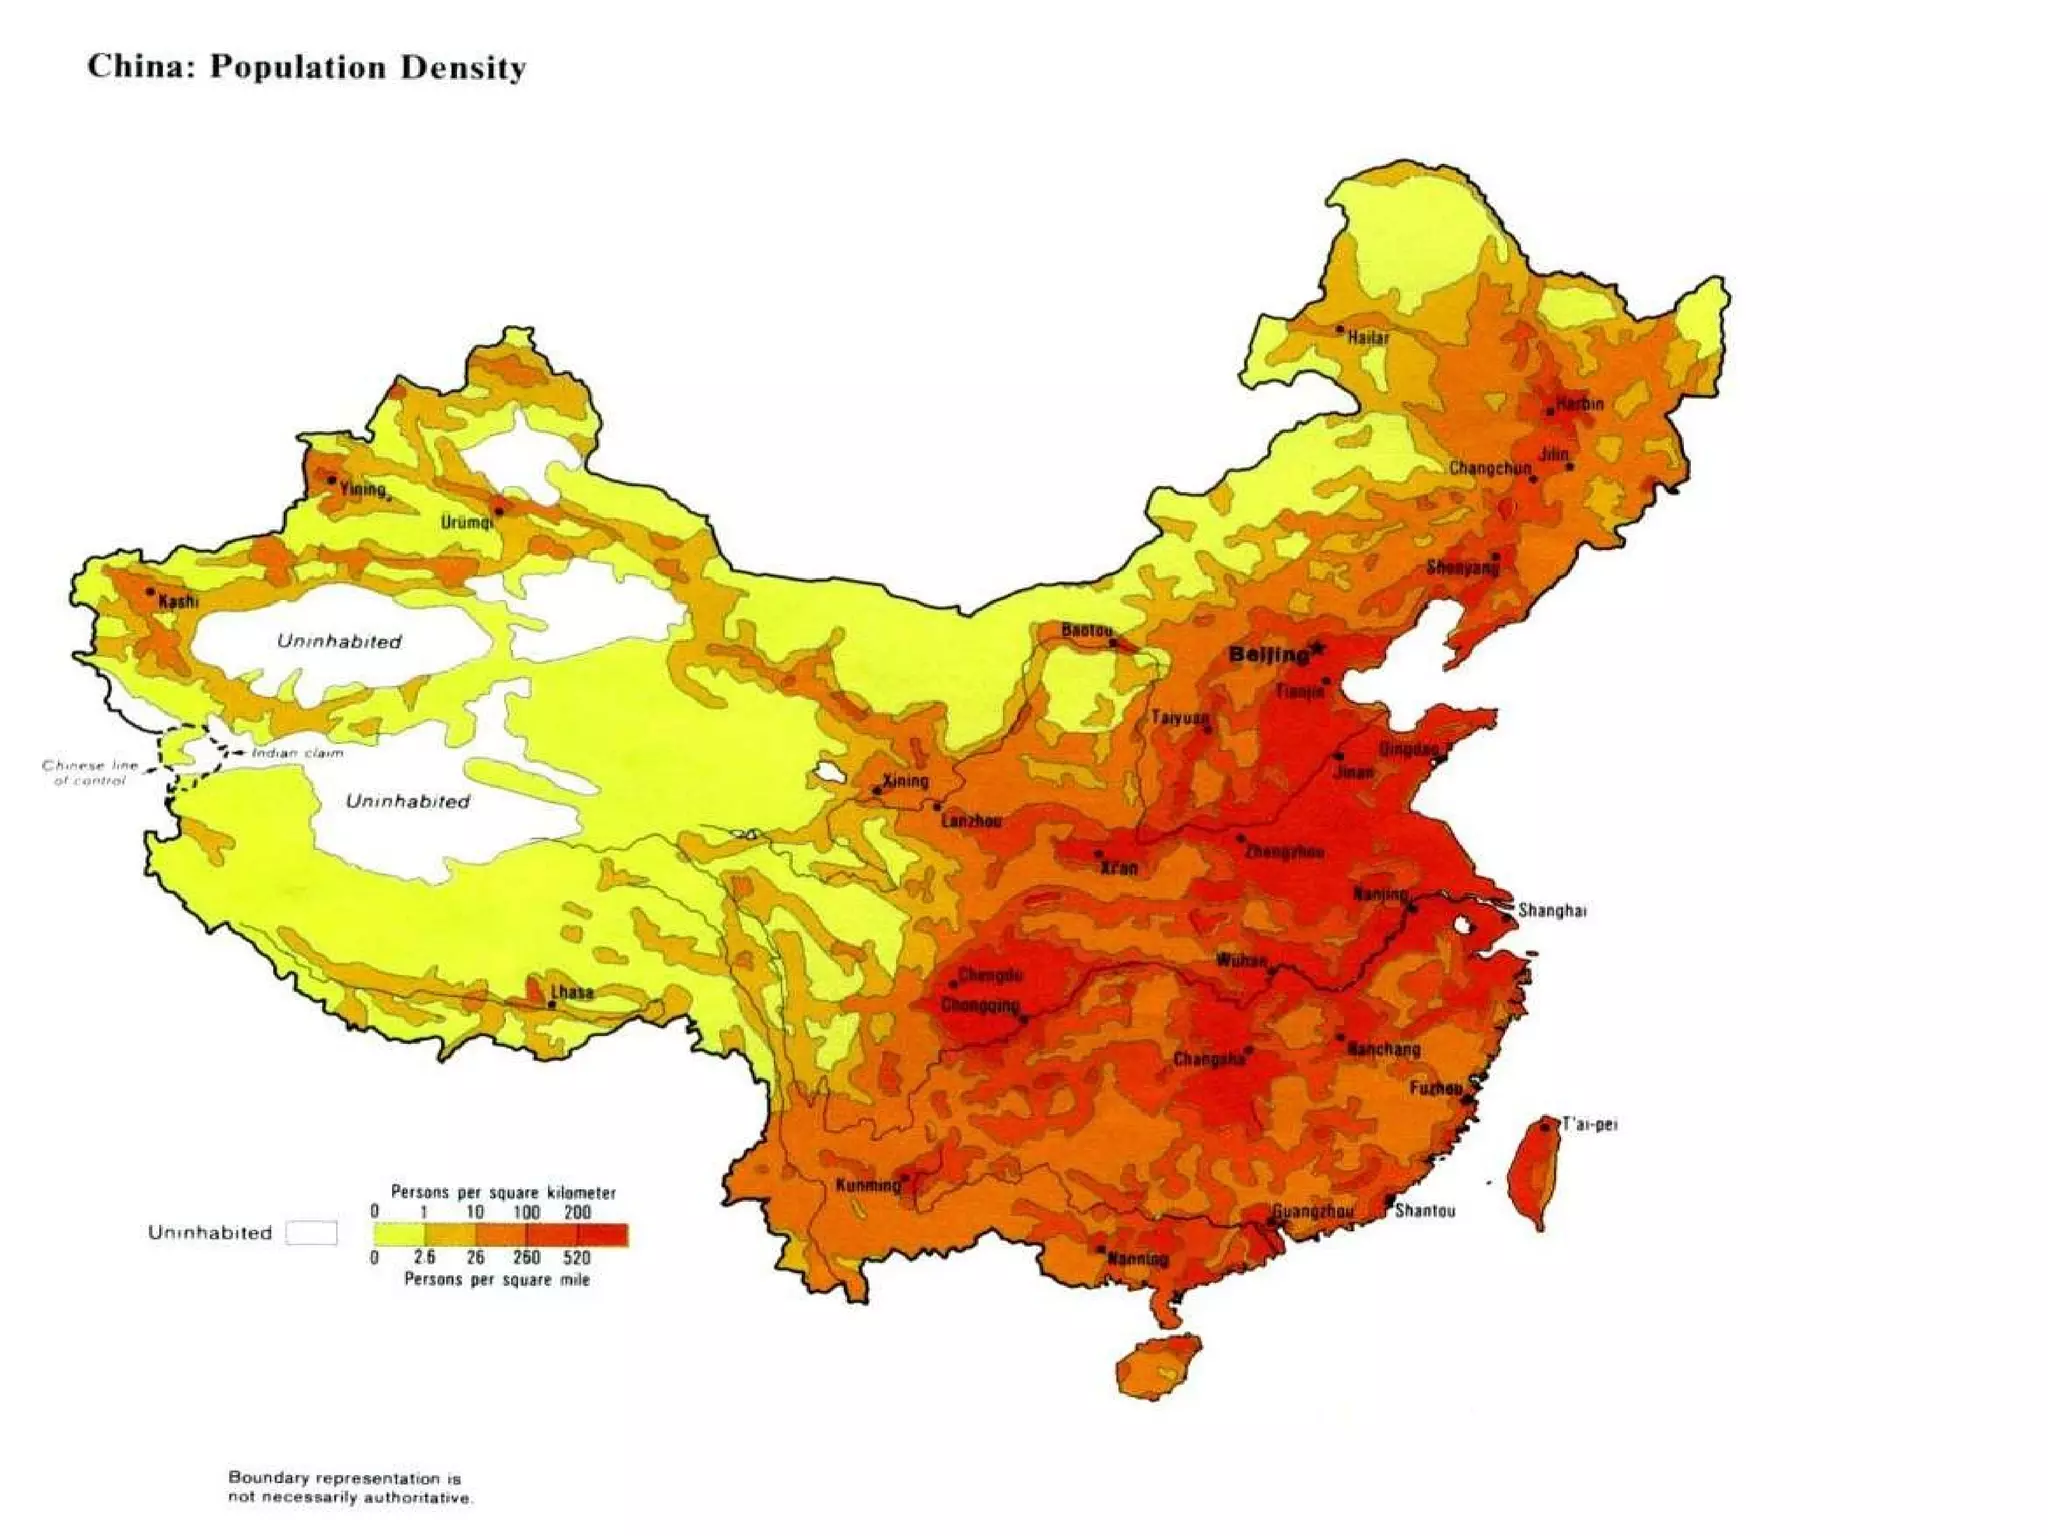
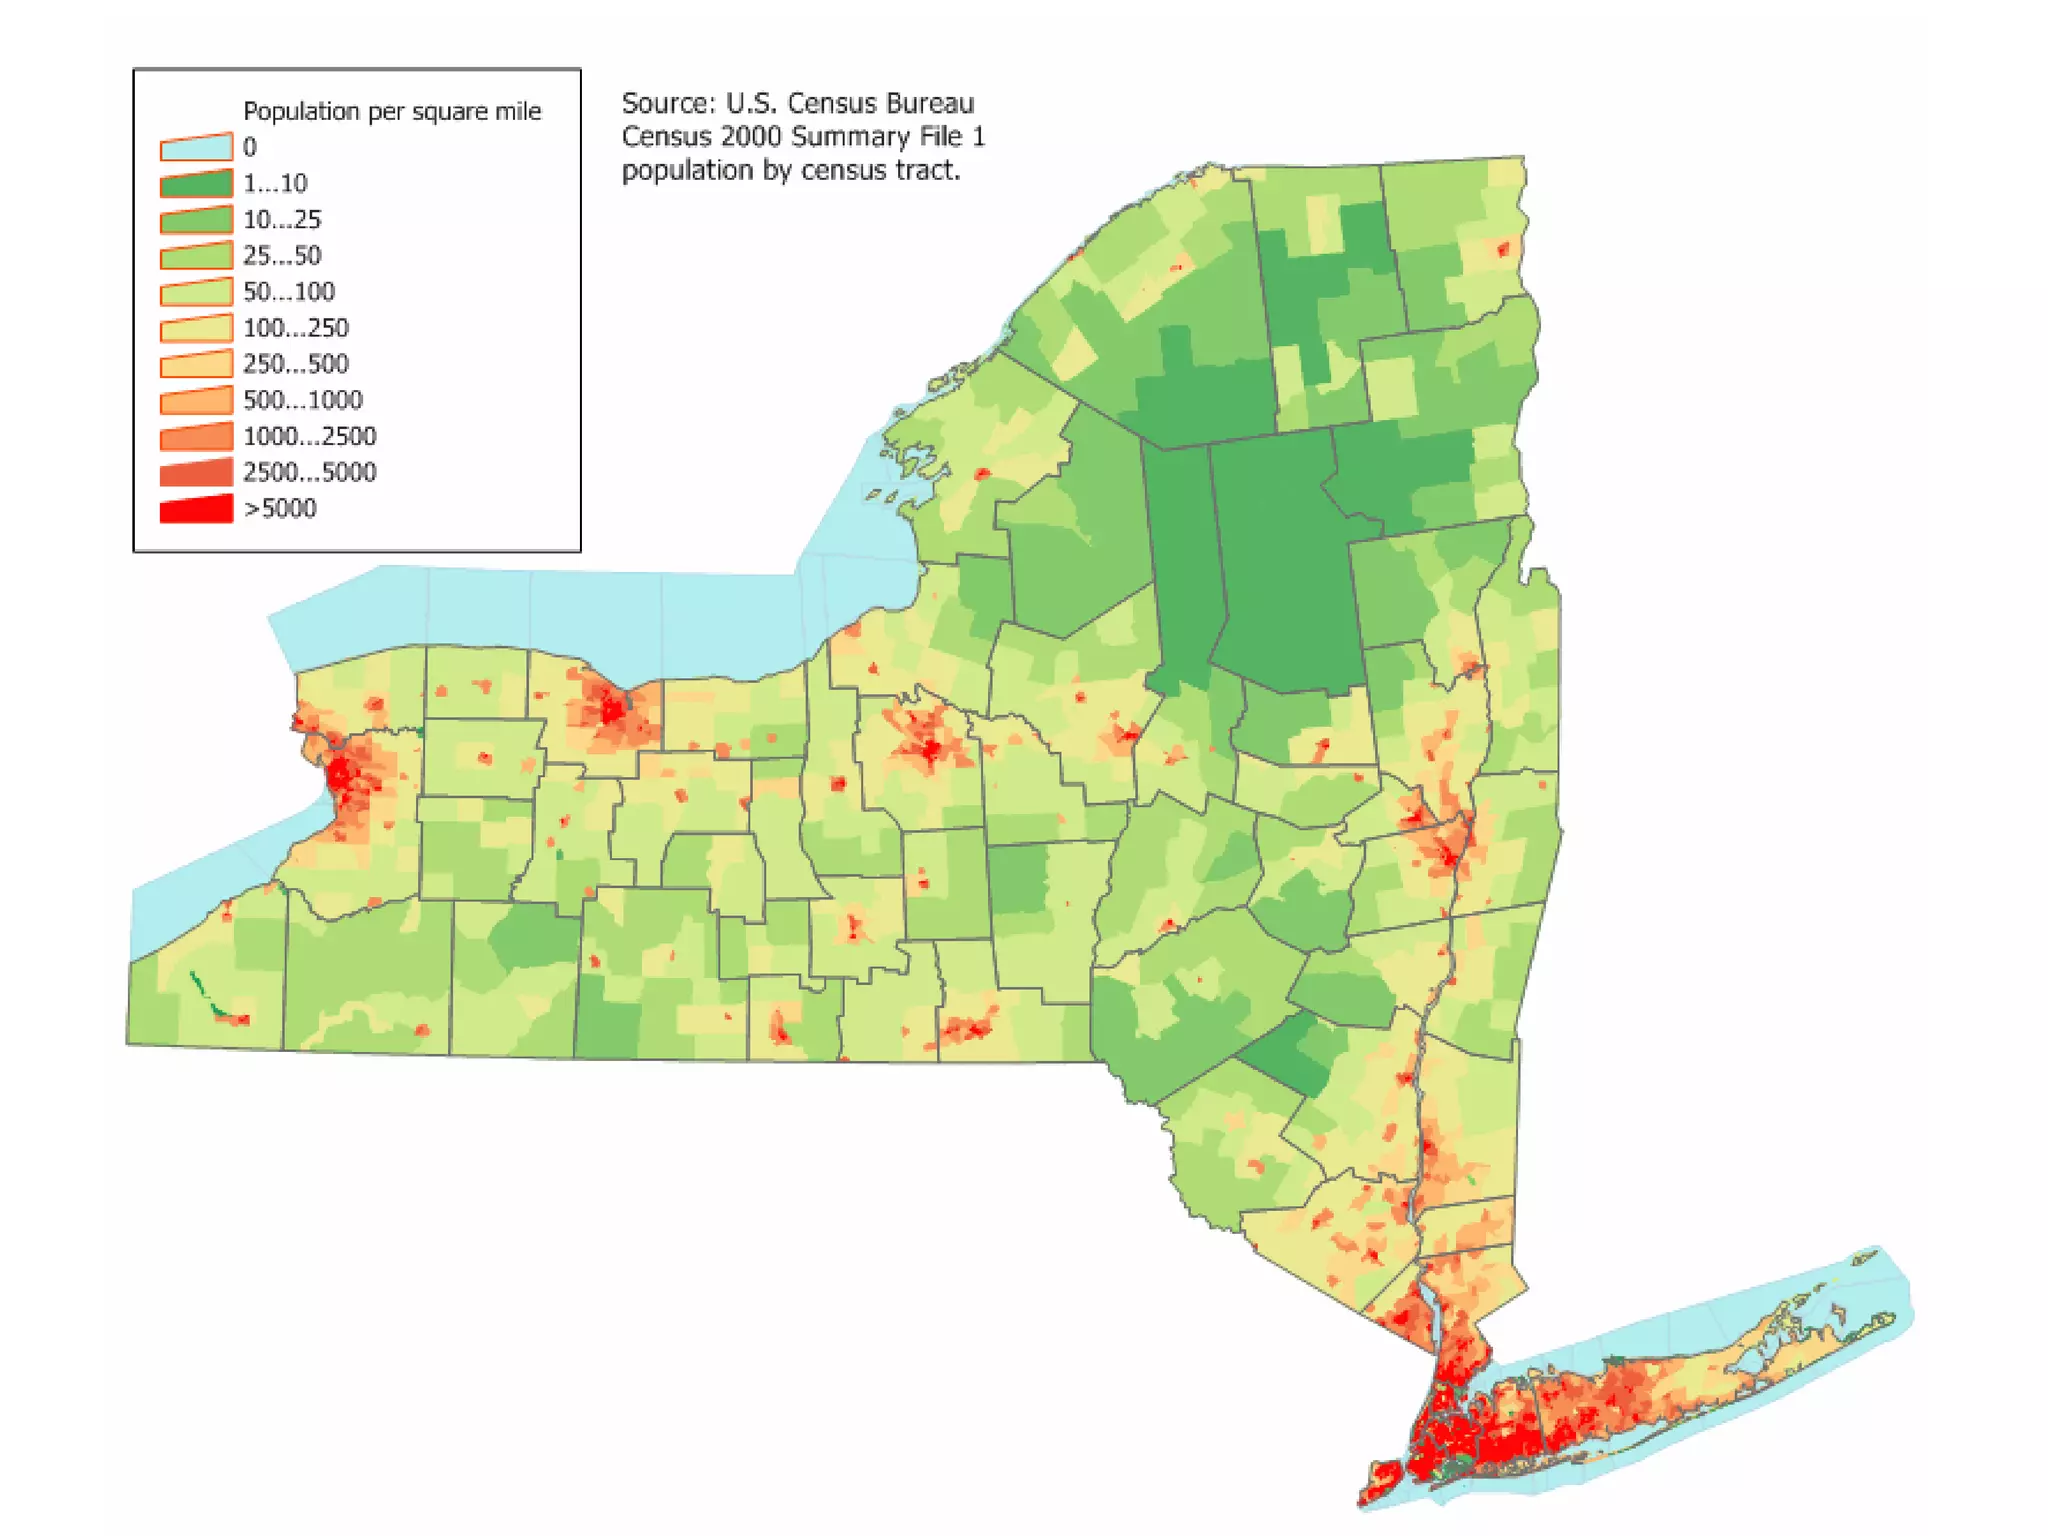
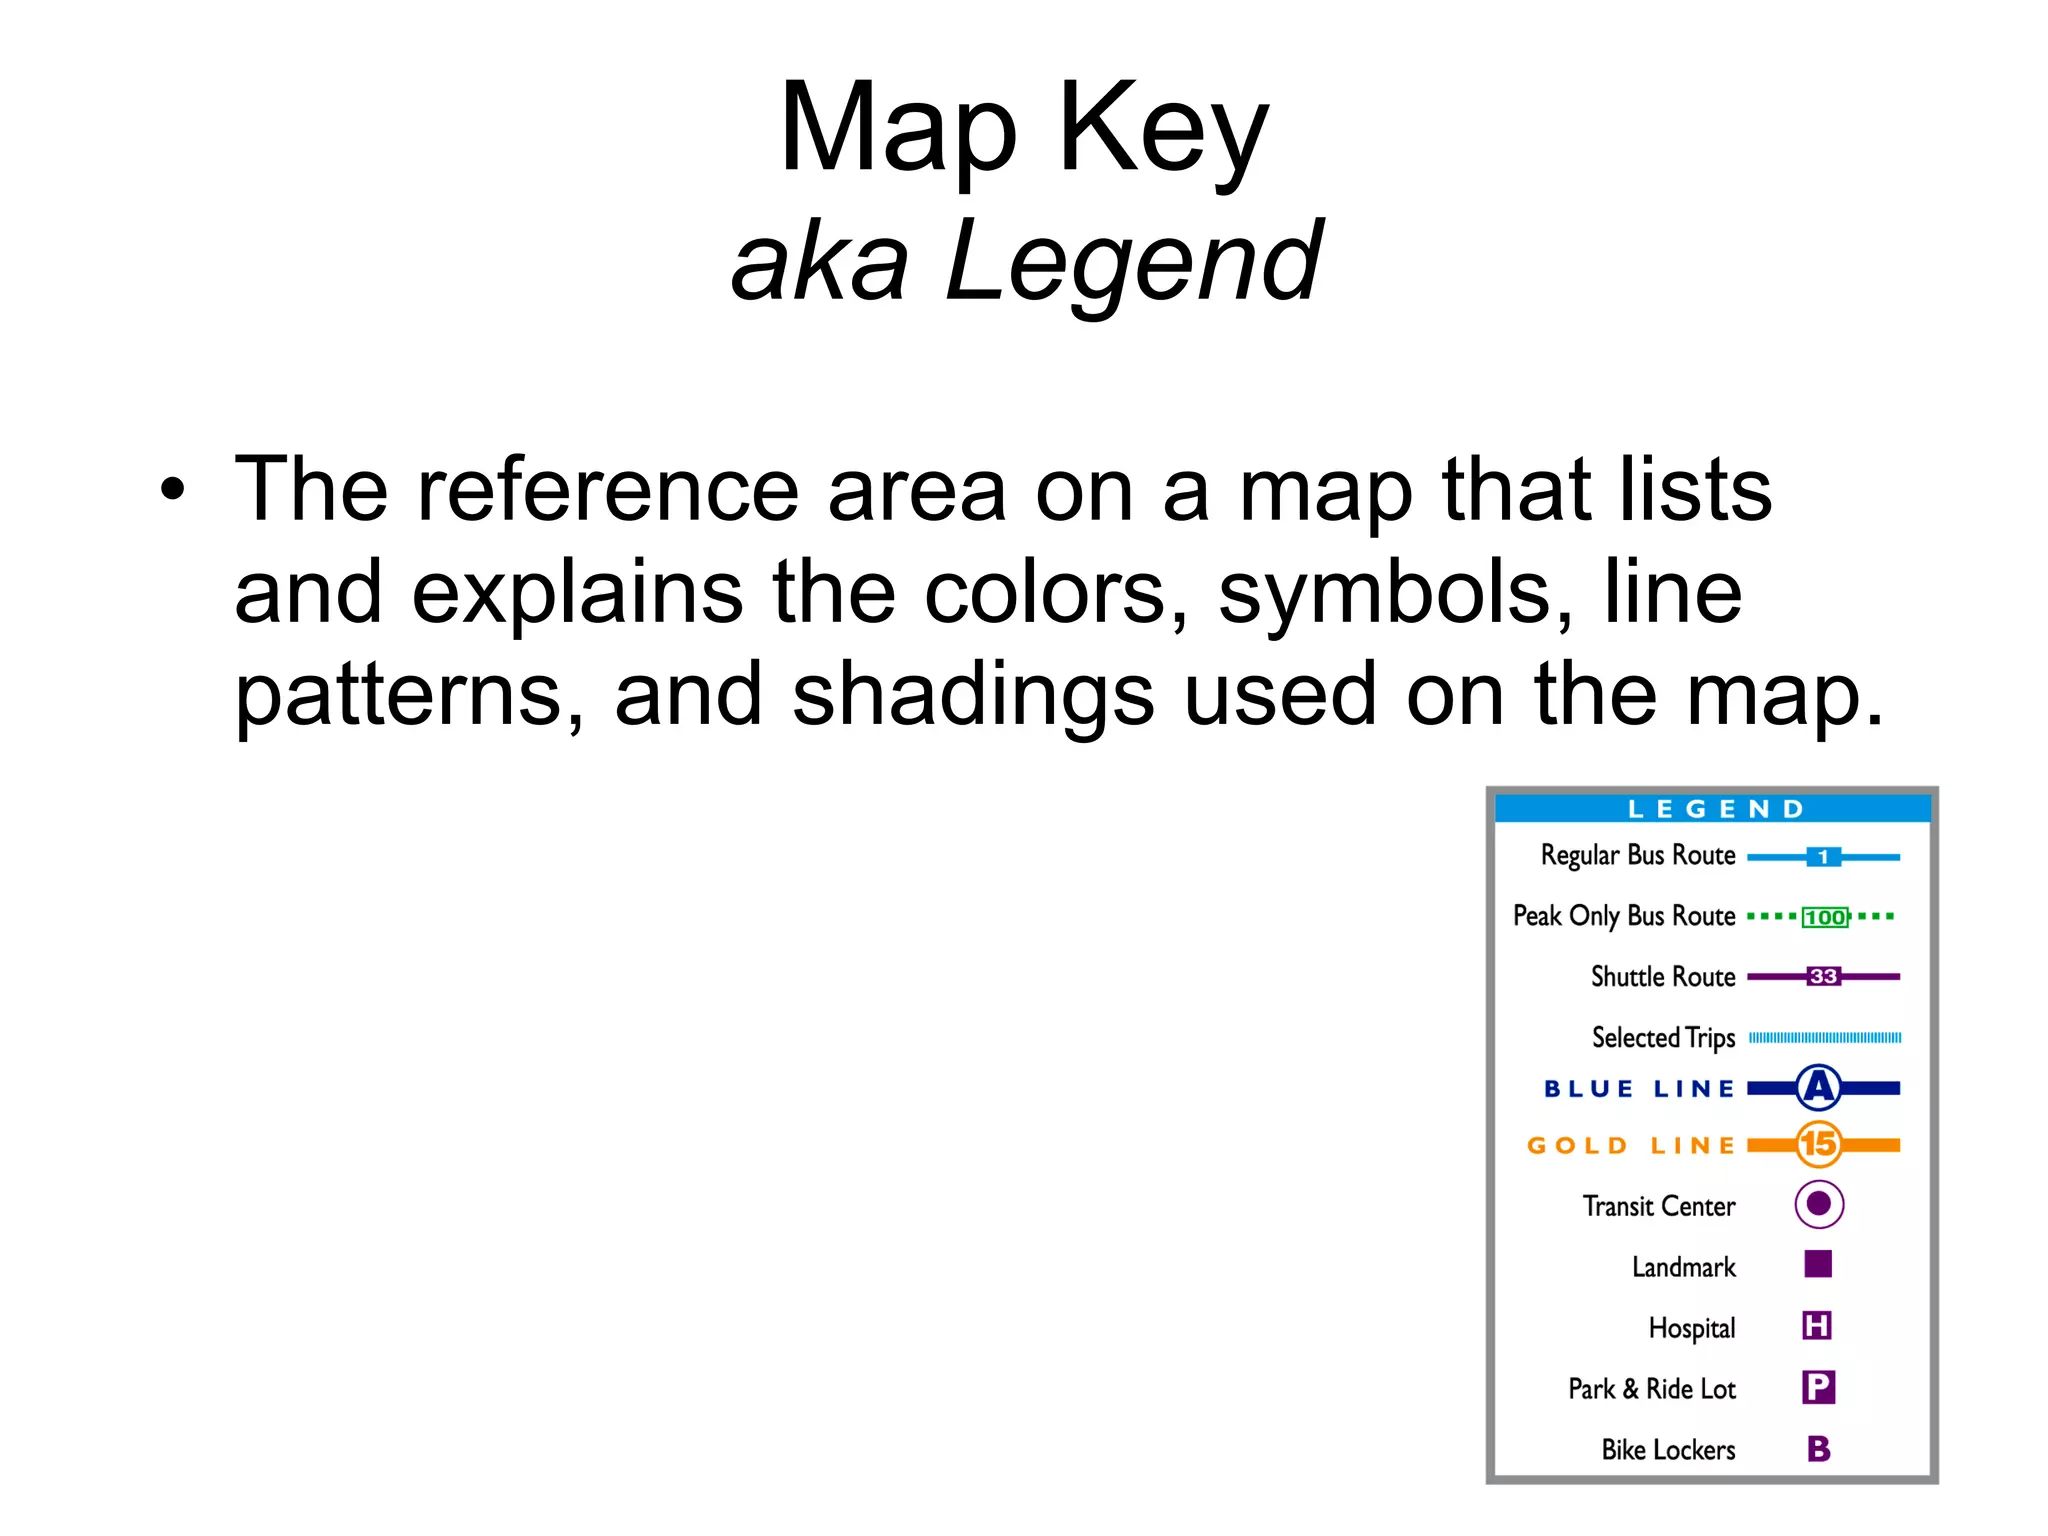
Types of Maps


Political Map Indicate state and national boundaries and capital and major cities. A capital city is usually marked with a star within a circle.


Physical Map illustrate the physical features of an area, such as the mountains, rivers and lakes. The water is usually shown in blue. Colors are used to show relief—differences in land elevations. Green is typically used at lower elevations, and orange or brown indicate higher elevations.
 
 
Resource Map aka economic map feature the type of natural resources or economic activity that dominates an area. Cartographers use symbols to show the locations of natural resources or economic activities. For example, oranges on a map of Florida tell you that oranges are grown there.
 
 
Climate Map give general information about the climate and precipitation (rain and snow) of a region. Cartographers, or mapmakers, use colors to show different climate or precipitation zones.
 
Topographic Map aka contour map A topographic map has contour lines to show the shape and elevation of the land. The closer the lines are together, the steeper the slope.
 
Road Map show major—some minor highways—and roads, airports, railroad tracks, cities and other points of interest in an area.
 
 
Thematic Maps Thematic maps are data maps of a specific subject or for a specific purpose. Ex: Population of given regions Age distribution Battle Maps Movements of people Languages Spoken Income


Map Key aka Legend The reference area on a map that lists and explains the colors, symbols, line patterns, and shadings used on the map.
Compass Rose Shows directions on a map
Scale Used to show distance on a map.

Types of maps

  • 1.
  • 2.
  • 3.
  • 4.
  • 5.
  • 6.
  • 7.
  • 8.
    Political Map Indicatestate and national boundaries and capital and major cities. A capital city is usually marked with a star within a circle.
  • 9.
  • 10.
  • 11.
  • 12.
    Physical Map illustratethe physical features of an area, such as the mountains, rivers and lakes. The water is usually shown in blue. Colors are used to show relief—differences in land elevations. Green is typically used at lower elevations, and orange or brown indicate higher elevations.
  • 13.
  • 14.
  • 15.
    Resource Map akaeconomic map feature the type of natural resources or economic activity that dominates an area. Cartographers use symbols to show the locations of natural resources or economic activities. For example, oranges on a map of Florida tell you that oranges are grown there.
  • 16.
  • 17.
  • 18.
    Climate Map givegeneral information about the climate and precipitation (rain and snow) of a region. Cartographers, or mapmakers, use colors to show different climate or precipitation zones.
  • 19.
  • 20.
    Topographic Map akacontour map A topographic map has contour lines to show the shape and elevation of the land. The closer the lines are together, the steeper the slope.
  • 21.
  • 22.
    Road Map showmajor—some minor highways—and roads, airports, railroad tracks, cities and other points of interest in an area.
  • 23.
  • 24.
  • 25.
    Thematic Maps Thematicmaps are data maps of a specific subject or for a specific purpose. Ex: Population of given regions Age distribution Battle Maps Movements of people Languages Spoken Income
  • 26.
  • 27.
  • 28.
  • 29.
    Map Key akaLegend The reference area on a map that lists and explains the colors, symbols, line patterns, and shadings used on the map.
  • 30.
    Compass Rose Showsdirections on a map
  • 31.
    Scale Used toshow distance on a map.