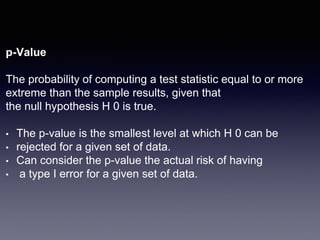
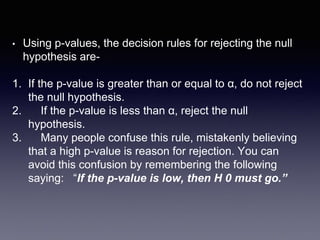
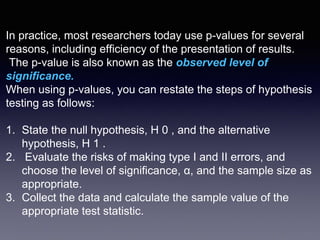
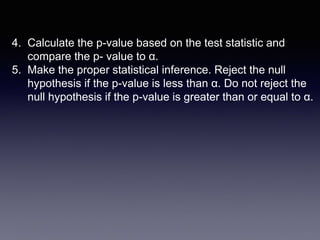
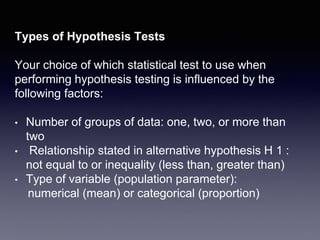
The document discusses hypothesis testing, including defining the null and alternative hypotheses, types of errors, test statistics, and the process of hypothesis testing. Some key points:
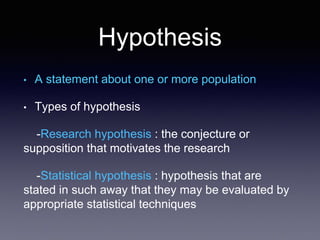
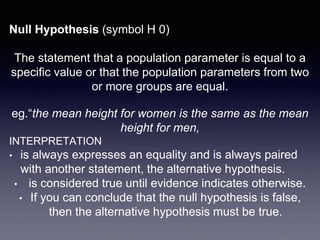
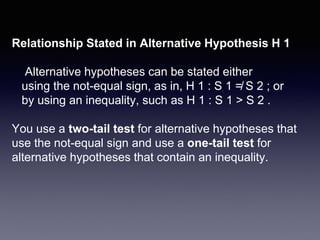
- The null hypothesis states that a population parameter is equal to a specific value. The alternative hypothesis is paired with the null and states inequality.
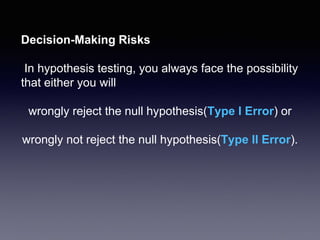
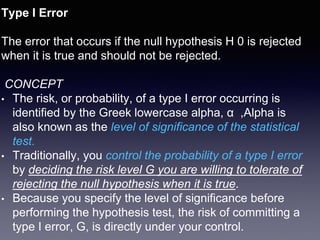
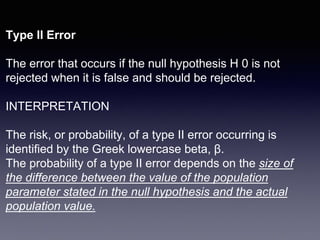
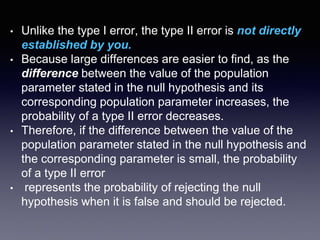
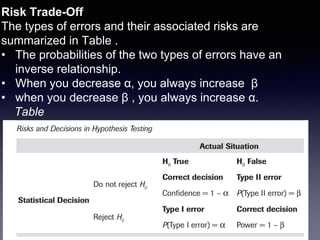
- Type I errors occur when the null hypothesis is rejected when it is true. Type II errors occur when the null is not rejected when it is false.
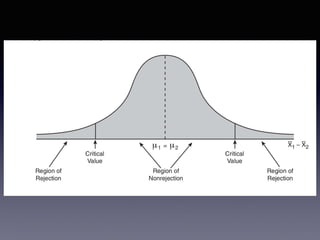
- A test statistic is calculated based on sample data and compared to critical values to determine if the null hypothesis can be rejected.
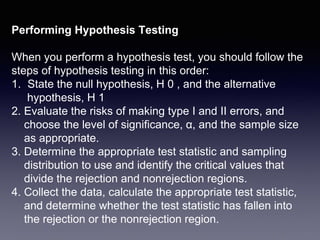
- Hypothesis testing follows steps of stating hypotheses, choosing a significance level, collecting/analyzing data,