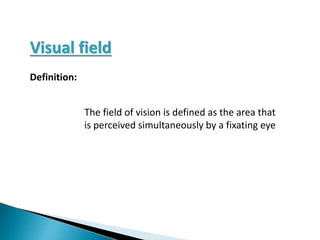
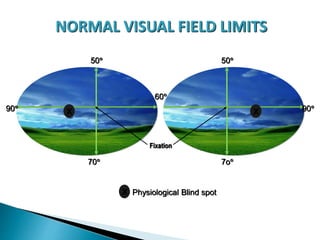
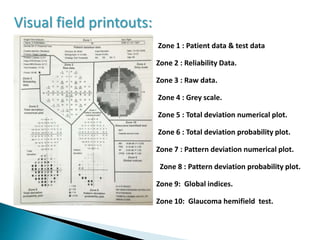
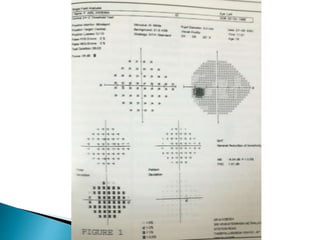
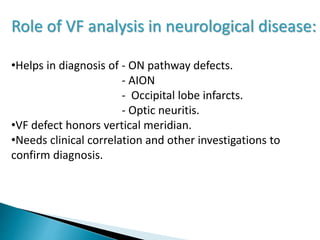
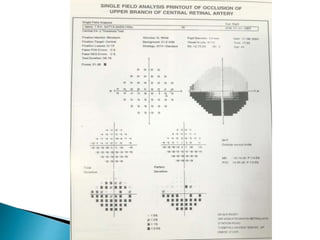
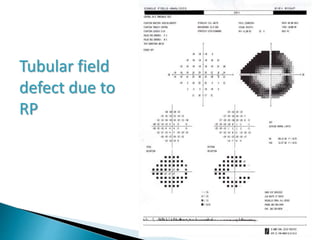
Perimetry
Chairman: Dr. Md.Musharaf hossain
Associate profesor
Dept of glaucoma,NIOH
Moderator: Dr. Samorendronath Adhikari
Assistant professor
Dept of glaucoma,NIOH
Presenter: Dr. Sadia Yeasmin Saki
Student FCPS( part-II).
The field of vision is defined as the area that
is perceived simultaneously by a fixating eye
Visual field
Definition:
NORMAL VISUAL FIELD LIMITS
60
50 50
90 90
70 7o
Fixation
X X
= Physiological Blind spotX
Perimetry is defined simply as the study of
the visual field and a perimeter is an
instrument designed for perimetry.
PERIMETRY & PERIMETER
History:
1970:- Octopus perimeter was first introduced .
1982:- Humphrey field analyzer was first displayed .
1983:- Michael Patella showed first clinical trial.
1984:- Started production and became popular.
Reasons for computerized perimetry :
1. Reproducible testing conditions.
2. Data storage capability.
3. More sensitive testing.
4. Easy operation and menu.
5. Requires little technician straining for reliable
results.
The role of visual field in ophthalmology:
1. To diagnose clinical conditions.
A) Ocular- Glaucoma, Optic nerve disorders.
B) CNS conditions- Optic nerve pathway disorders.
CNS Tumors.
Occipital lobe disorders.
2. To manage glaucoma-
To set target IOP
Follow up.
Visual field printouts:
Zone 1 : Patient data & test data
Zone 2 : Reliability Data.
Zone 3 : Raw data.
Zone 4 : Grey scale.
Zone 5 : Total deviation numerical plot.
Zone 6 : Total deviation probability plot.
Zone 7 : Pattern deviation numerical plot.
Zone 8 : Pattern deviation probability plot.
Zone 9: Global indices.
Zone 10: Glaucoma hemifield test.
Zone 1 :Threshold Testing Strategy
Supra threshold :
used in screening, not in follow up.
Threshold :
detail quantitative information of retina
1.Full Threshold
2. SITA -Swedish Interactive Threshold Algorithm
a. SITA standard
b. SITA fast
Zone 1 : Threshold Testing Pattern
Zone 1 : Threshold Test
30-2 central threshold pattern
Number of test point 76
Distance between each two points 6°
Only 3° bare area is left surrounding the fixation
spot
Zone 1 : Threshold Test
24-2 central threshold pattern
Number of test point 54
Distance between each two points 6°
Only 3° bare area is left surrounding the
fixation spot
10-2 Central threshold pattern:
• No of test point 68.
•Distance between 2 points 2 degree.
•Bare area 1 degree surrounding fixation spot.
Macular point pattern
• No of point 16.
• Distance between two points is 2 degree.
• Bare area – 1 degree from fixation point.
• Extension of testing area from fixation point is 5 degree.
Zone 1 : Test Data
Size of stimulus
 0=1/16mm²
 I=1/4mm²
 II=1mm²
 III=4mm²
IV=16mm²
 V=64mm²
 Commonly used III-
Find small Scotoma
V Used in macluar disease
Stimulas duration 0.2 second
or less
STIMULUS SIZE
Why III size ? it subtends only
0.430. This size is small enough to find even
very small scotoma . This is large enough to
be relatively unaffected by residual refractive
error .
Interpretation of single field analysis printout:
Step-1:
Verify whether the patient data and test data are properly fed to
the field analyzer.
Step-2:
Decide the reliability of the test.
Decide the proper selection of the test.
Step-3:
Correlate foveal sensitivity with V/A
Step-4:
Confirm the location of blind spot.
Step-5:
Analysis of TDPP and PDPP.
The effect of size of pupil:
-The size of pupil should be 3-4 mm
-Constricted pupil-
-Diffuse visual field depression.
- Edge scotoma.
-Very important in follow up test.
The effect of refractive error correction for
near vision:
1.If not corrected generalized. depression in TDPP.
2. No effect on pattern deviation plot.
Zone 1: Test Data
Fixation of target :
Central : yellow light at
centre
Small diamond : below the
central target
Large diamond : when
central fixation lost
Bottom led: Superior field
test
Fixation losses:
• 5% of the stimuli are given on blind spot.
•Patient response to this stimuli due to shift of fixation.
•Fixation loses > 20% are considered unreliable.
Zone II : Foveal Threshold & Reliability Indices
Fixation loss:>20% is unreliable
False positive:>20% is unreliable
False negative:>20% is unreliable
Localized defect:
•The TDPP and PDPP looks similar.
•Causes- Early glaucomatous ON damage
-AION
-ON pathway defect.
-Occipital lobe infarcts.
Irregular generalized field defect:
• Generalized field defect in TDPP.
•Localized defect in PDPP.
•Found in advance stage of glaucoma.
•Cataract associated with glaucoma.
Uniform generalized field defect:
•Generalized defect in TDPP.
•Normal PDPP.
•Cause- Media opacities.
•Advanced and end stage glaucoma.
•Optic neuritis.
Interpretation of VF defects of glaucoma:
•Anderson’s criteria:
•Used to pickup minimum abnormality.
•Criteria are-
1. GHT- Outside normal limit at least on two
consecutive occasion
2. Three non-edge adjacent scotomas in TDPP or PDPP.
with P values as follows- two point P<5%
- One point P<1%
3.CPSD <5% on two consecutive field
Zone VII : Glaucoma Hemi Field Test
Compare 5 zone of upper field
with mirror image of lower
field to see asymmetric field
loss in glaucoma
1. Outside normal limit
2. Borderline
3. General reduction of
sensitivity
4. Abnormal high sensitivity
5. With in normal limit
Nasal step
pattern
Advanced
case of
glaucoma
Arcuate pattern
Absolute
Scotoma:
Glaucoma associated with cataract:
•Generalized depression in TDPP.
•Apply Anderson’s criteria to PDPP.
•PDPP shows significant P value symbol.
Role of VF analysis in neurological disease:
•Helps in diagnosis of - ON pathway defects.
- AION
- Occipital lobe infarcts.
- Optic neuritis.
•VF defect honors vertical meridian.
•Needs clinical correlation and other investigations to
confirm diagnosis.
Enlargement
of blind spot
Bi-nasal
hemianopia
AION
VF defect due to retinal diseases
Tubular field
defect due to
RP
Take home message:
1. Visual field never be interpreted in isolation.
2. At least 2/3 visual field should be recorded to set up
base line visual field.
3. Perimetry should be done in proper condition.
Thank You

Visual field

  • 1.
    Perimetry Chairman: Dr. Md.Musharafhossain Associate profesor Dept of glaucoma,NIOH Moderator: Dr. Samorendronath Adhikari Assistant professor Dept of glaucoma,NIOH Presenter: Dr. Sadia Yeasmin Saki Student FCPS( part-II).
  • 2.
    The field ofvision is defined as the area that is perceived simultaneously by a fixating eye Visual field Definition:
  • 3.
    NORMAL VISUAL FIELDLIMITS 60 50 50 90 90 70 7o Fixation X X = Physiological Blind spotX
  • 4.
    Perimetry is definedsimply as the study of the visual field and a perimeter is an instrument designed for perimetry. PERIMETRY & PERIMETER
  • 5.
    History: 1970:- Octopus perimeterwas first introduced . 1982:- Humphrey field analyzer was first displayed . 1983:- Michael Patella showed first clinical trial. 1984:- Started production and became popular.
  • 6.
    Reasons for computerizedperimetry : 1. Reproducible testing conditions. 2. Data storage capability. 3. More sensitive testing. 4. Easy operation and menu. 5. Requires little technician straining for reliable results.
  • 7.
    The role ofvisual field in ophthalmology: 1. To diagnose clinical conditions. A) Ocular- Glaucoma, Optic nerve disorders. B) CNS conditions- Optic nerve pathway disorders. CNS Tumors. Occipital lobe disorders. 2. To manage glaucoma- To set target IOP Follow up.
  • 8.
    Visual field printouts: Zone1 : Patient data & test data Zone 2 : Reliability Data. Zone 3 : Raw data. Zone 4 : Grey scale. Zone 5 : Total deviation numerical plot. Zone 6 : Total deviation probability plot. Zone 7 : Pattern deviation numerical plot. Zone 8 : Pattern deviation probability plot. Zone 9: Global indices. Zone 10: Glaucoma hemifield test.
  • 9.
    Zone 1 :ThresholdTesting Strategy Supra threshold : used in screening, not in follow up. Threshold : detail quantitative information of retina 1.Full Threshold 2. SITA -Swedish Interactive Threshold Algorithm a. SITA standard b. SITA fast
  • 10.
    Zone 1 :Threshold Testing Pattern
  • 11.
    Zone 1 :Threshold Test 30-2 central threshold pattern Number of test point 76 Distance between each two points 6° Only 3° bare area is left surrounding the fixation spot
  • 12.
    Zone 1 :Threshold Test 24-2 central threshold pattern Number of test point 54 Distance between each two points 6° Only 3° bare area is left surrounding the fixation spot
  • 13.
    10-2 Central thresholdpattern: • No of test point 68. •Distance between 2 points 2 degree. •Bare area 1 degree surrounding fixation spot.
  • 14.
    Macular point pattern •No of point 16. • Distance between two points is 2 degree. • Bare area – 1 degree from fixation point. • Extension of testing area from fixation point is 5 degree.
  • 15.
    Zone 1 :Test Data Size of stimulus  0=1/16mm²  I=1/4mm²  II=1mm²  III=4mm² IV=16mm²  V=64mm²  Commonly used III- Find small Scotoma V Used in macluar disease Stimulas duration 0.2 second or less
  • 16.
    STIMULUS SIZE Why IIIsize ? it subtends only 0.430. This size is small enough to find even very small scotoma . This is large enough to be relatively unaffected by residual refractive error .
  • 17.
    Interpretation of singlefield analysis printout: Step-1: Verify whether the patient data and test data are properly fed to the field analyzer. Step-2: Decide the reliability of the test. Decide the proper selection of the test. Step-3: Correlate foveal sensitivity with V/A Step-4: Confirm the location of blind spot. Step-5: Analysis of TDPP and PDPP.
  • 18.
    The effect ofsize of pupil: -The size of pupil should be 3-4 mm -Constricted pupil- -Diffuse visual field depression. - Edge scotoma. -Very important in follow up test.
  • 20.
    The effect ofrefractive error correction for near vision: 1.If not corrected generalized. depression in TDPP. 2. No effect on pattern deviation plot.
  • 22.
    Zone 1: TestData Fixation of target : Central : yellow light at centre Small diamond : below the central target Large diamond : when central fixation lost Bottom led: Superior field test
  • 23.
    Fixation losses: • 5%of the stimuli are given on blind spot. •Patient response to this stimuli due to shift of fixation. •Fixation loses > 20% are considered unreliable.
  • 24.
    Zone II :Foveal Threshold & Reliability Indices Fixation loss:>20% is unreliable False positive:>20% is unreliable False negative:>20% is unreliable
  • 26.
    Localized defect: •The TDPPand PDPP looks similar. •Causes- Early glaucomatous ON damage -AION -ON pathway defect. -Occipital lobe infarcts.
  • 28.
    Irregular generalized fielddefect: • Generalized field defect in TDPP. •Localized defect in PDPP. •Found in advance stage of glaucoma. •Cataract associated with glaucoma.
  • 30.
    Uniform generalized fielddefect: •Generalized defect in TDPP. •Normal PDPP. •Cause- Media opacities. •Advanced and end stage glaucoma. •Optic neuritis.
  • 32.
    Interpretation of VFdefects of glaucoma:
  • 33.
    •Anderson’s criteria: •Used topickup minimum abnormality. •Criteria are- 1. GHT- Outside normal limit at least on two consecutive occasion 2. Three non-edge adjacent scotomas in TDPP or PDPP. with P values as follows- two point P<5% - One point P<1% 3.CPSD <5% on two consecutive field
  • 34.
    Zone VII :Glaucoma Hemi Field Test Compare 5 zone of upper field with mirror image of lower field to see asymmetric field loss in glaucoma 1. Outside normal limit 2. Borderline 3. General reduction of sensitivity 4. Abnormal high sensitivity 5. With in normal limit
  • 35.
  • 36.
  • 37.
  • 38.
  • 39.
    Glaucoma associated withcataract: •Generalized depression in TDPP. •Apply Anderson’s criteria to PDPP. •PDPP shows significant P value symbol.
  • 41.
    Role of VFanalysis in neurological disease: •Helps in diagnosis of - ON pathway defects. - AION - Occipital lobe infarcts. - Optic neuritis. •VF defect honors vertical meridian. •Needs clinical correlation and other investigations to confirm diagnosis.
  • 42.
  • 44.
  • 46.
  • 47.
    VF defect dueto retinal diseases
  • 49.
  • 50.
    Take home message: 1.Visual field never be interpreted in isolation. 2. At least 2/3 visual field should be recorded to set up base line visual field. 3. Perimetry should be done in proper condition.
  • 51.