Download as ODP, PPTX


This document provides an overview and summary of a lecture on survey research and design in psychology. It covers the following key points: - Survey research involves using standardized questionnaires to collect data on psychological phenomena. It has become a popular social science method since the 1920s. - Survey design considerations include whether the survey is self-administered or interview-based, the types of questions used, and response formats. Proper sampling and minimizing biases are also important. - Analysis of survey data involves descriptive statistics, graphs, and correlations to describe and explore relationships in the data. Tools like exploratory factor analysis can be used to develop psychometric instruments. Multiple linear regression allows predicting outcomes from multiple variables.
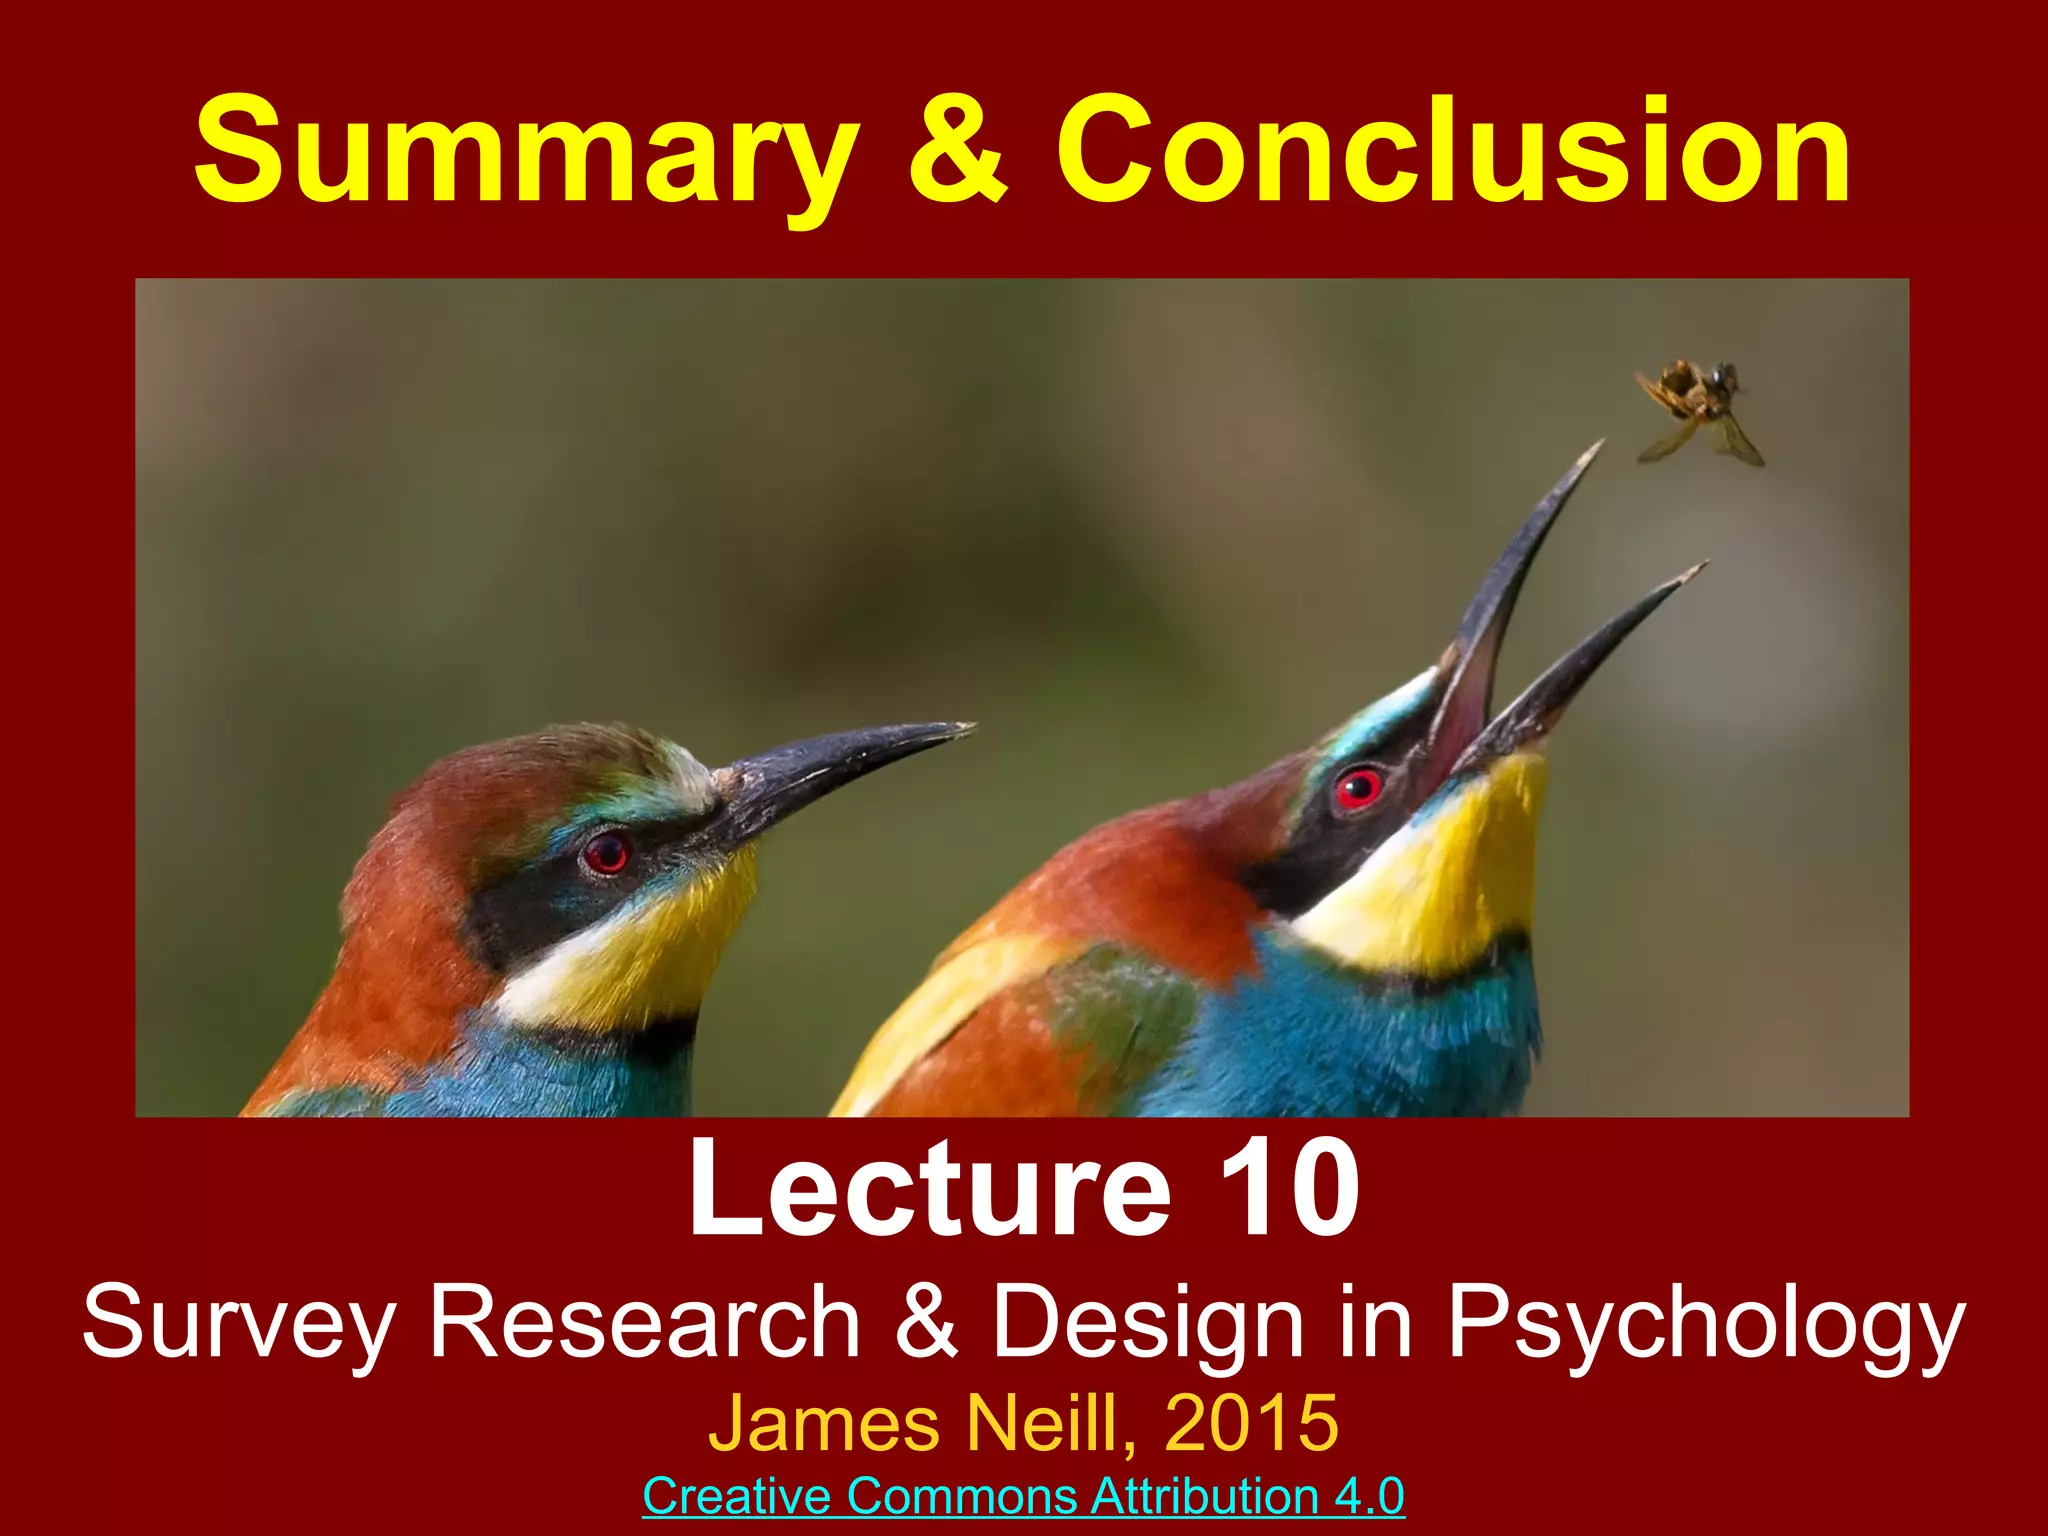
Introduces survey research in psychology covering modules on design, statistics, and more.
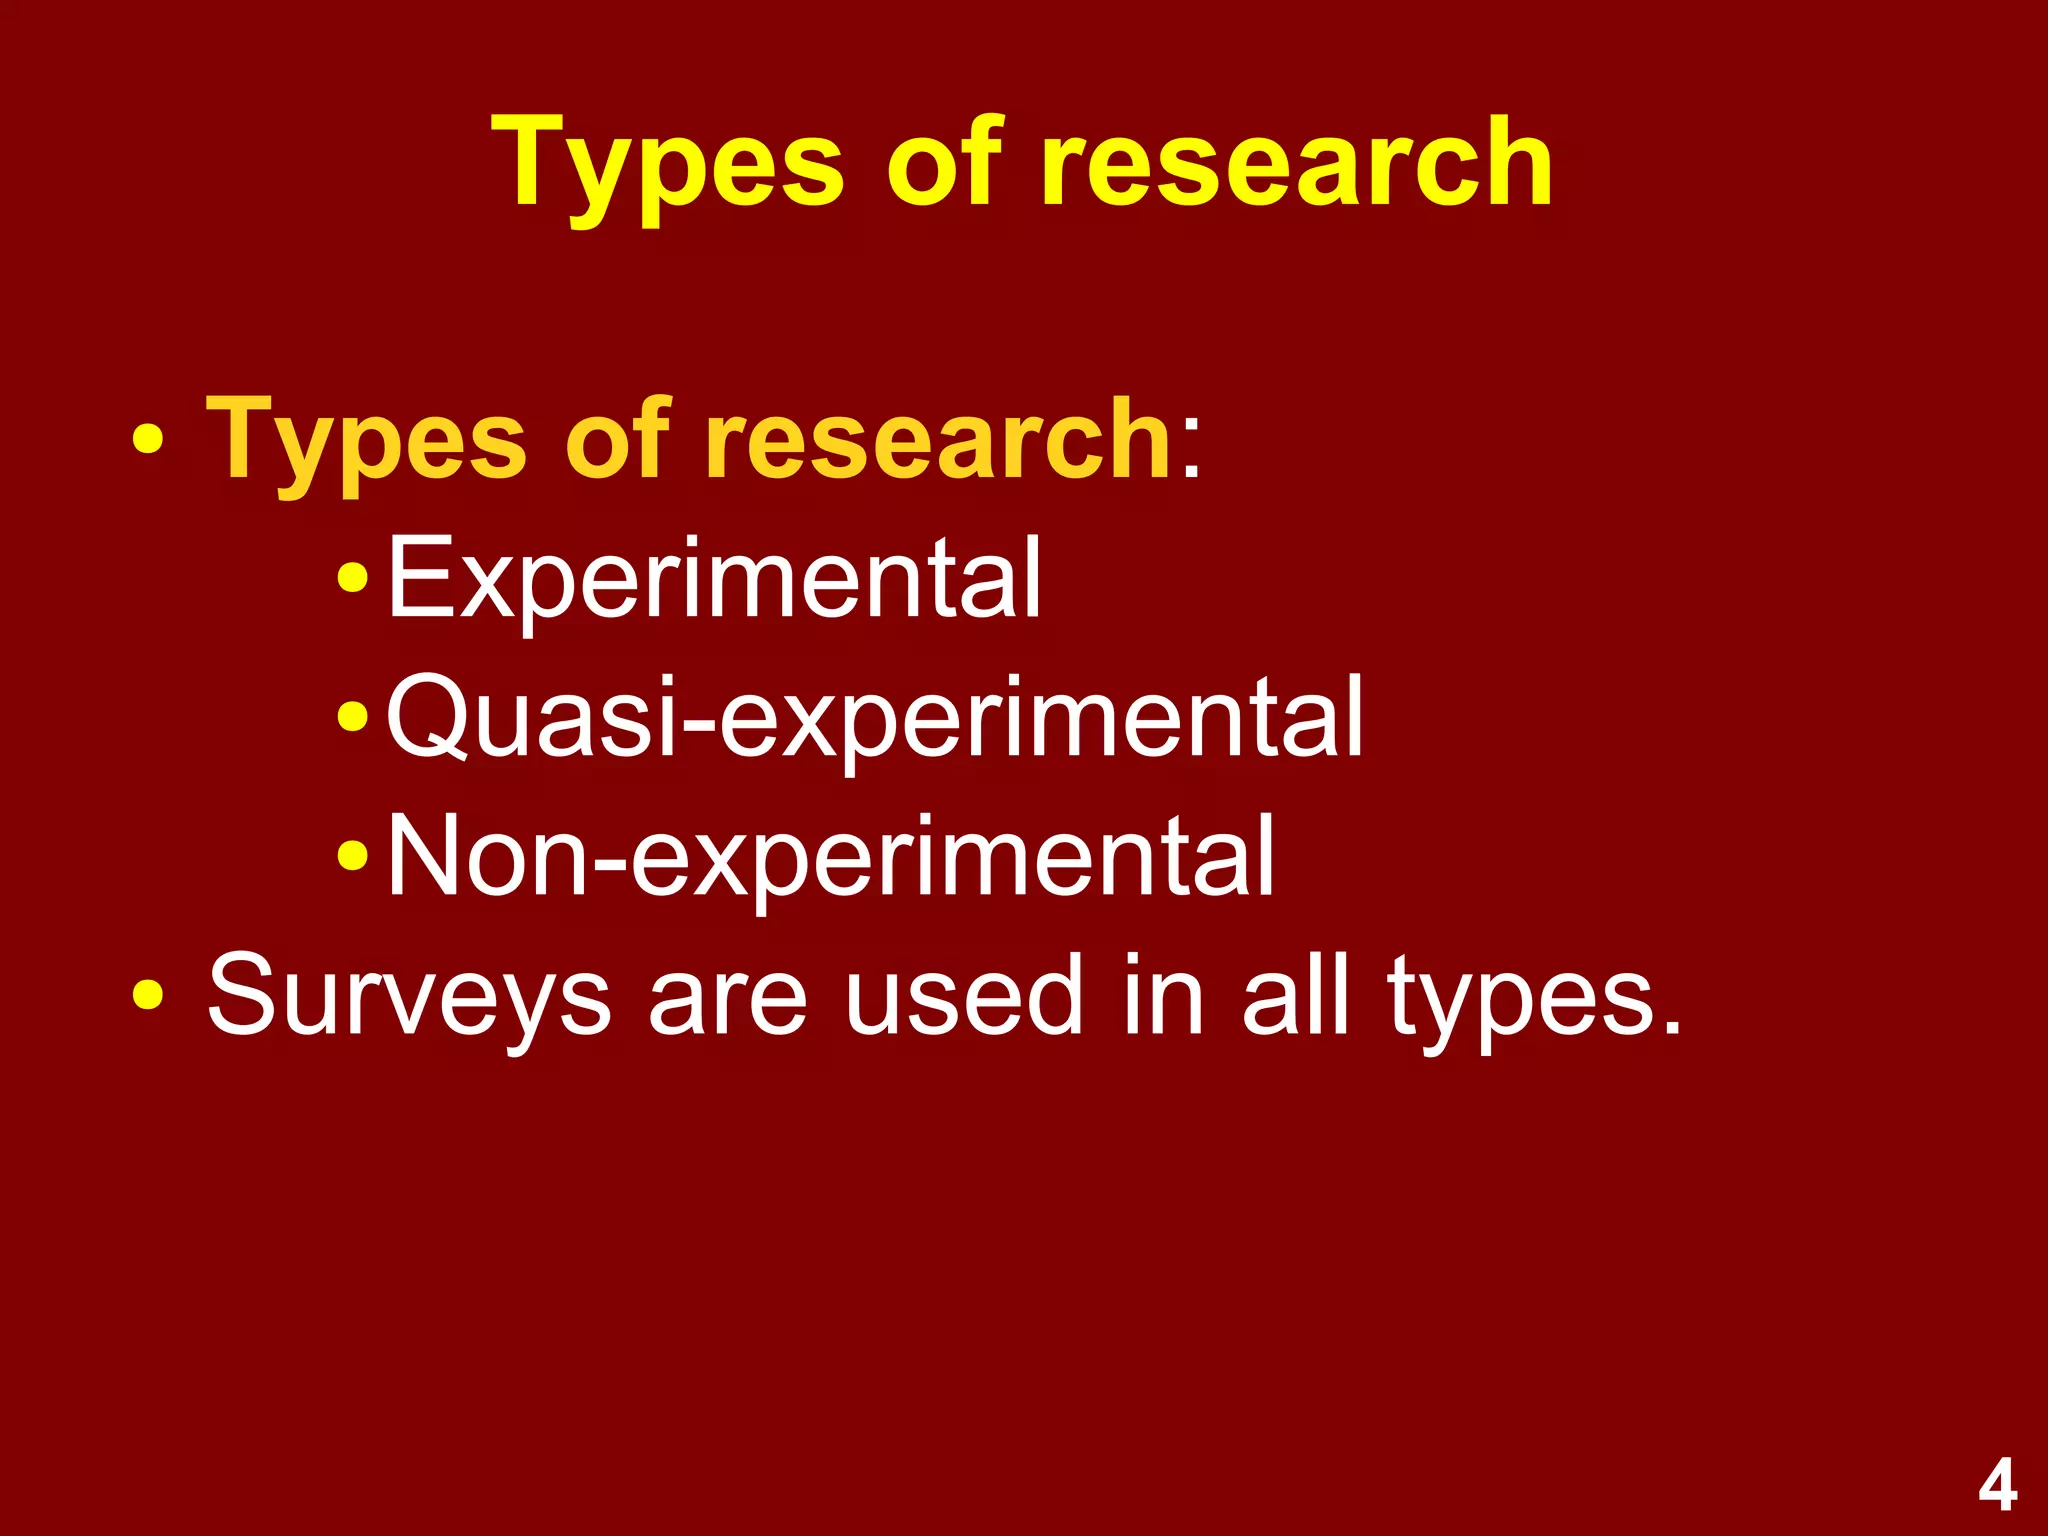
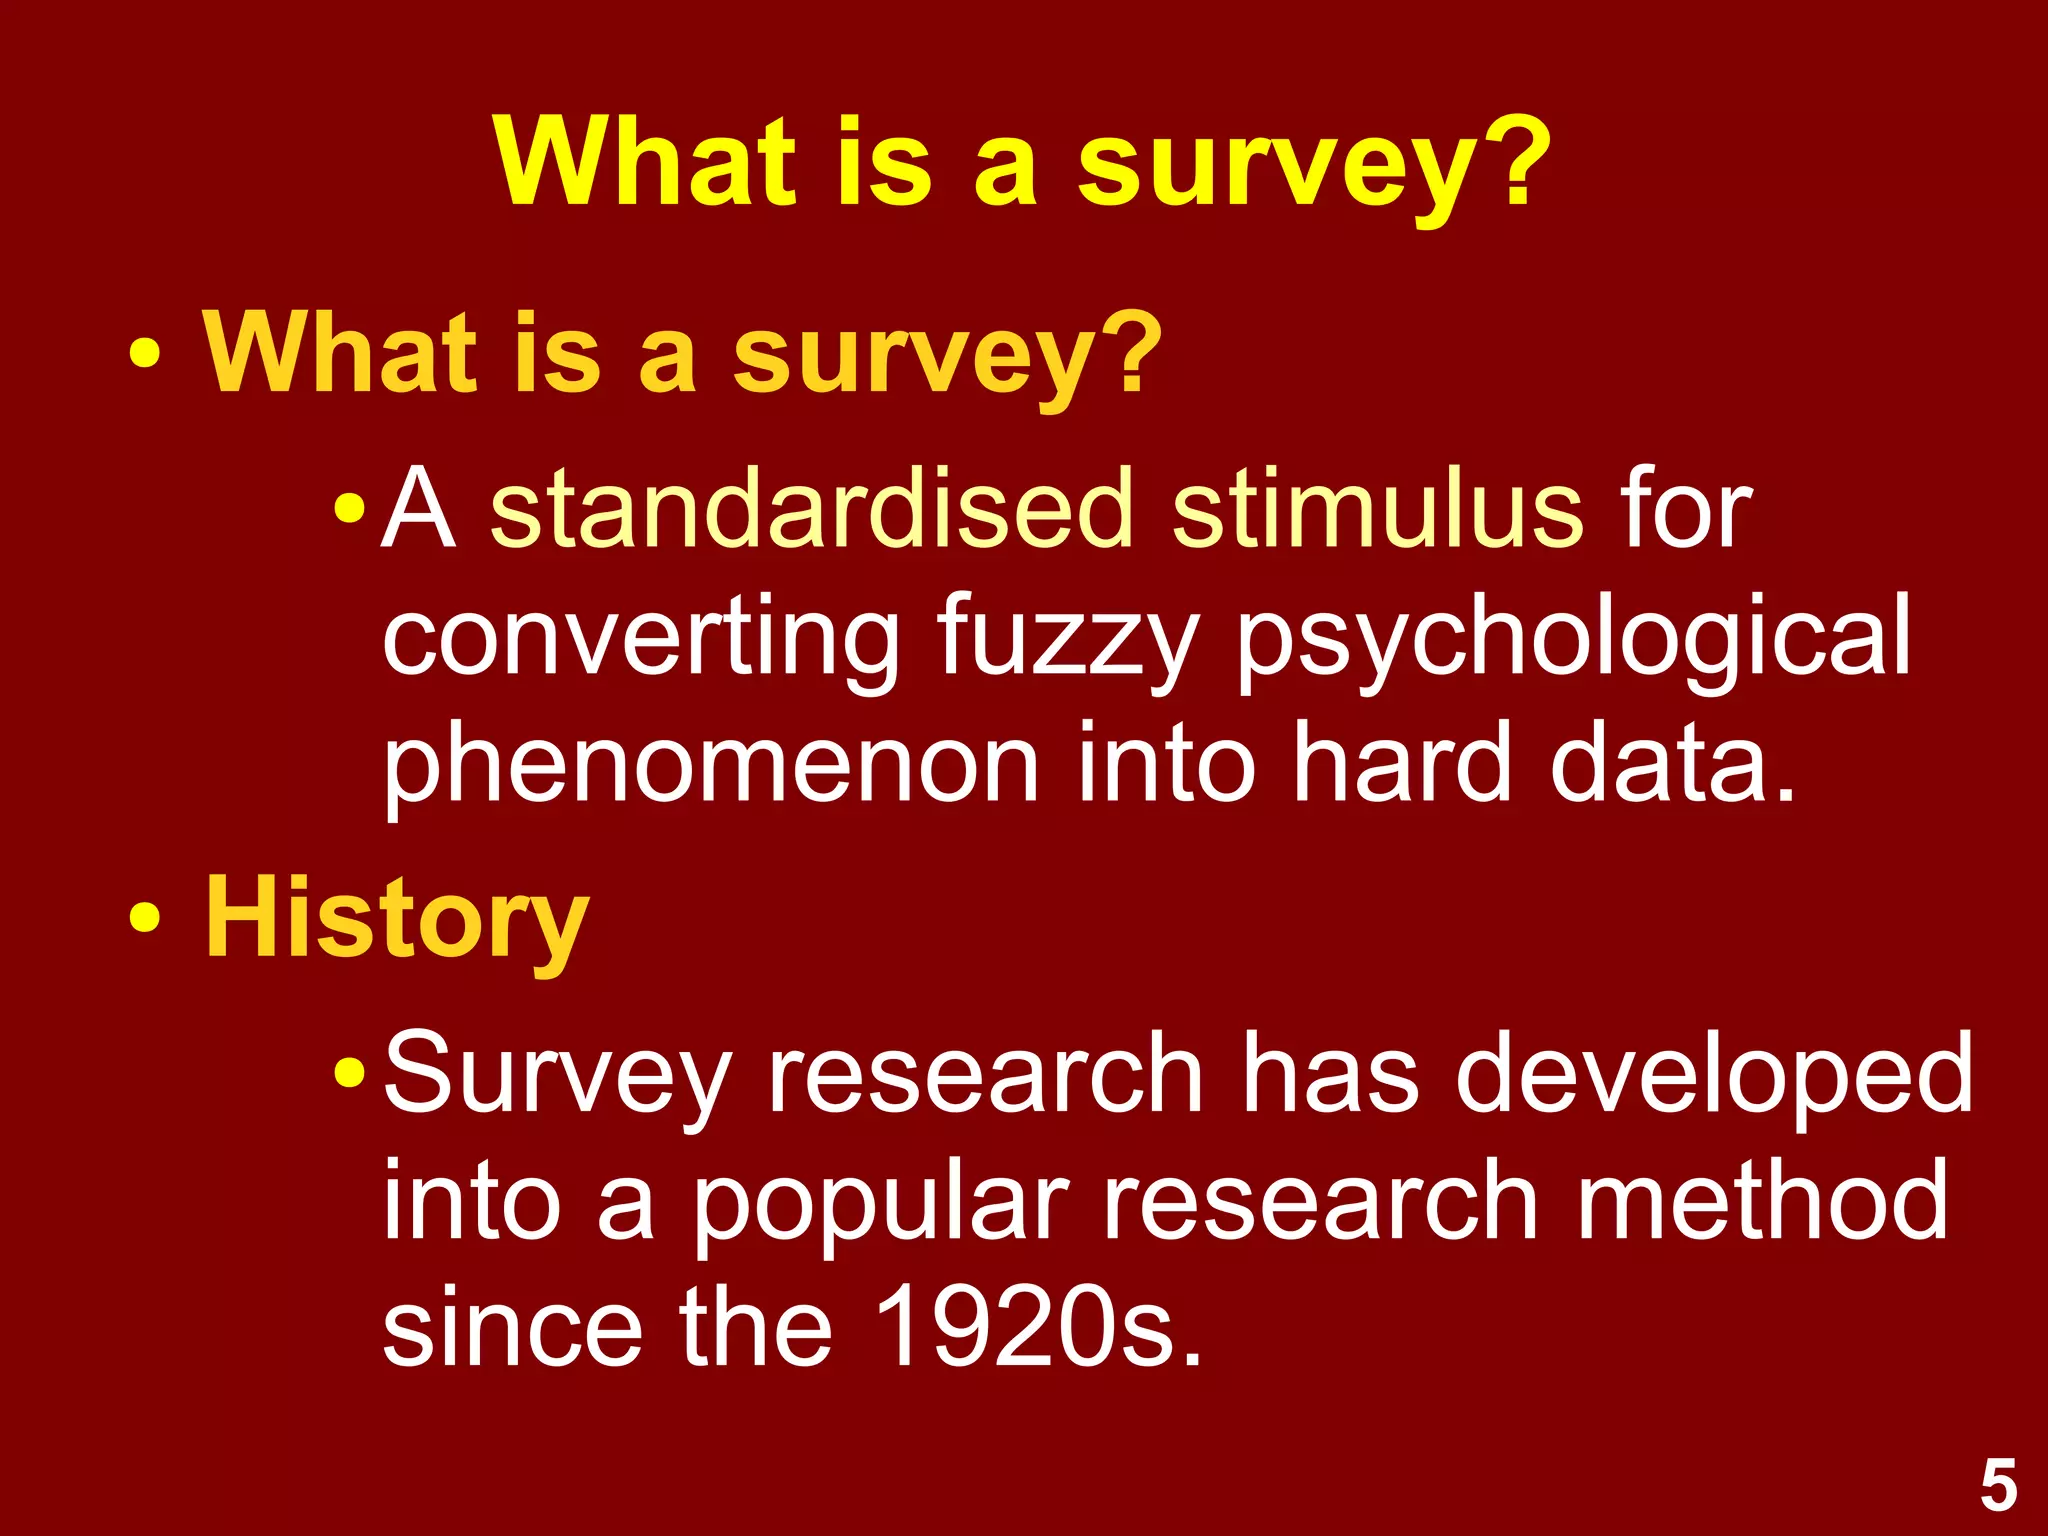
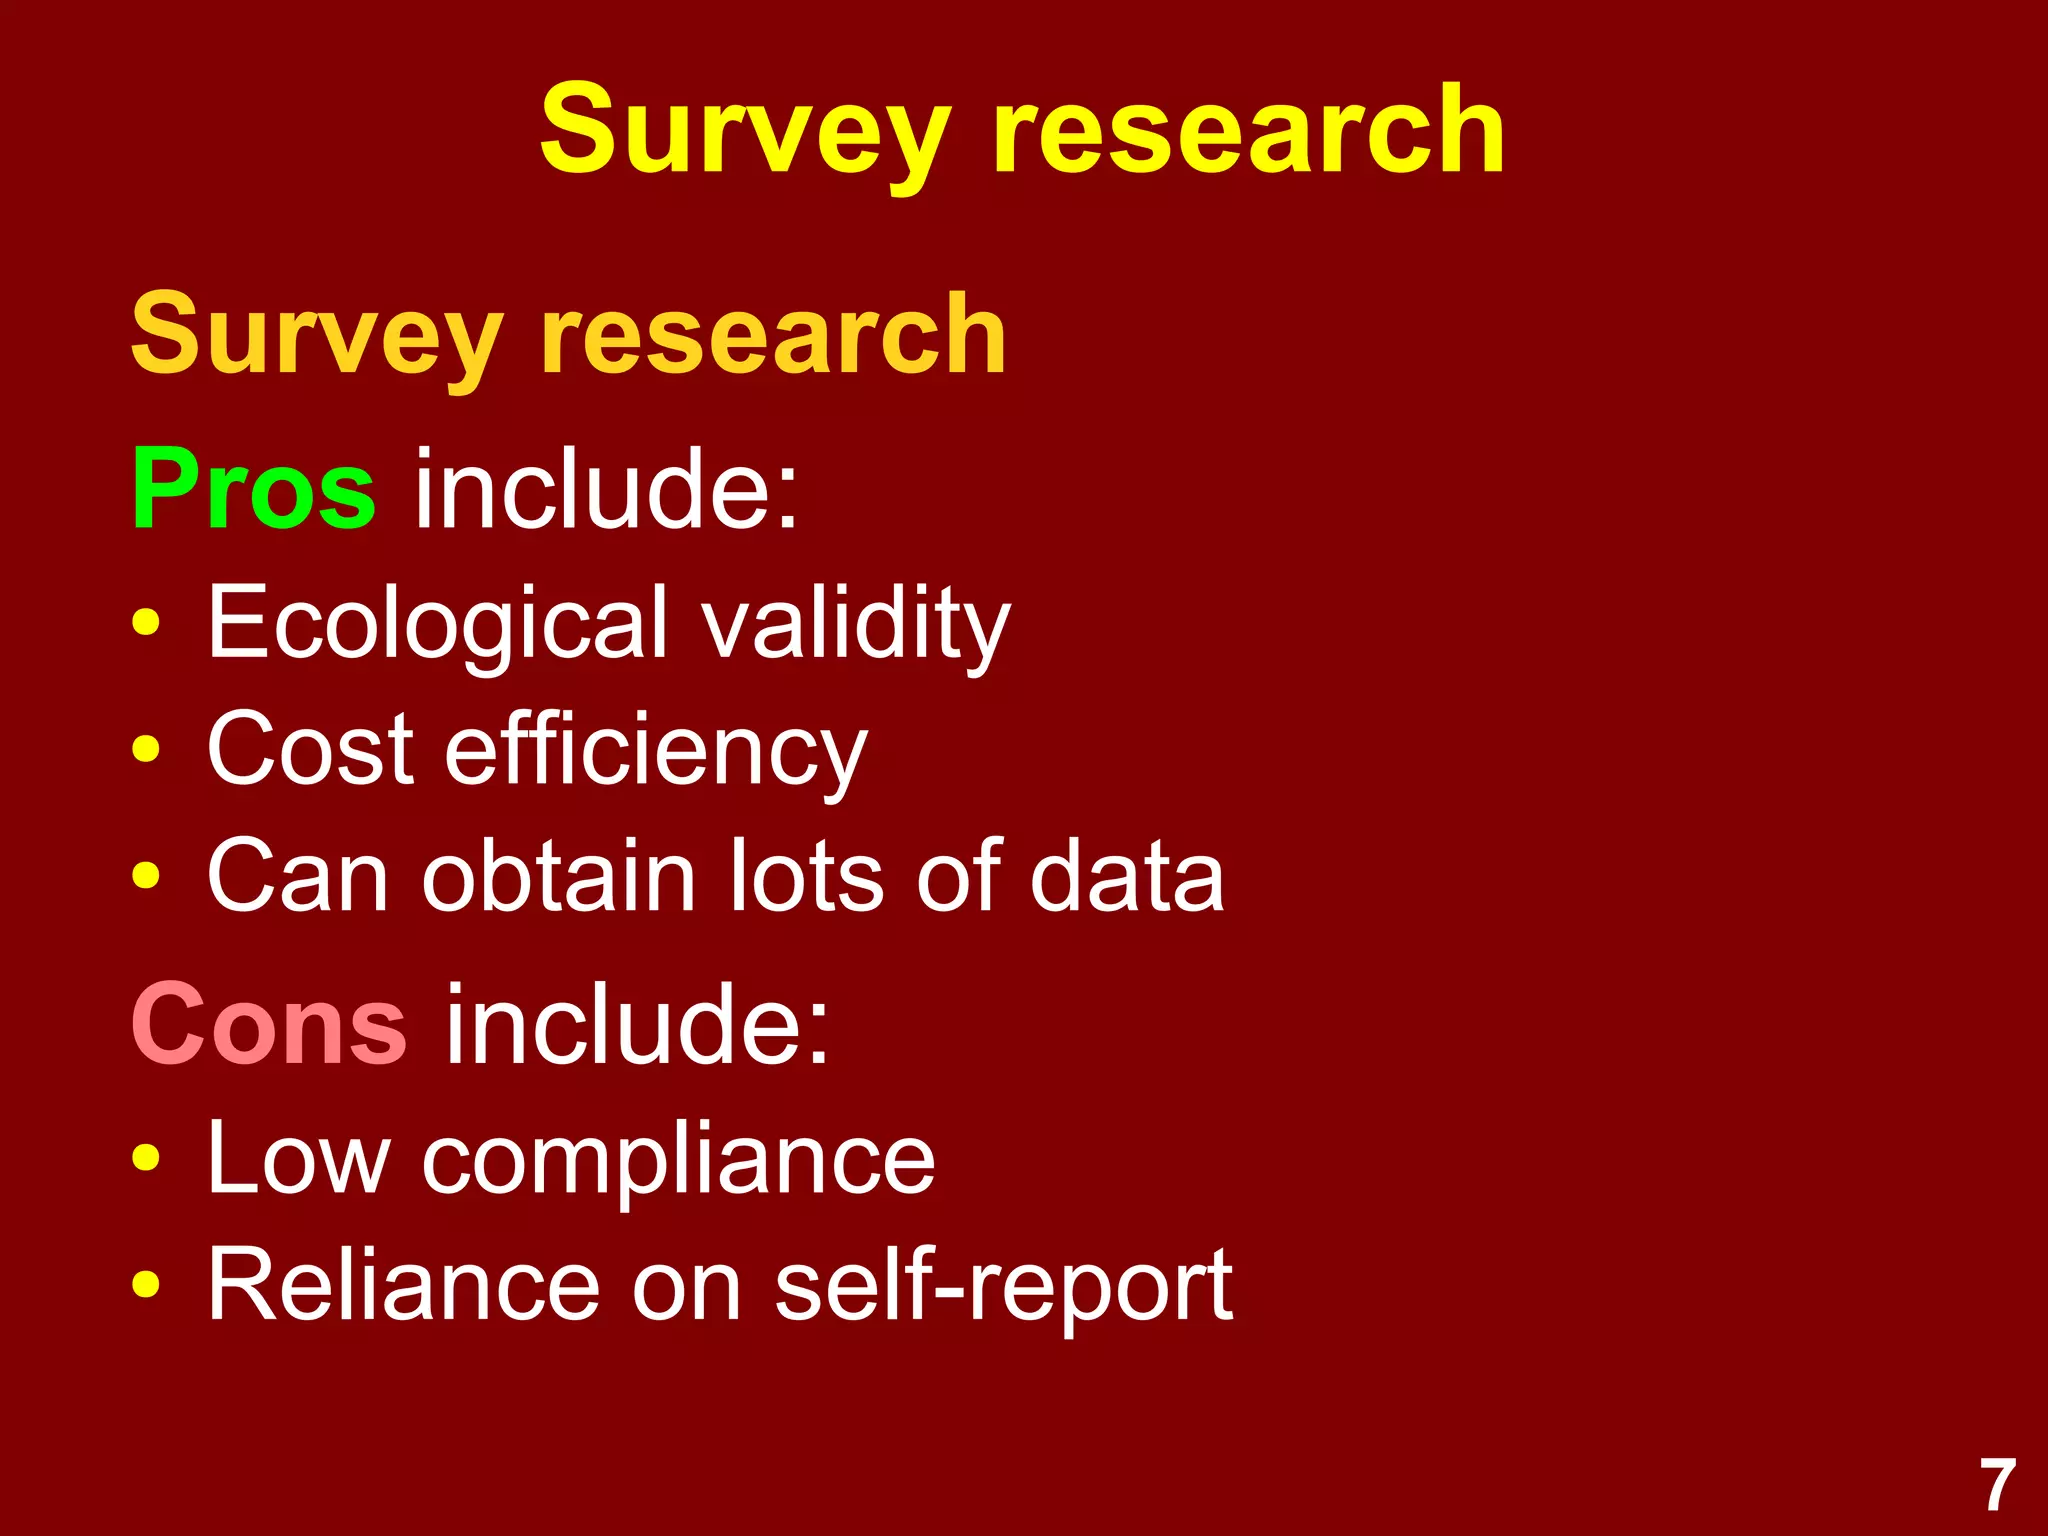
Discusses types of research, what surveys are, and their purposes, including pros and cons.
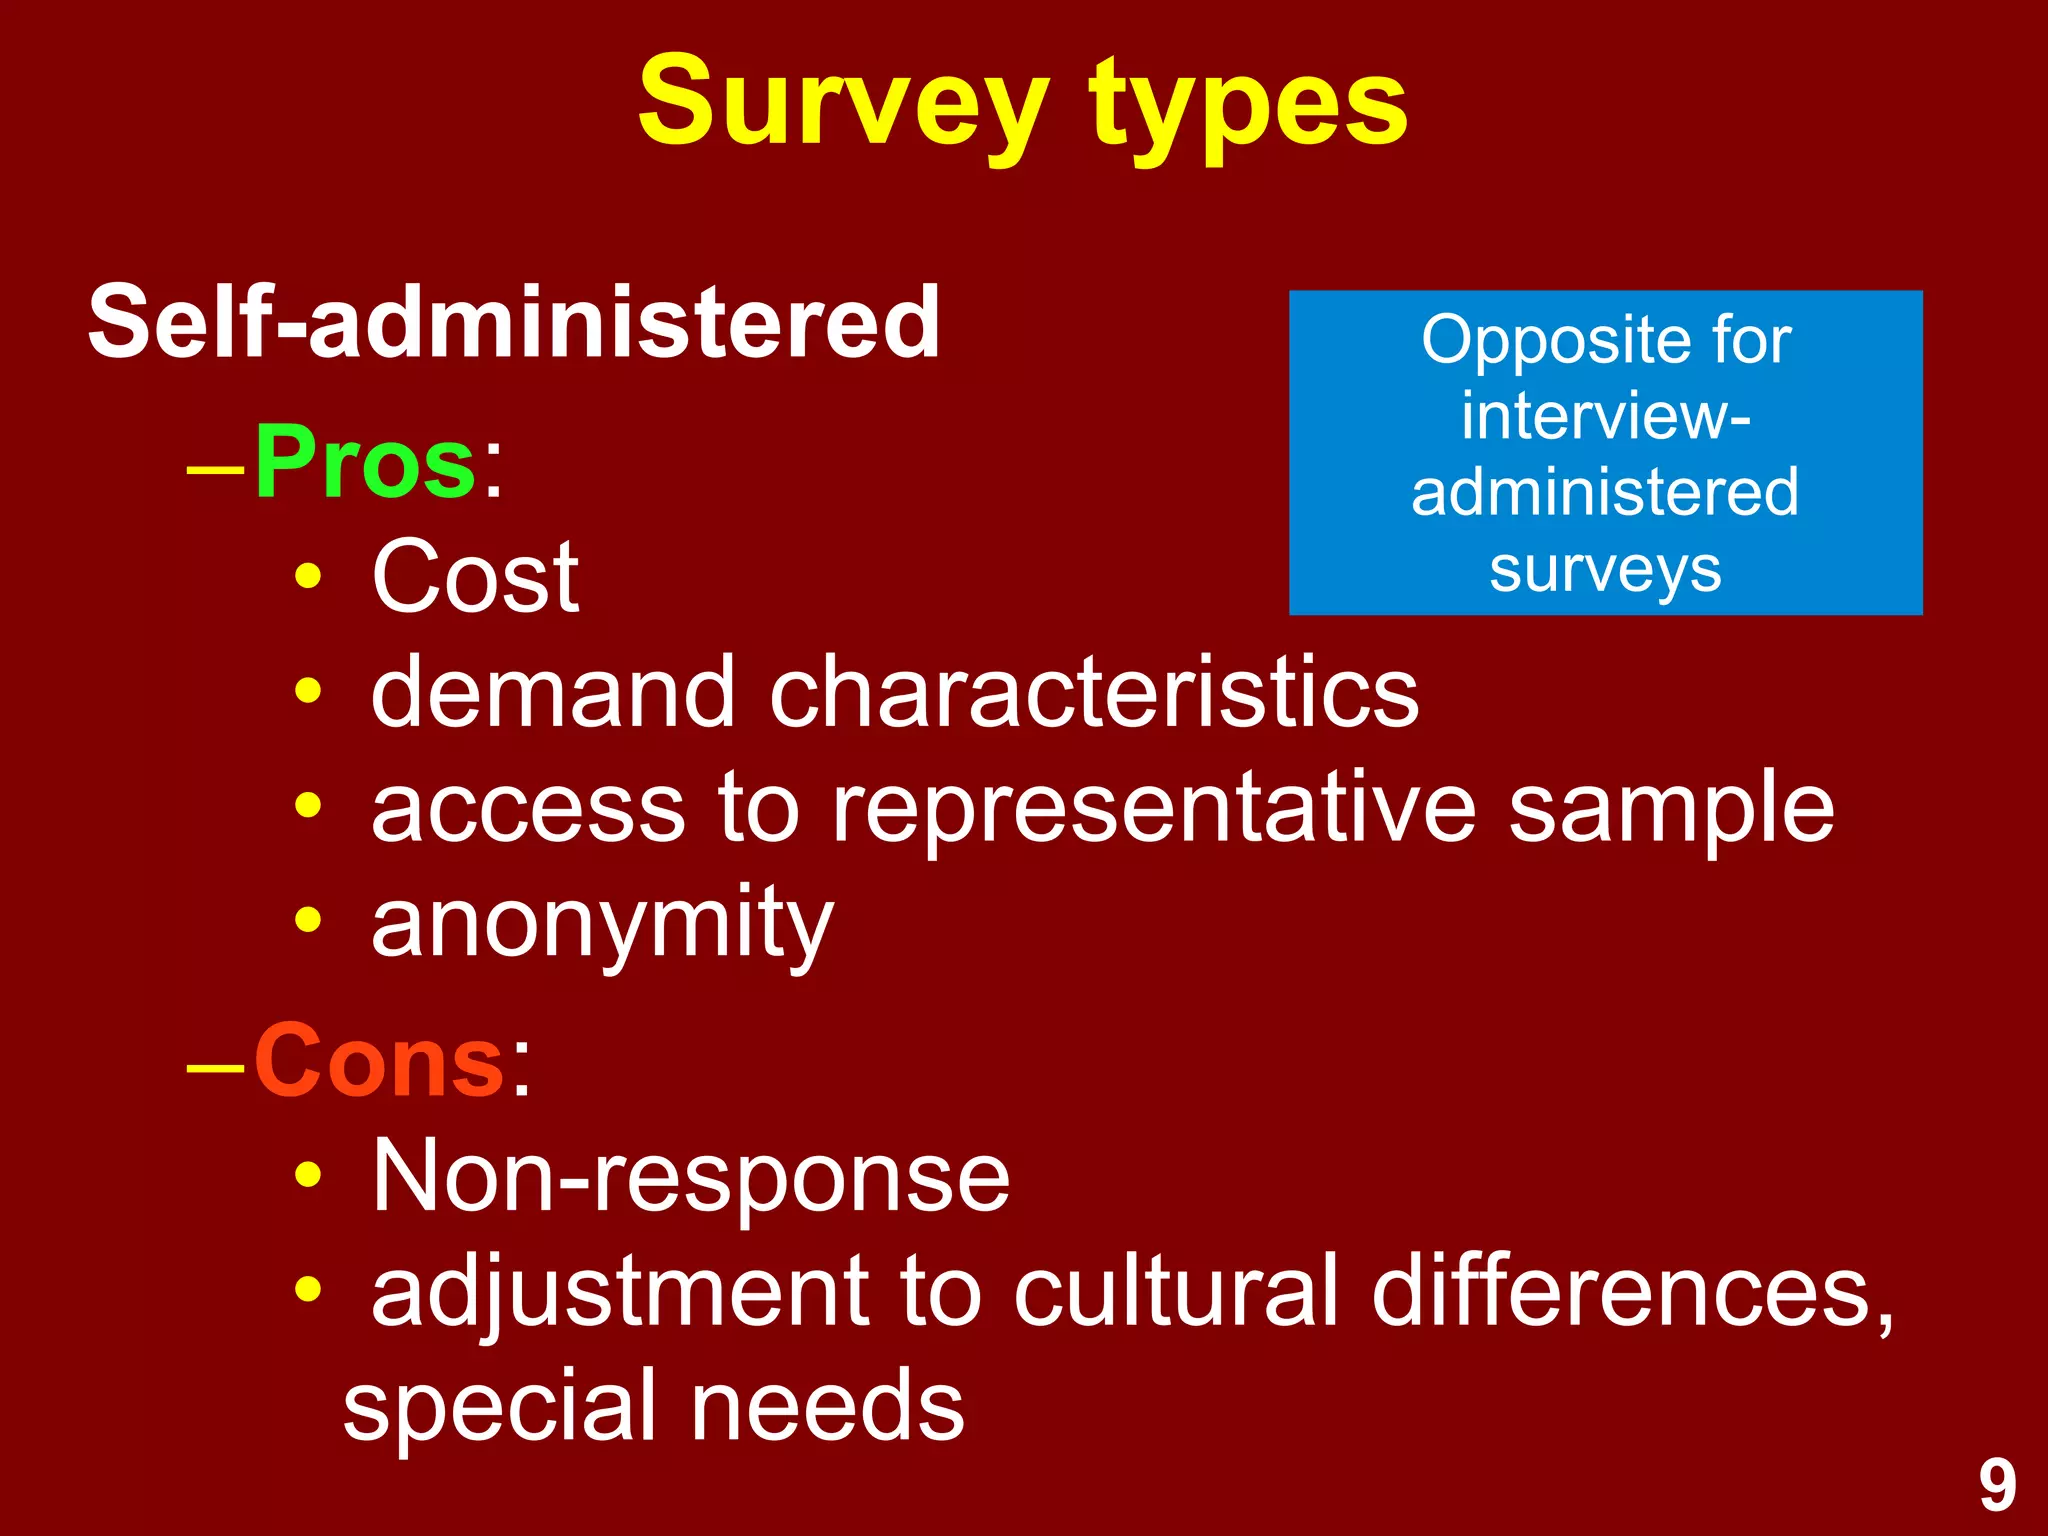
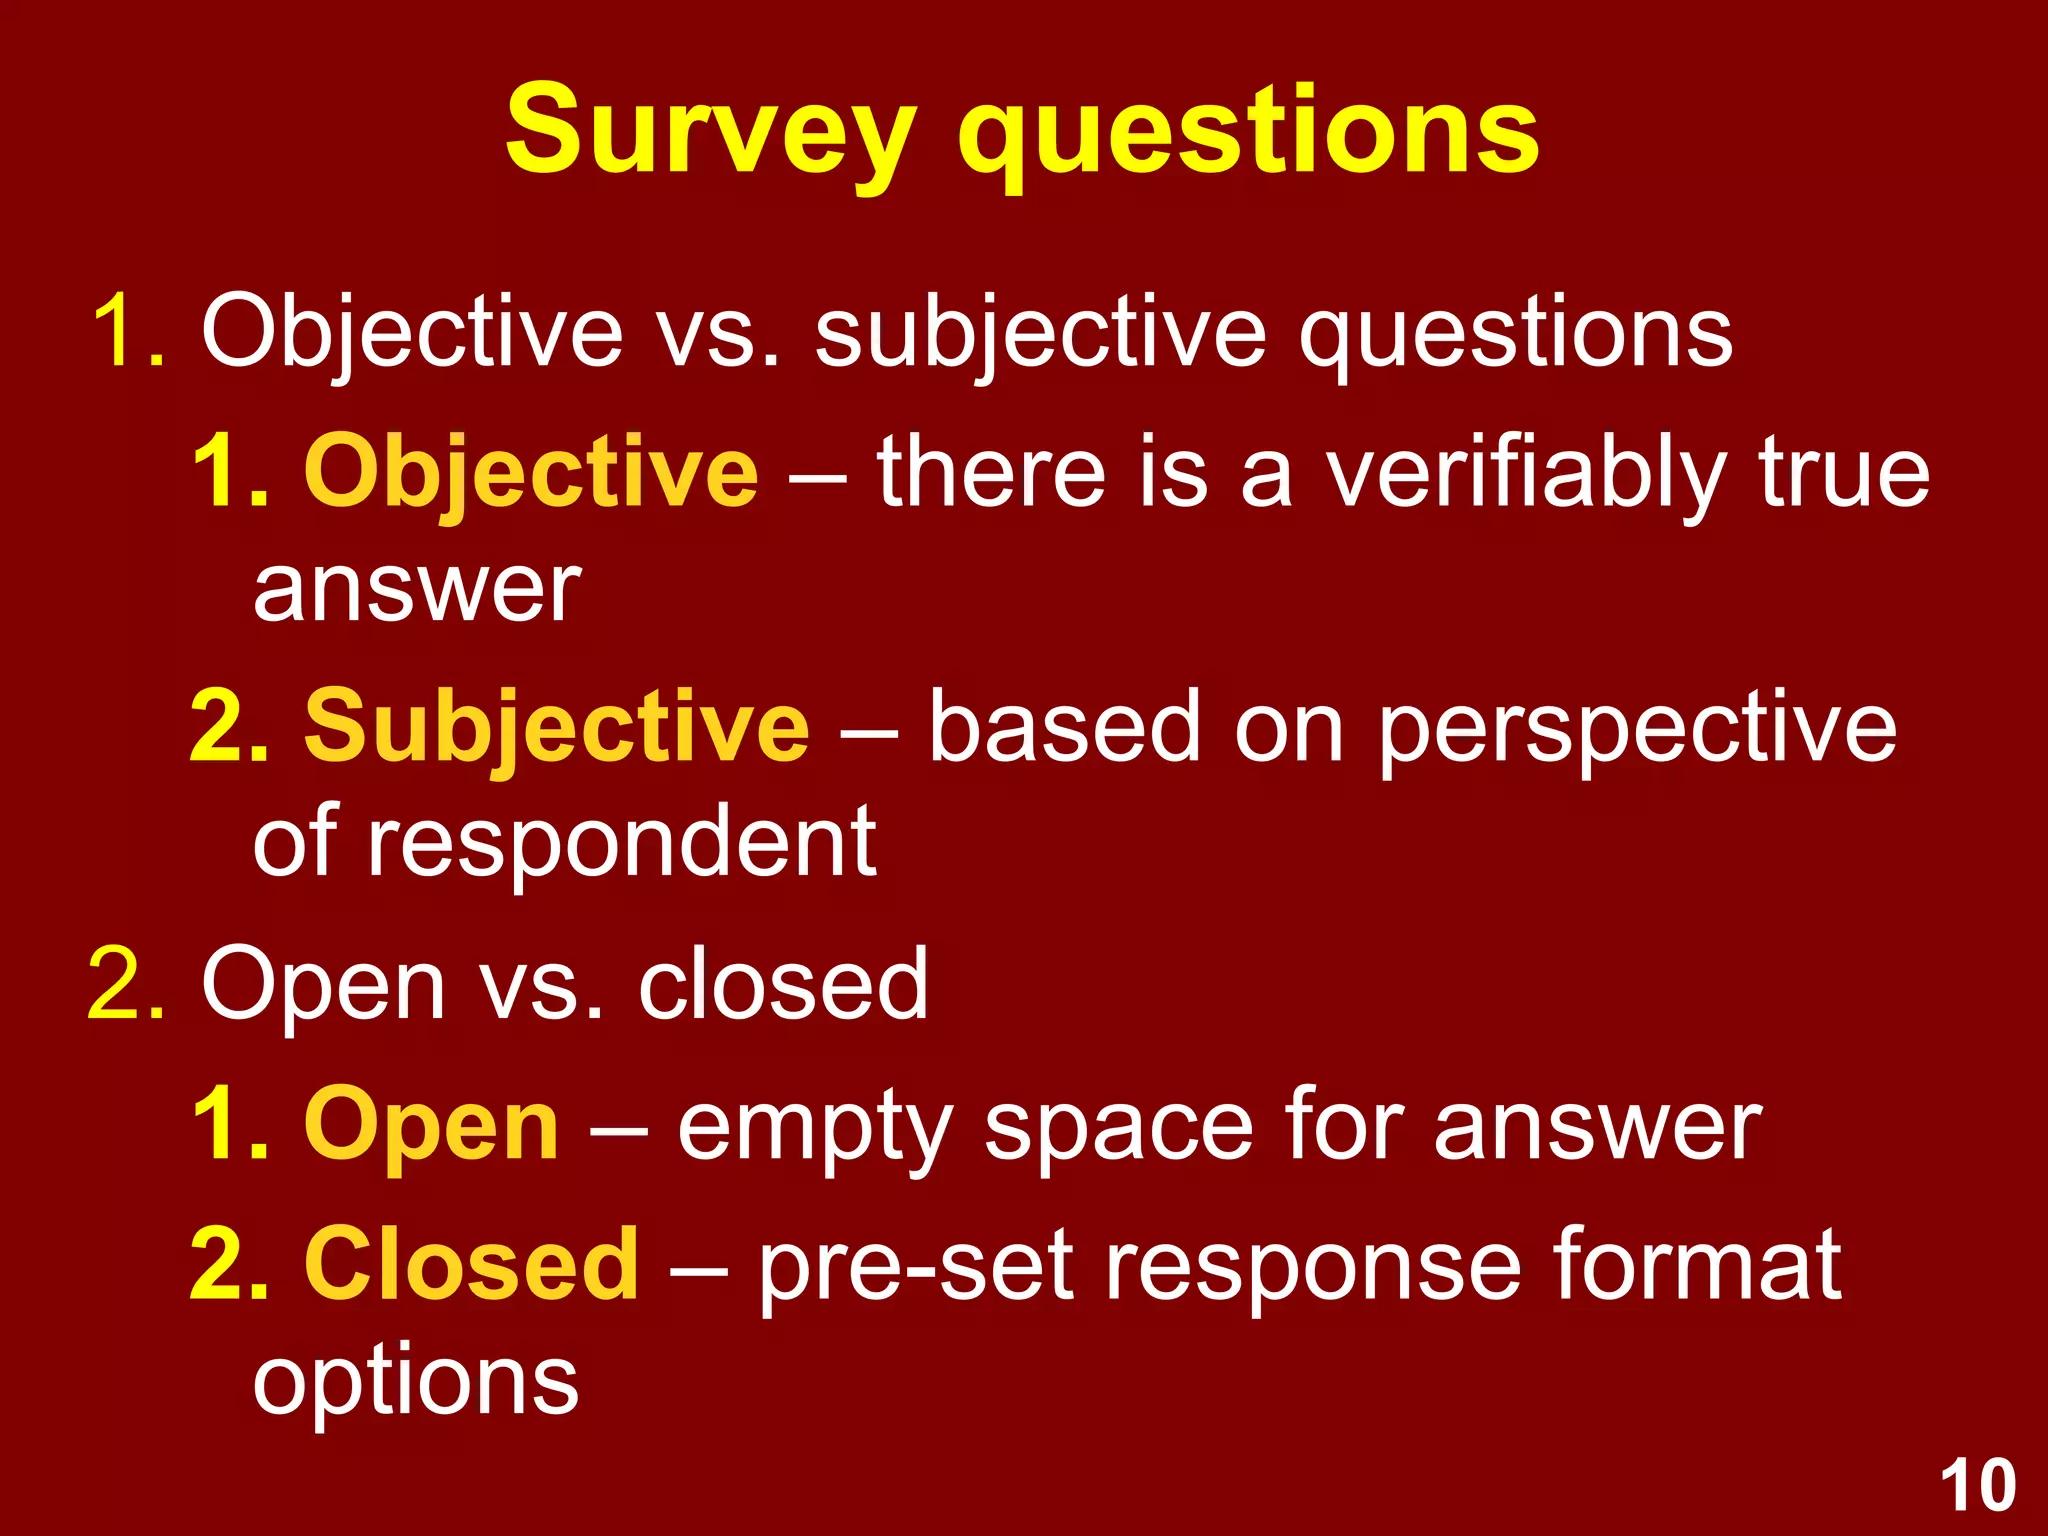
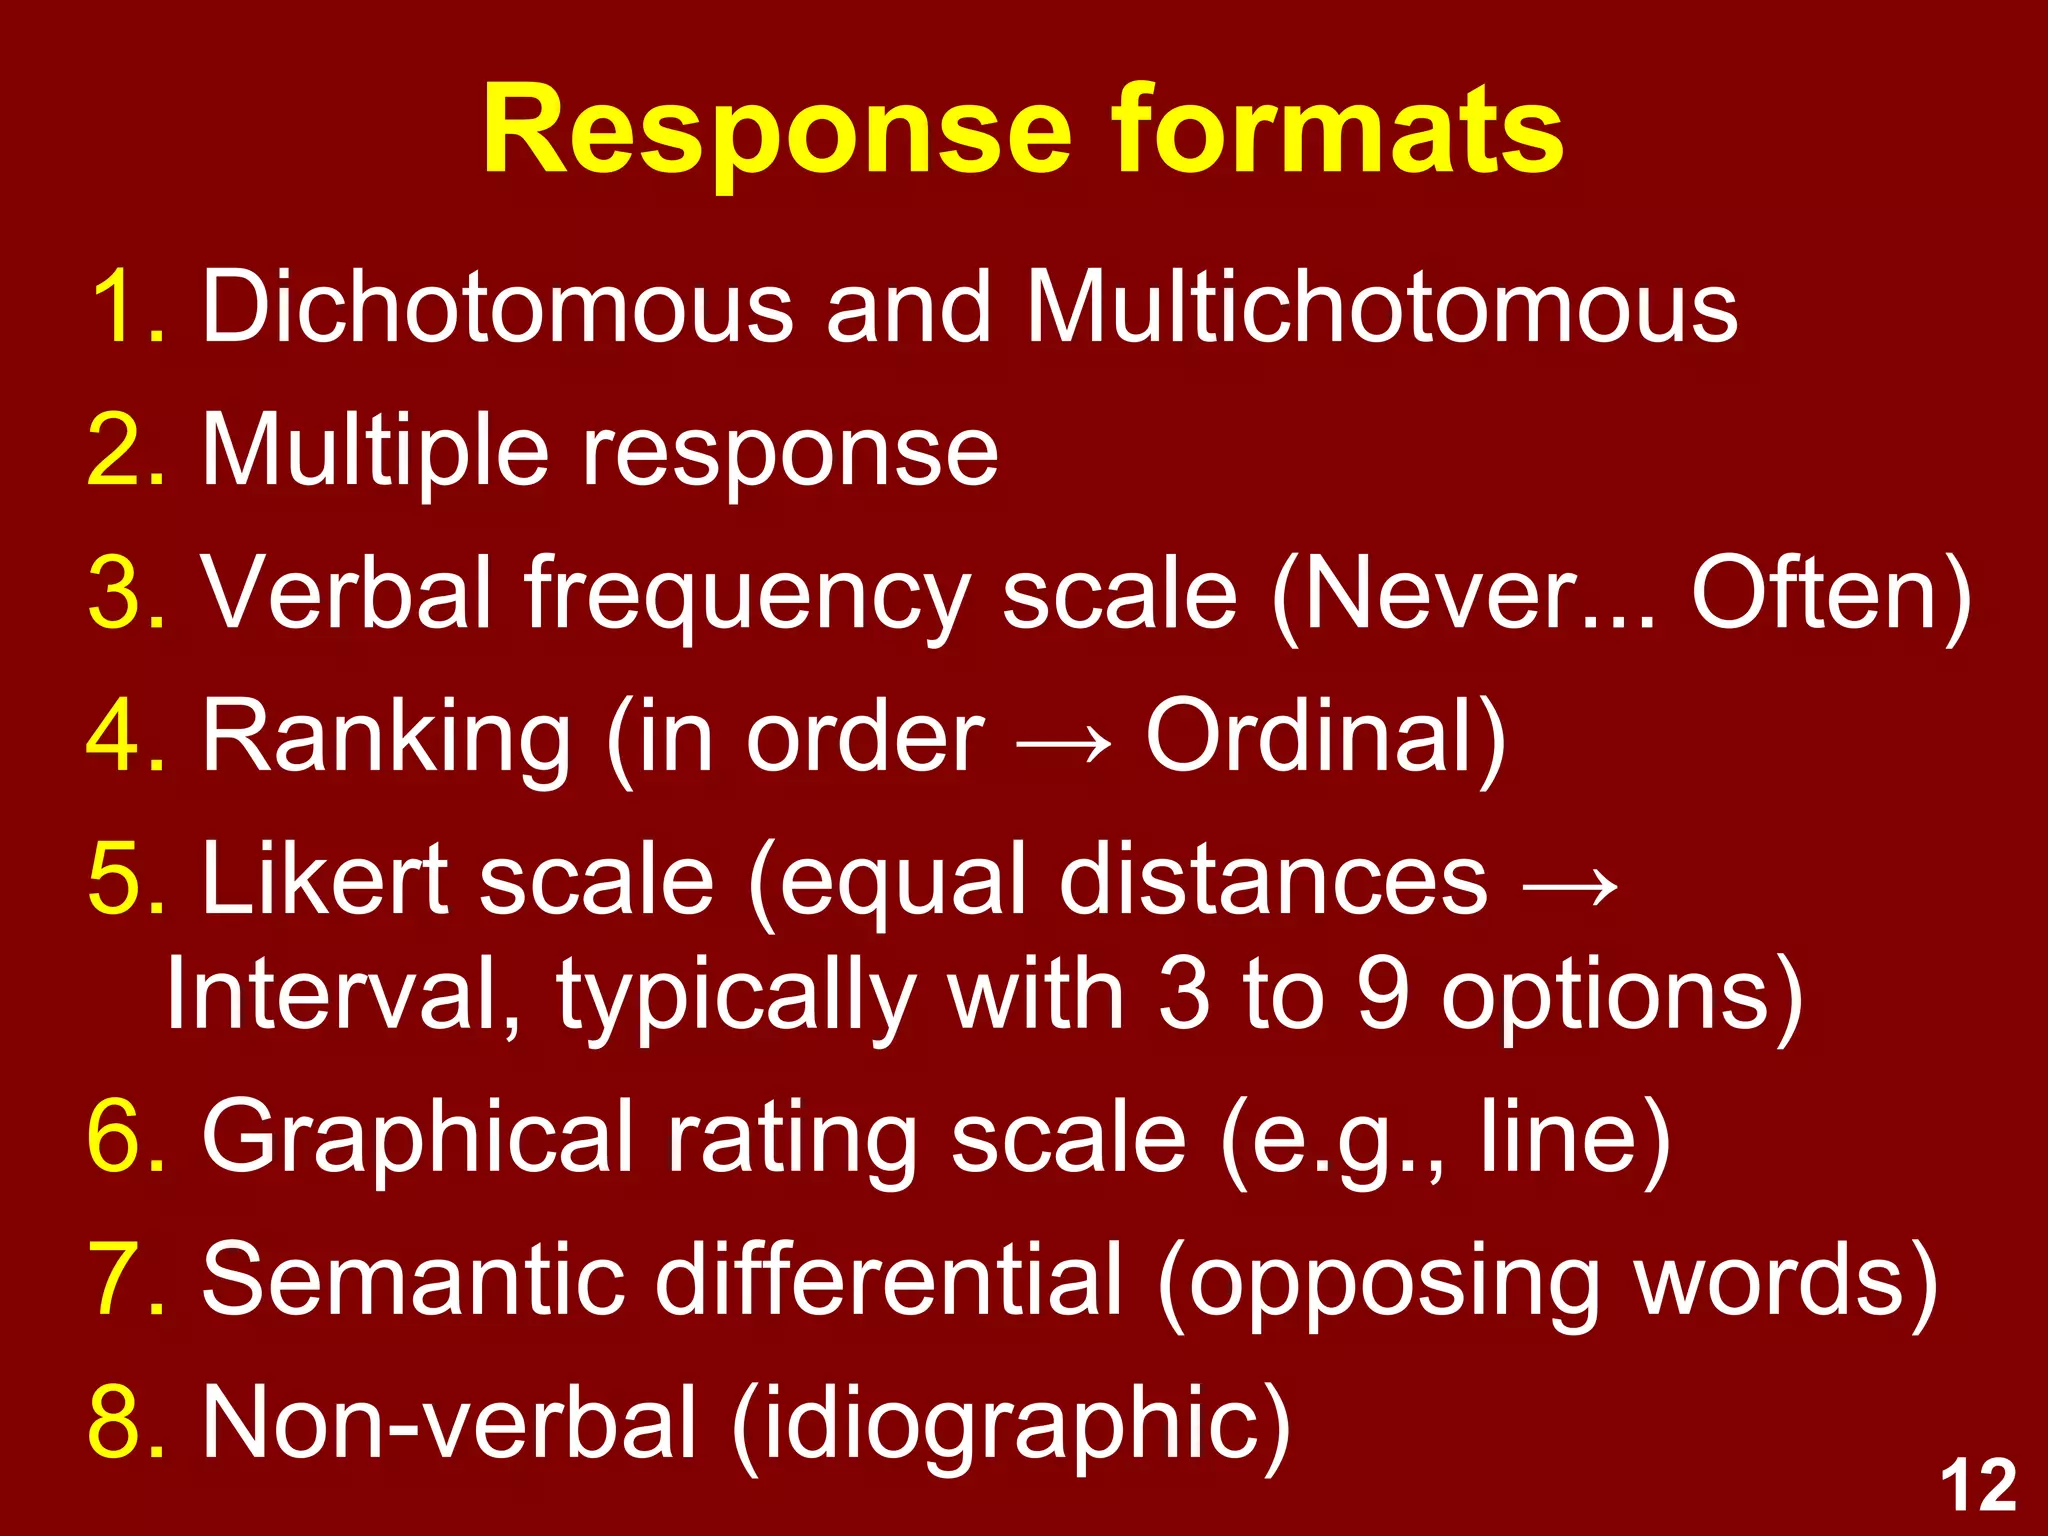
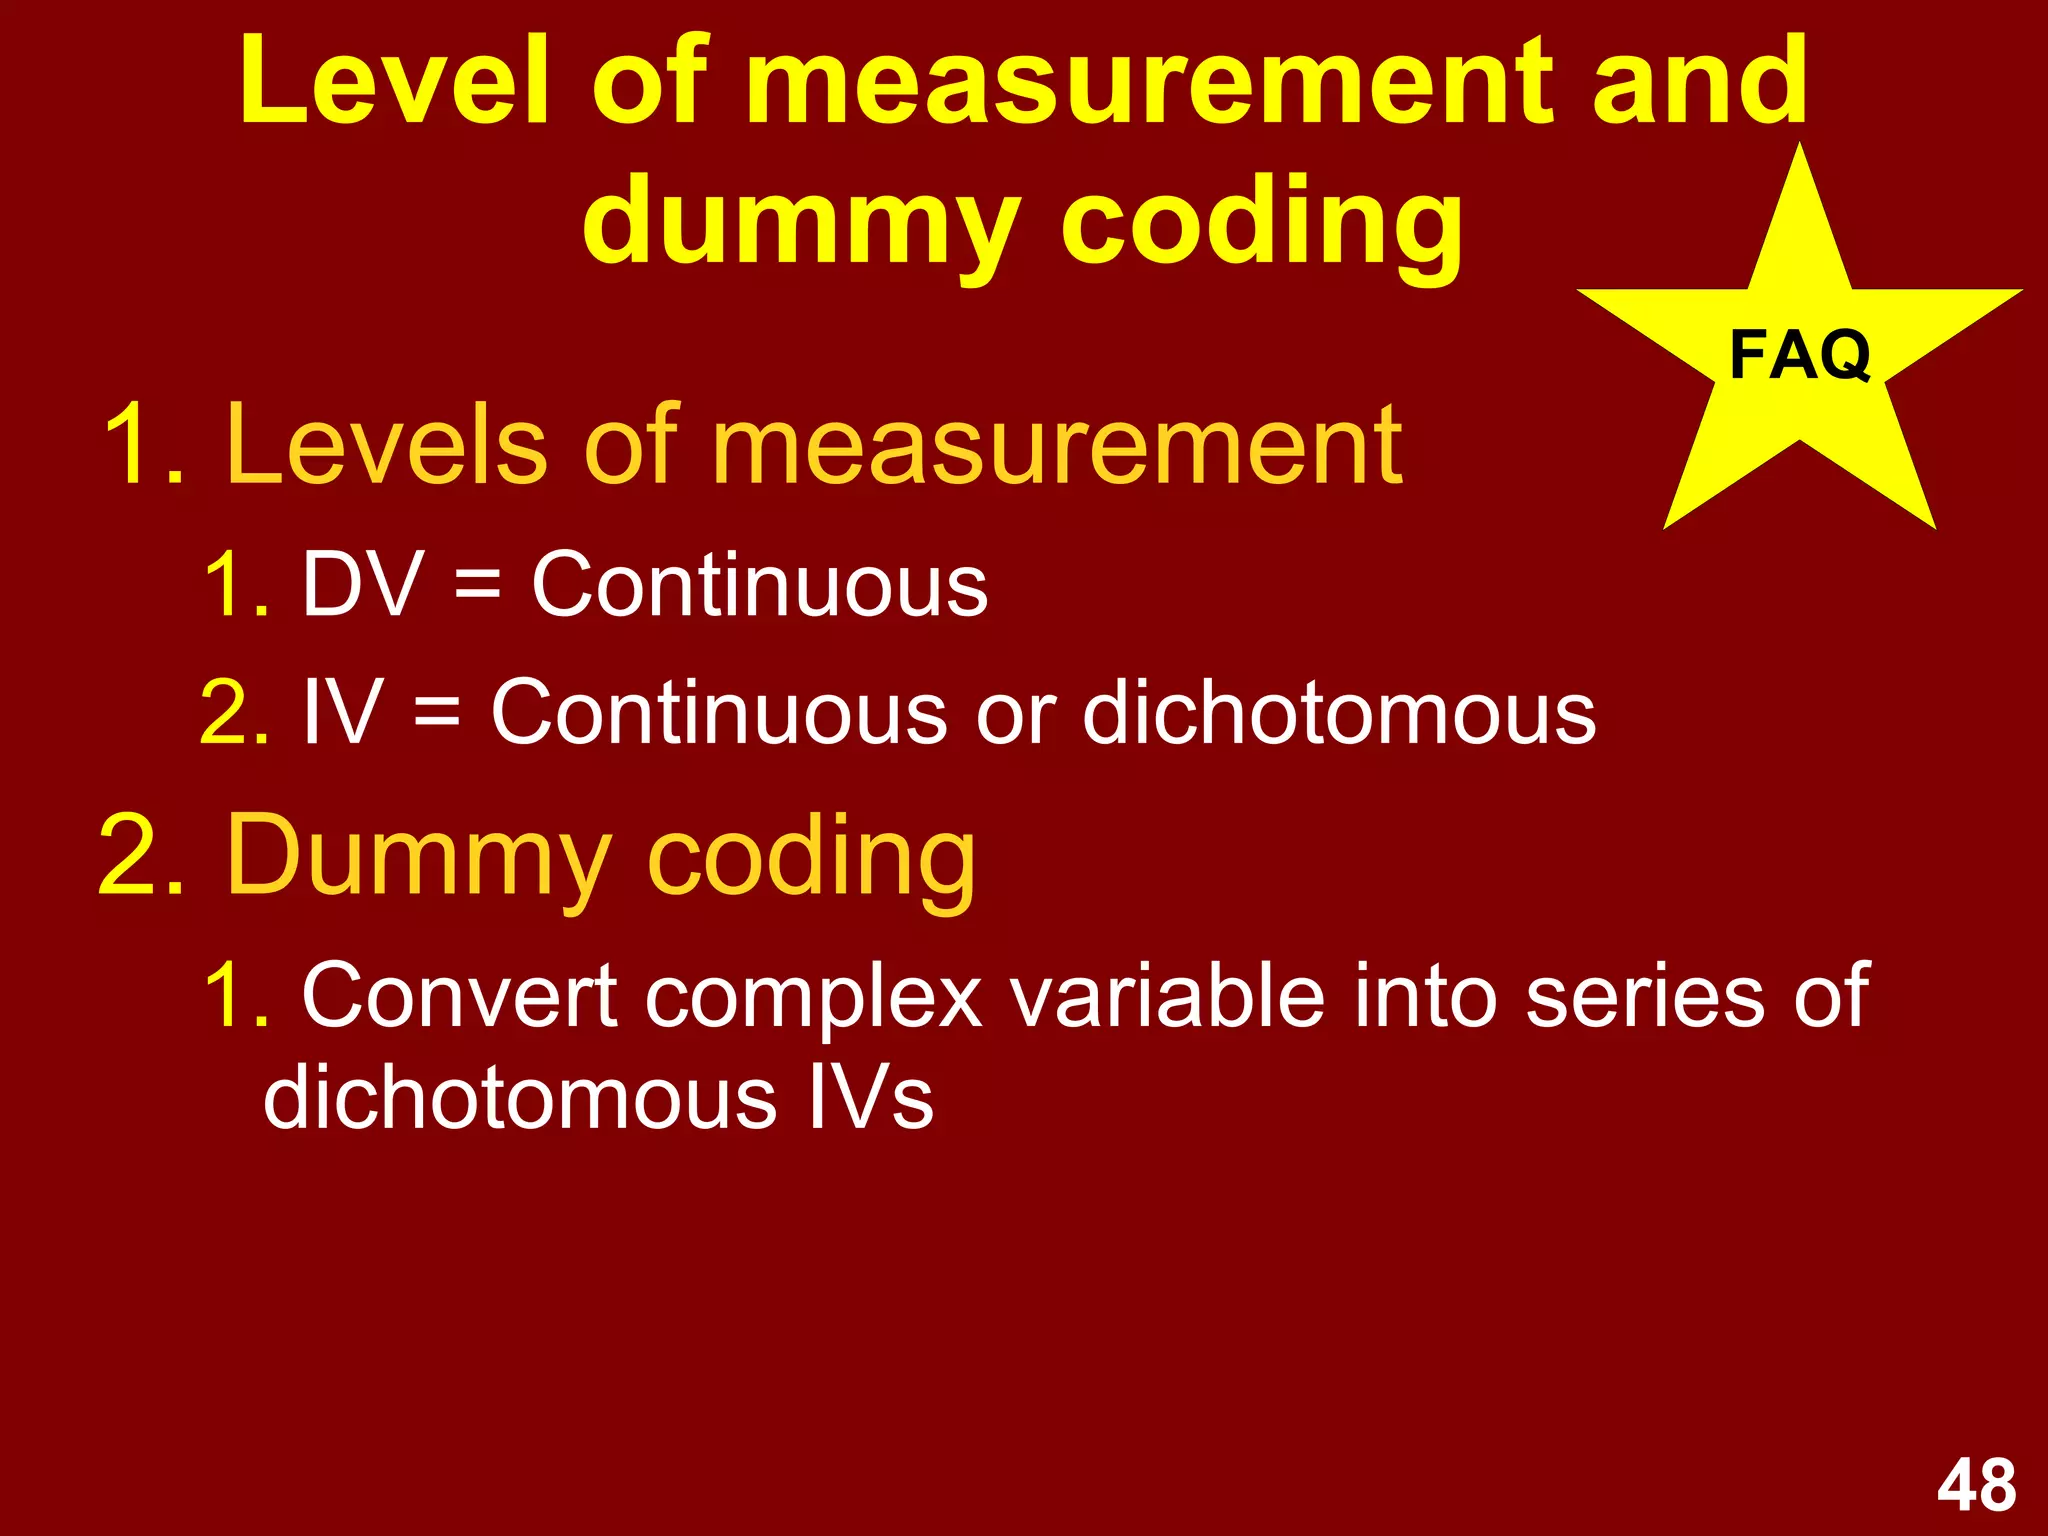
Focus on self-administered survey designs, question types, response formats, and levels of measurement.
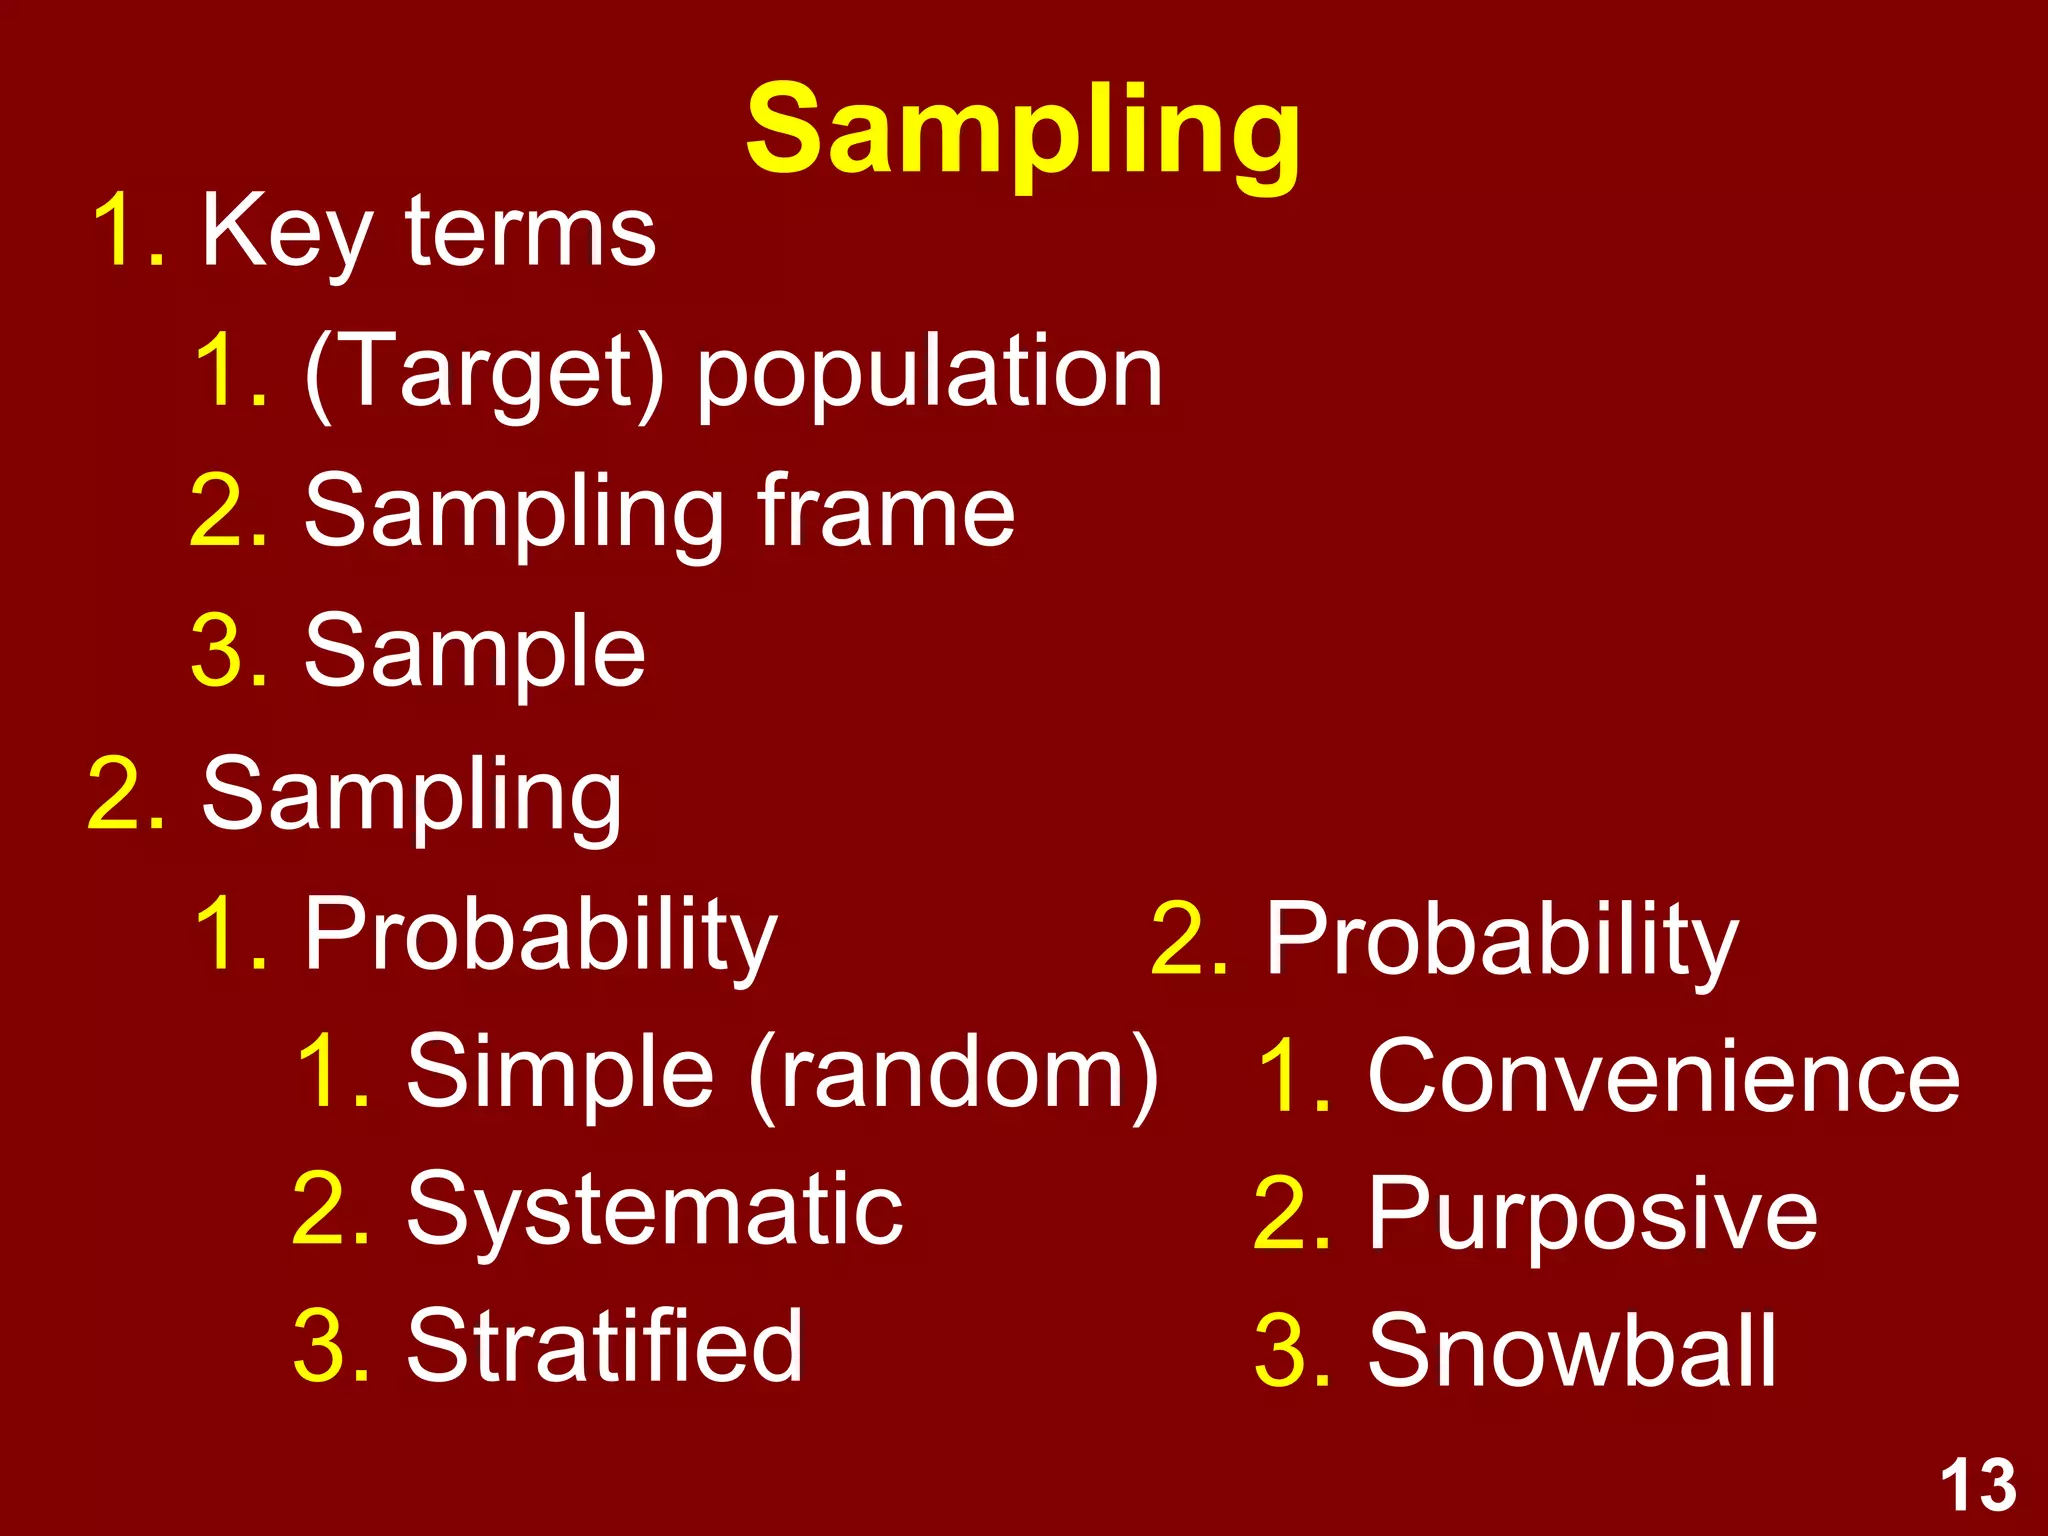
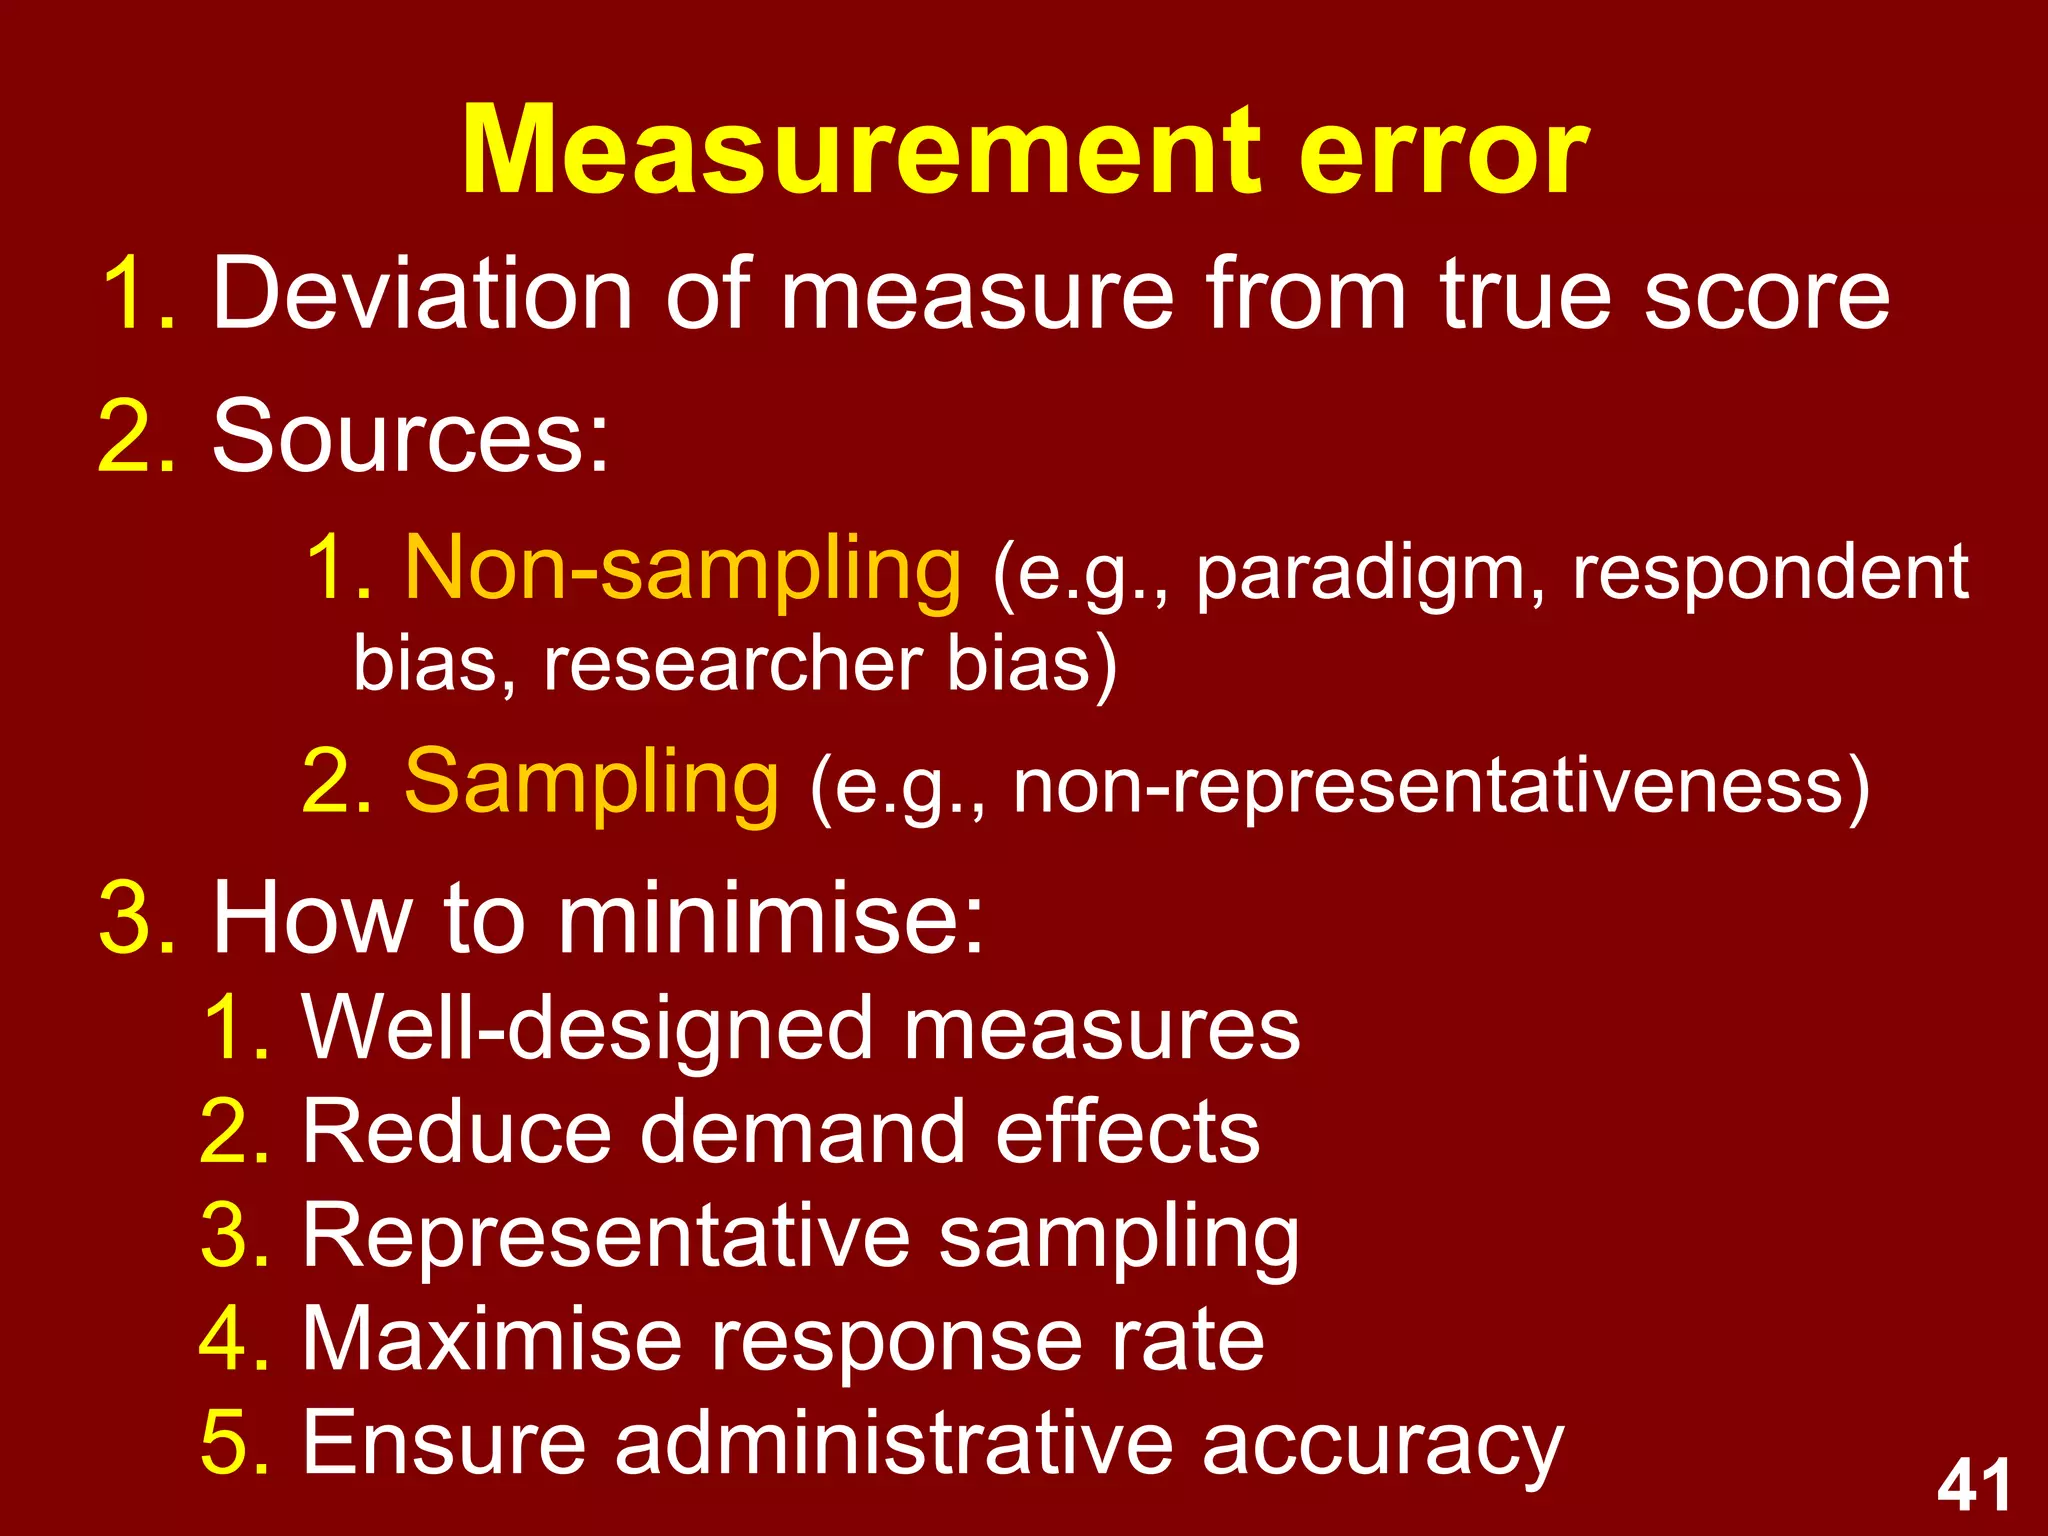
Explains sampling methods, key terms, and identifies non-sampling biases impacting survey accuracy.
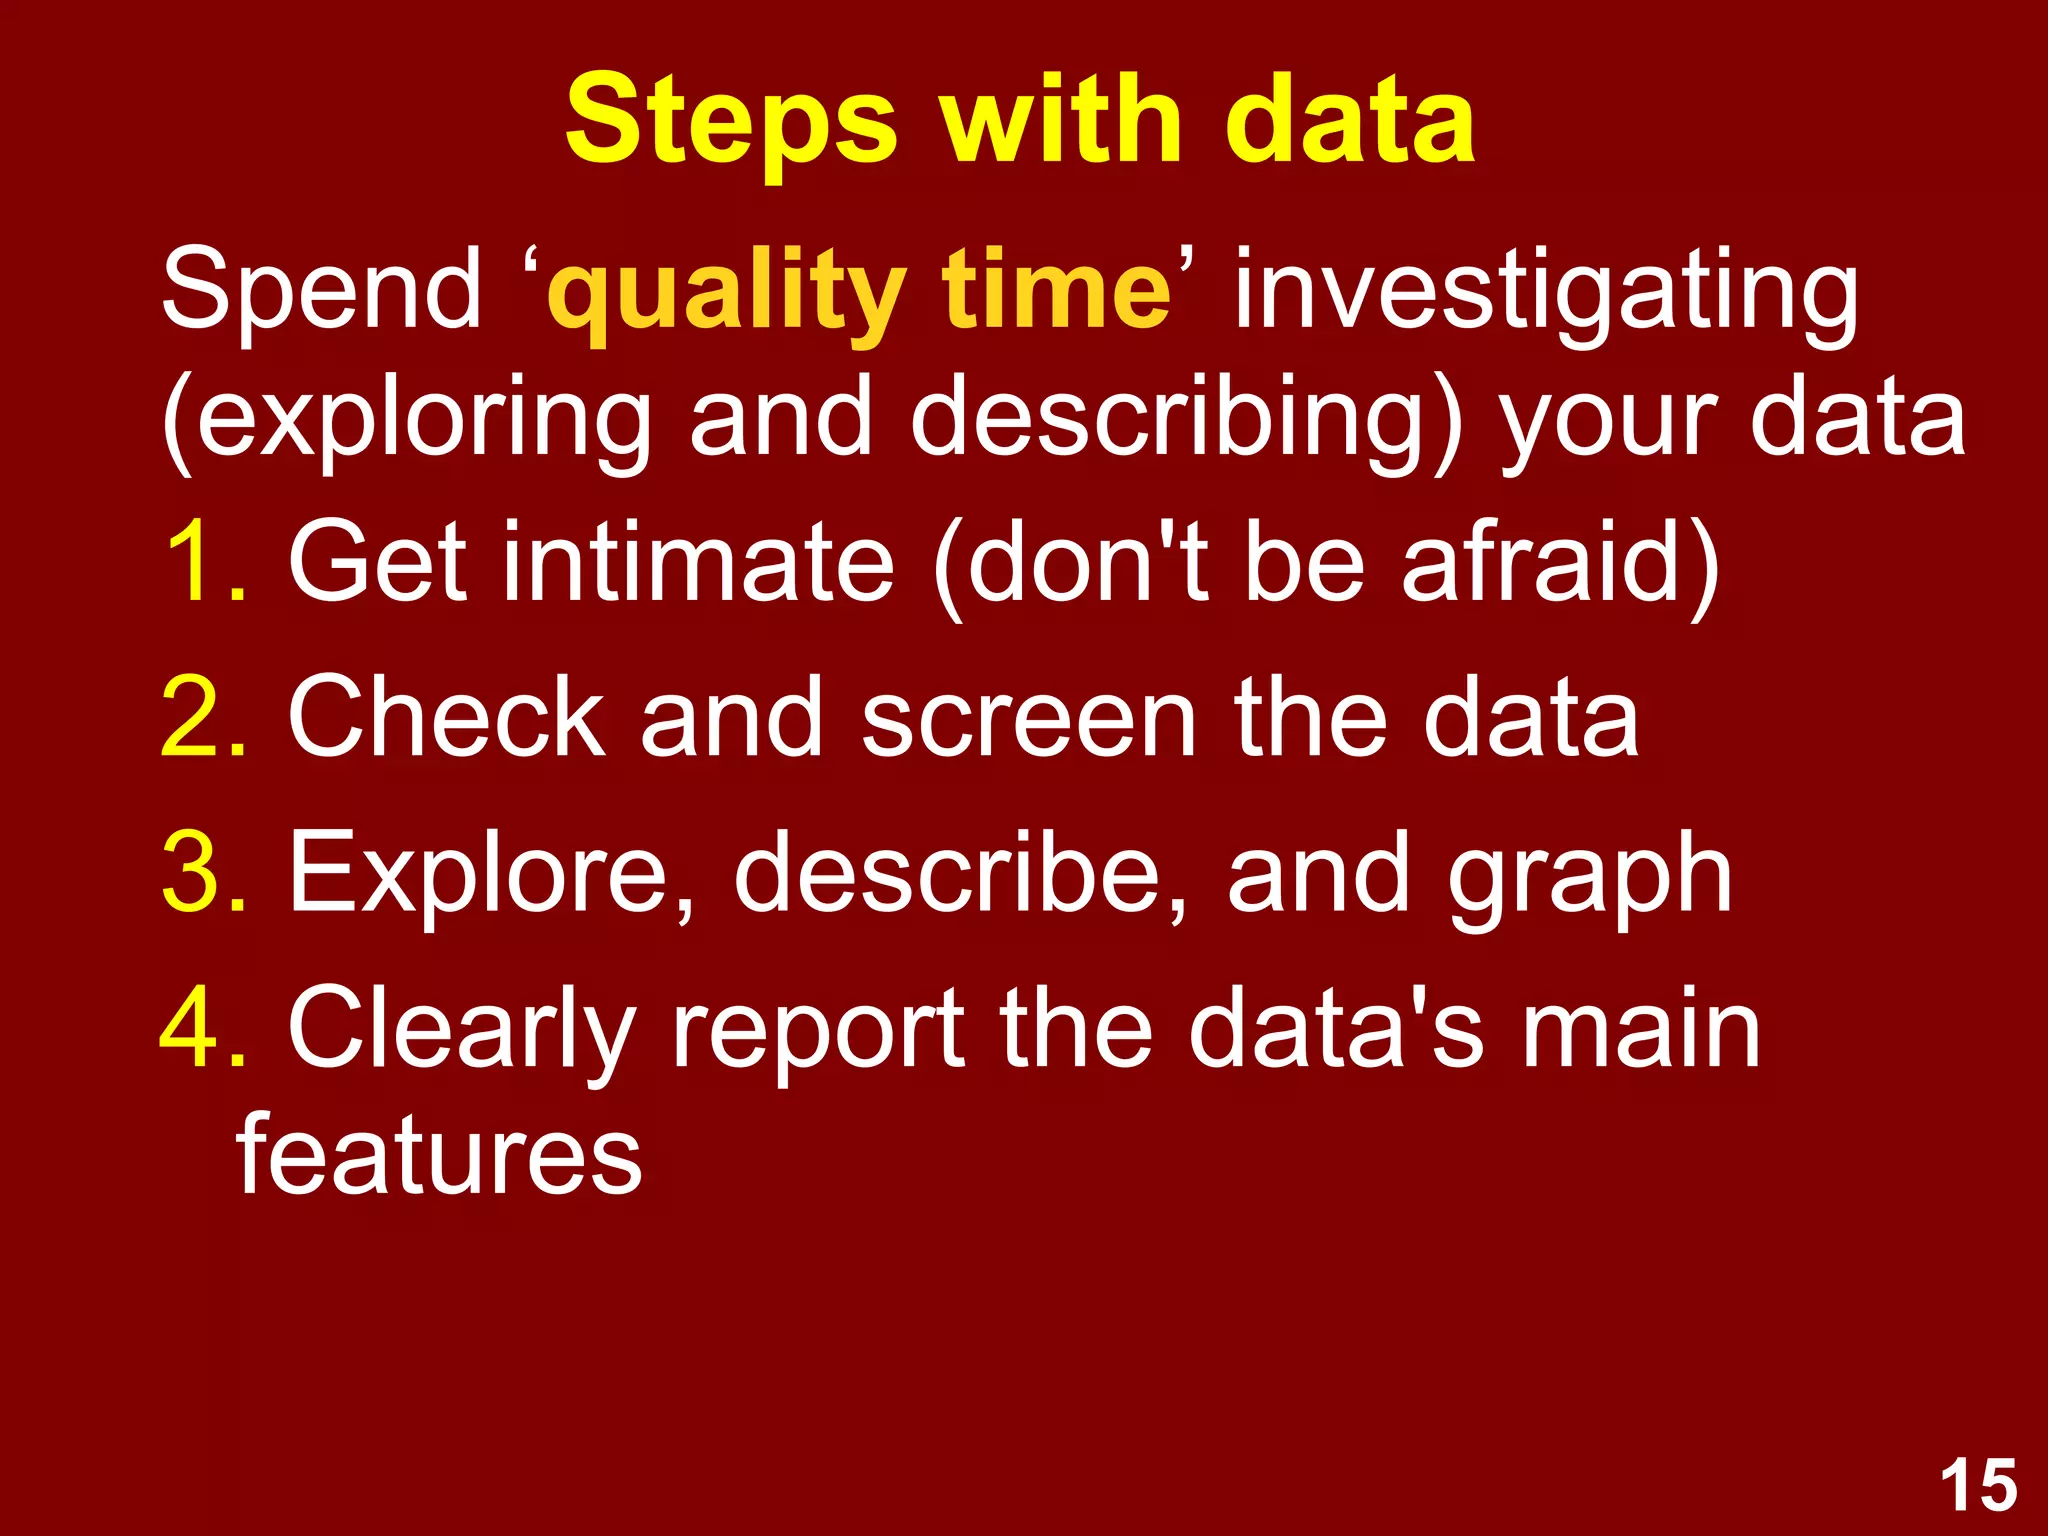
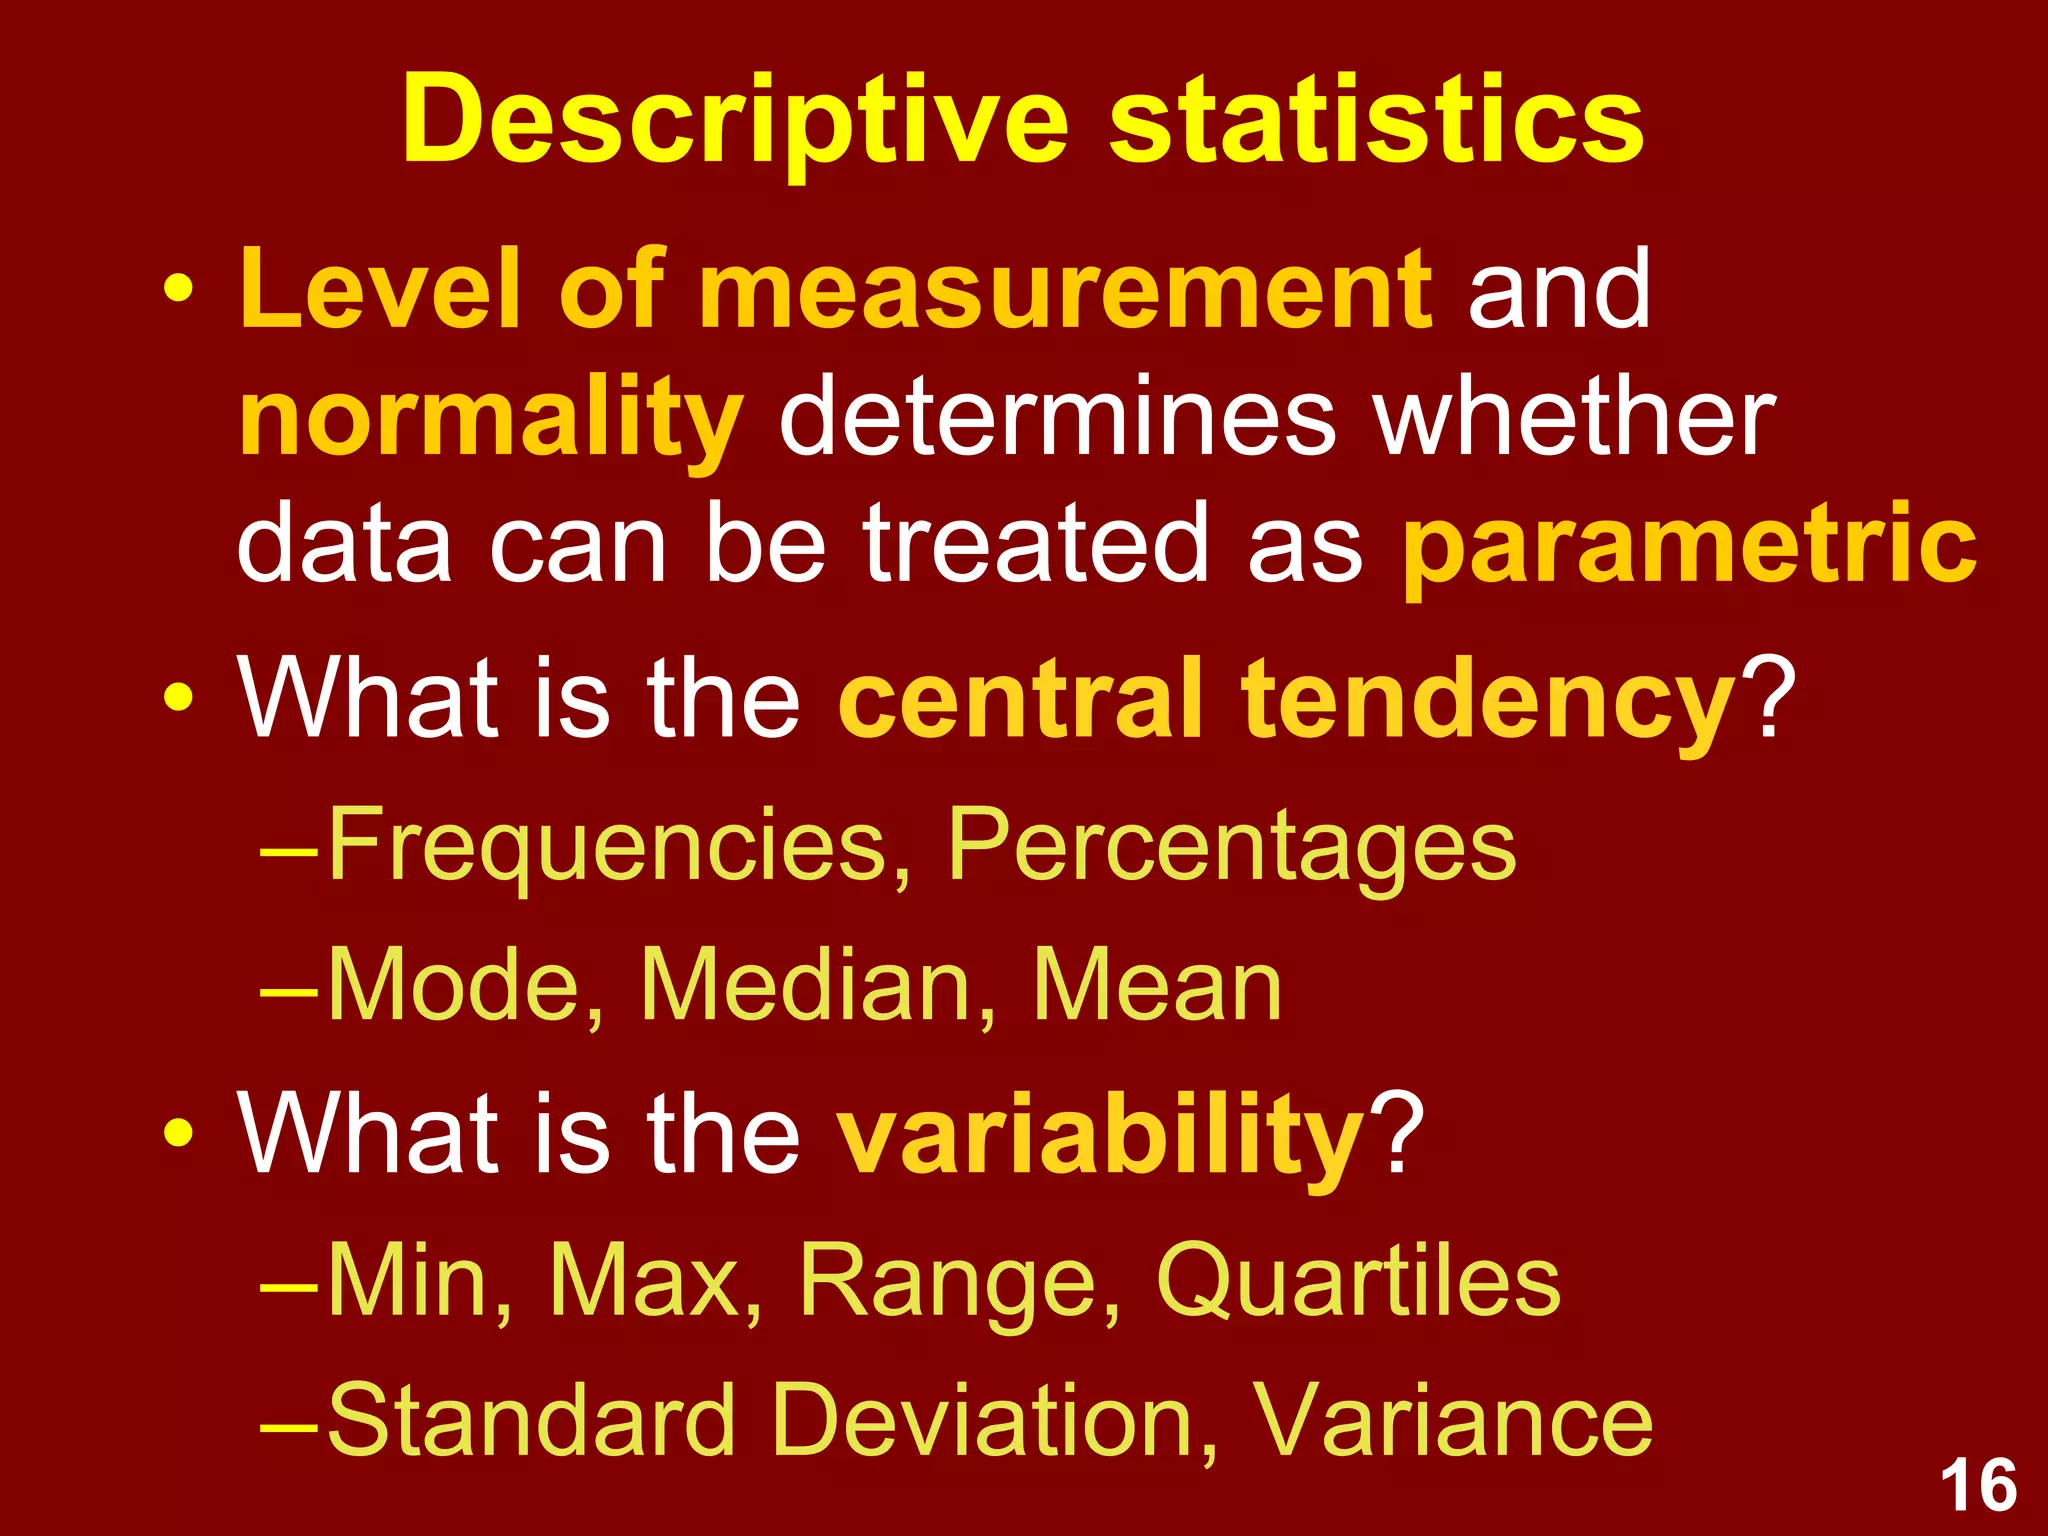
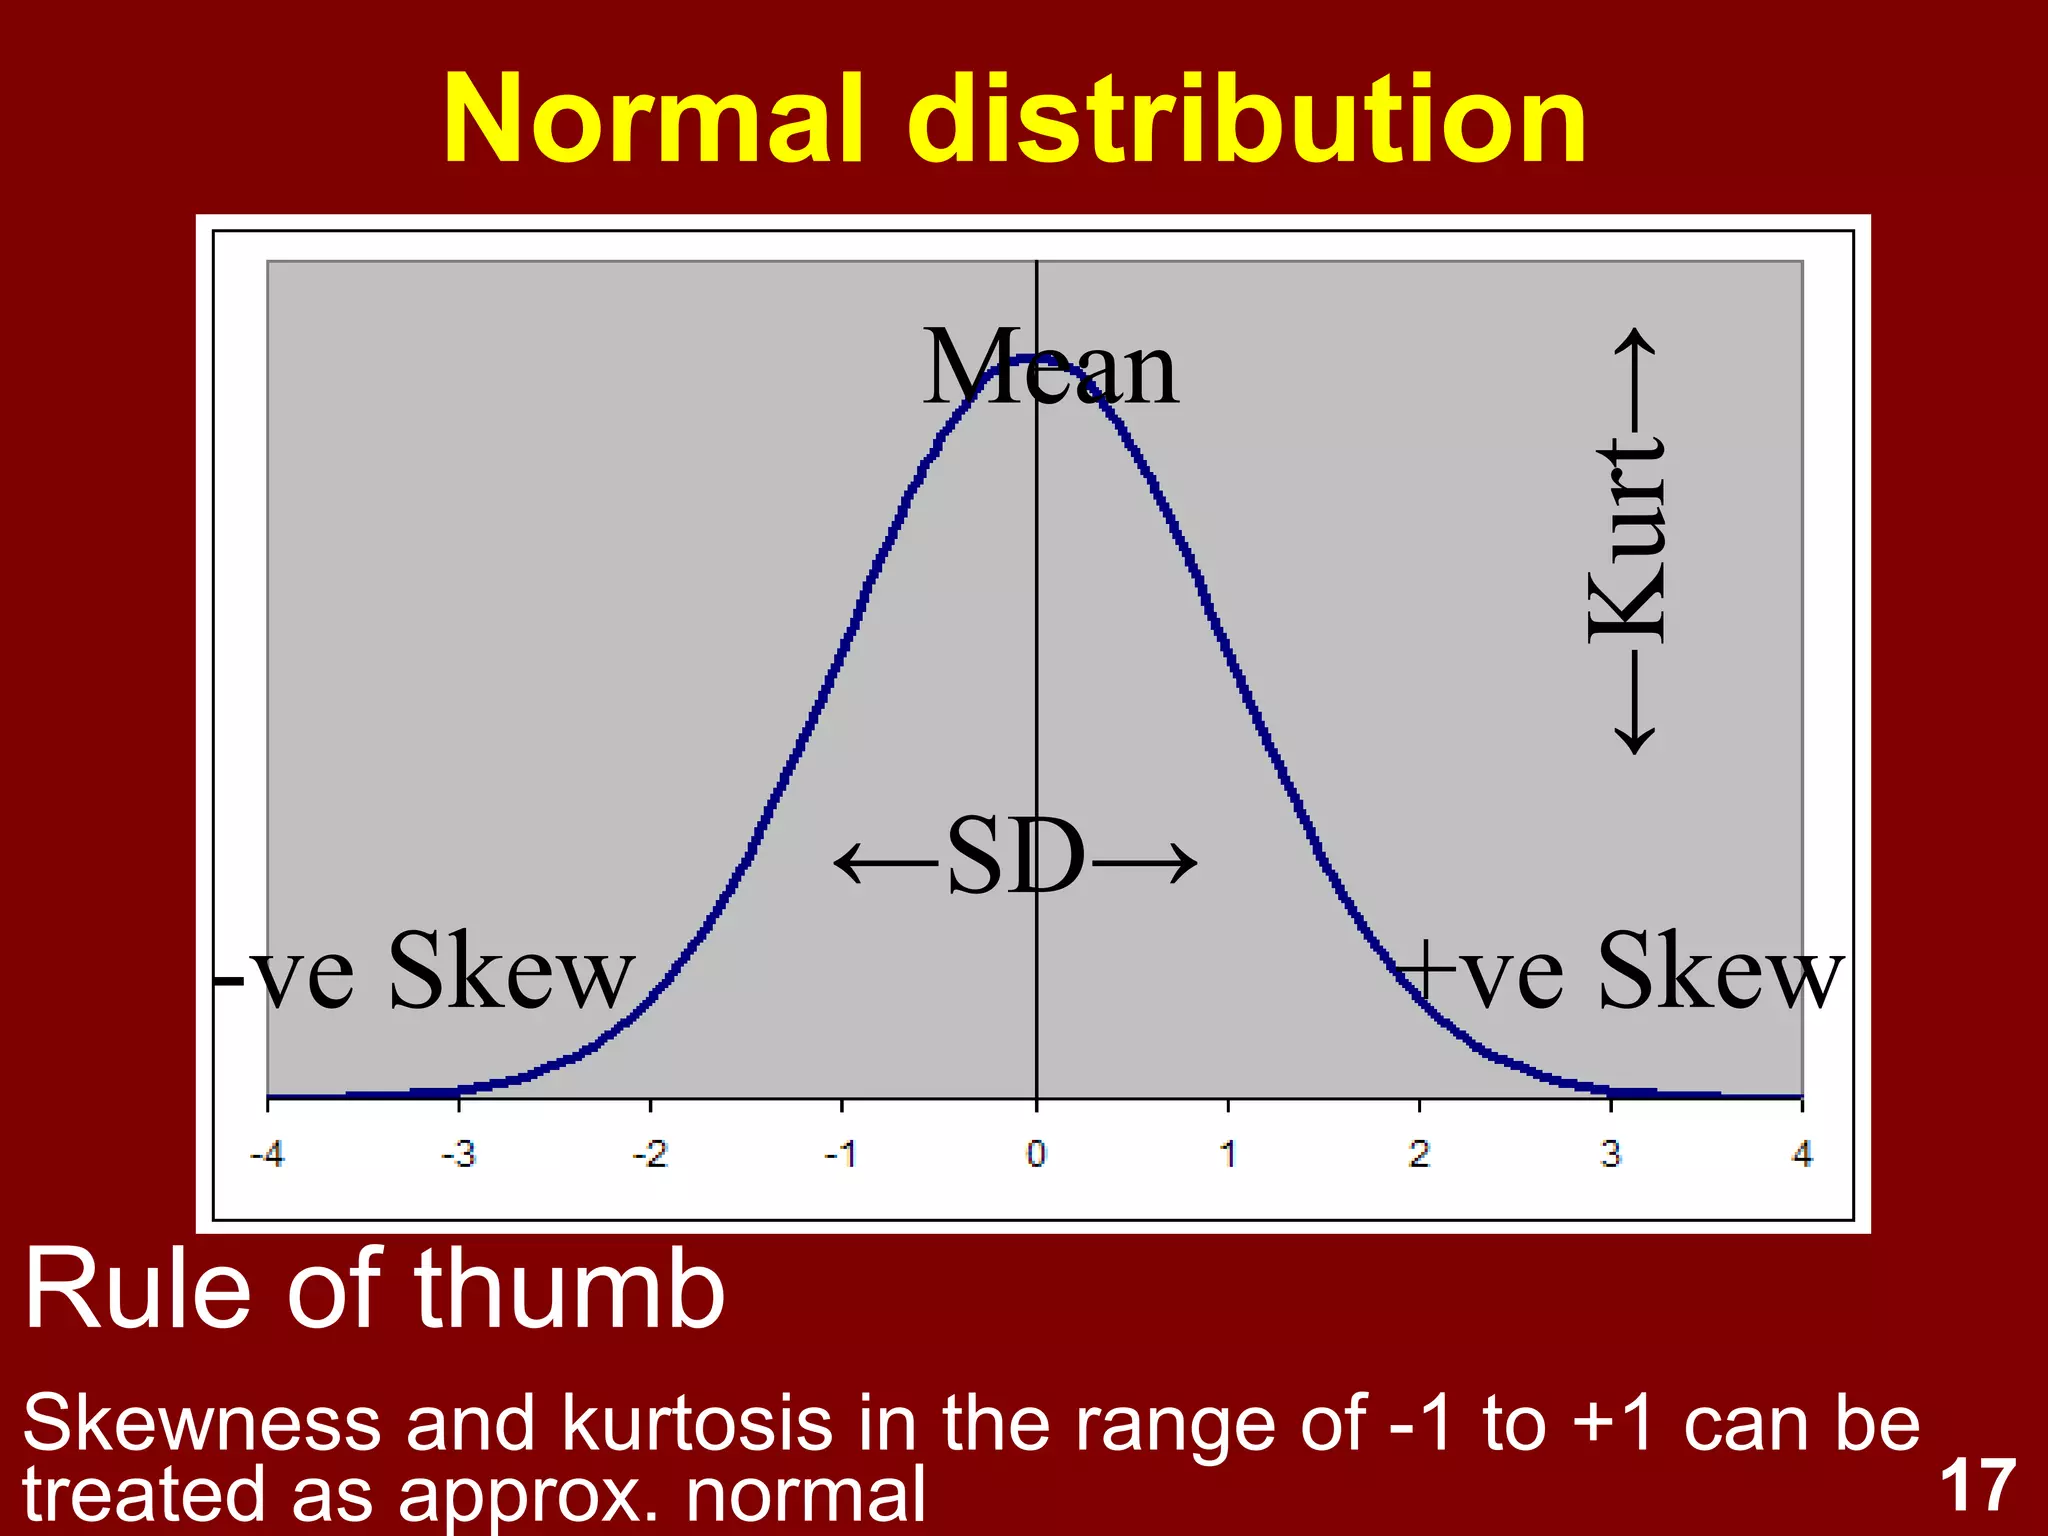
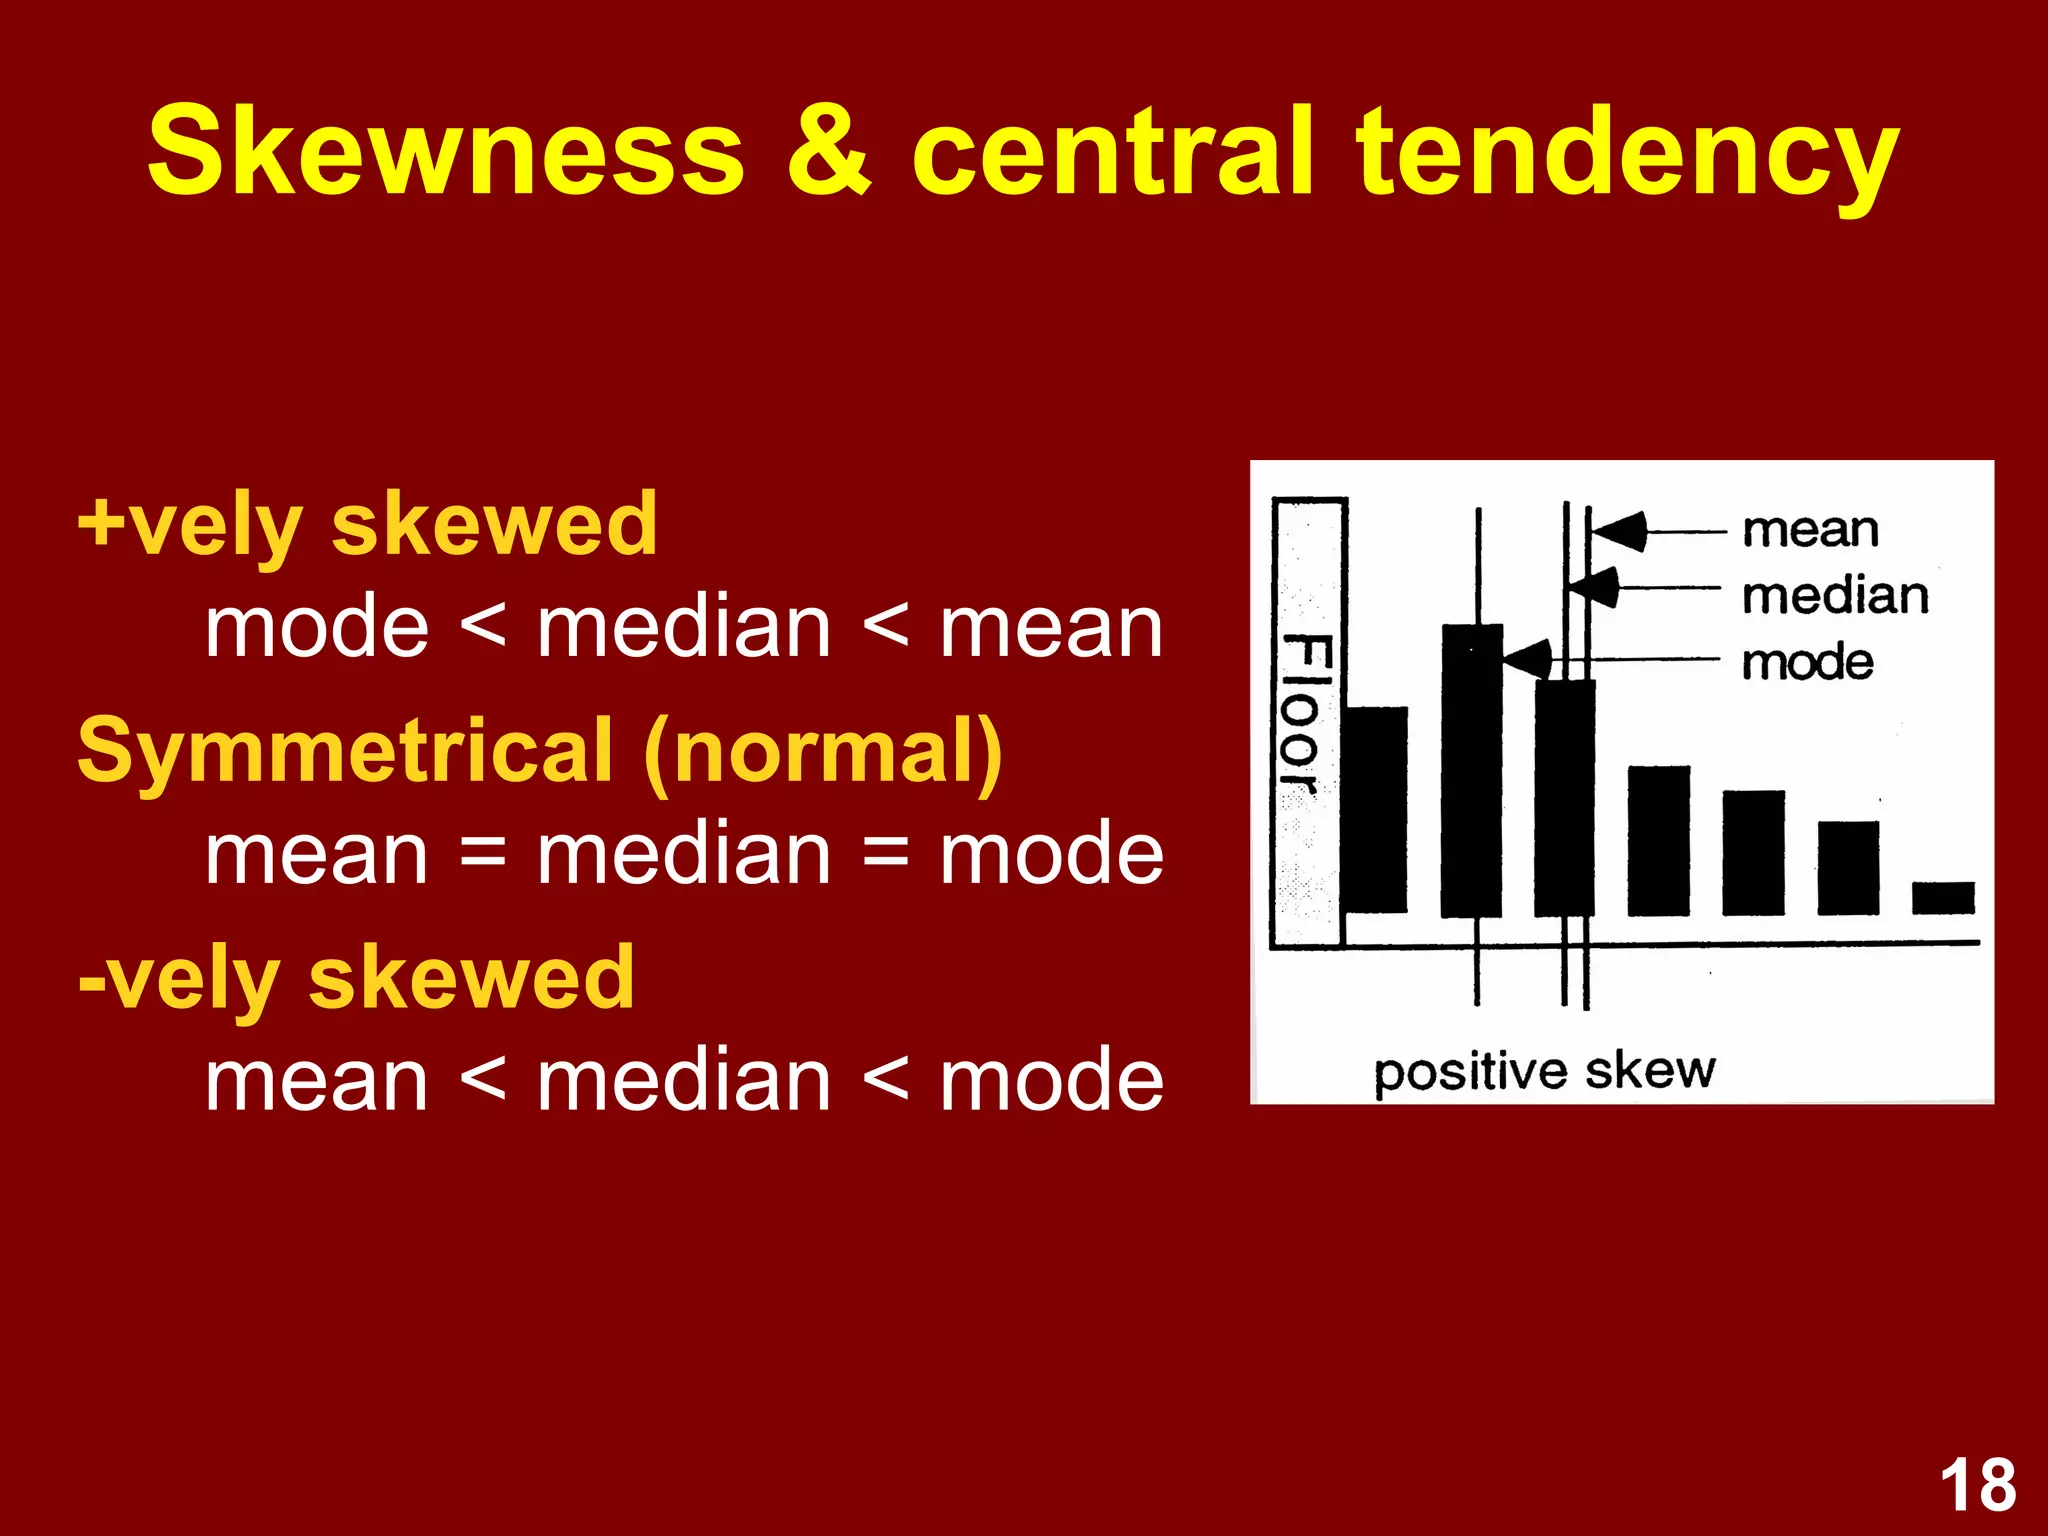
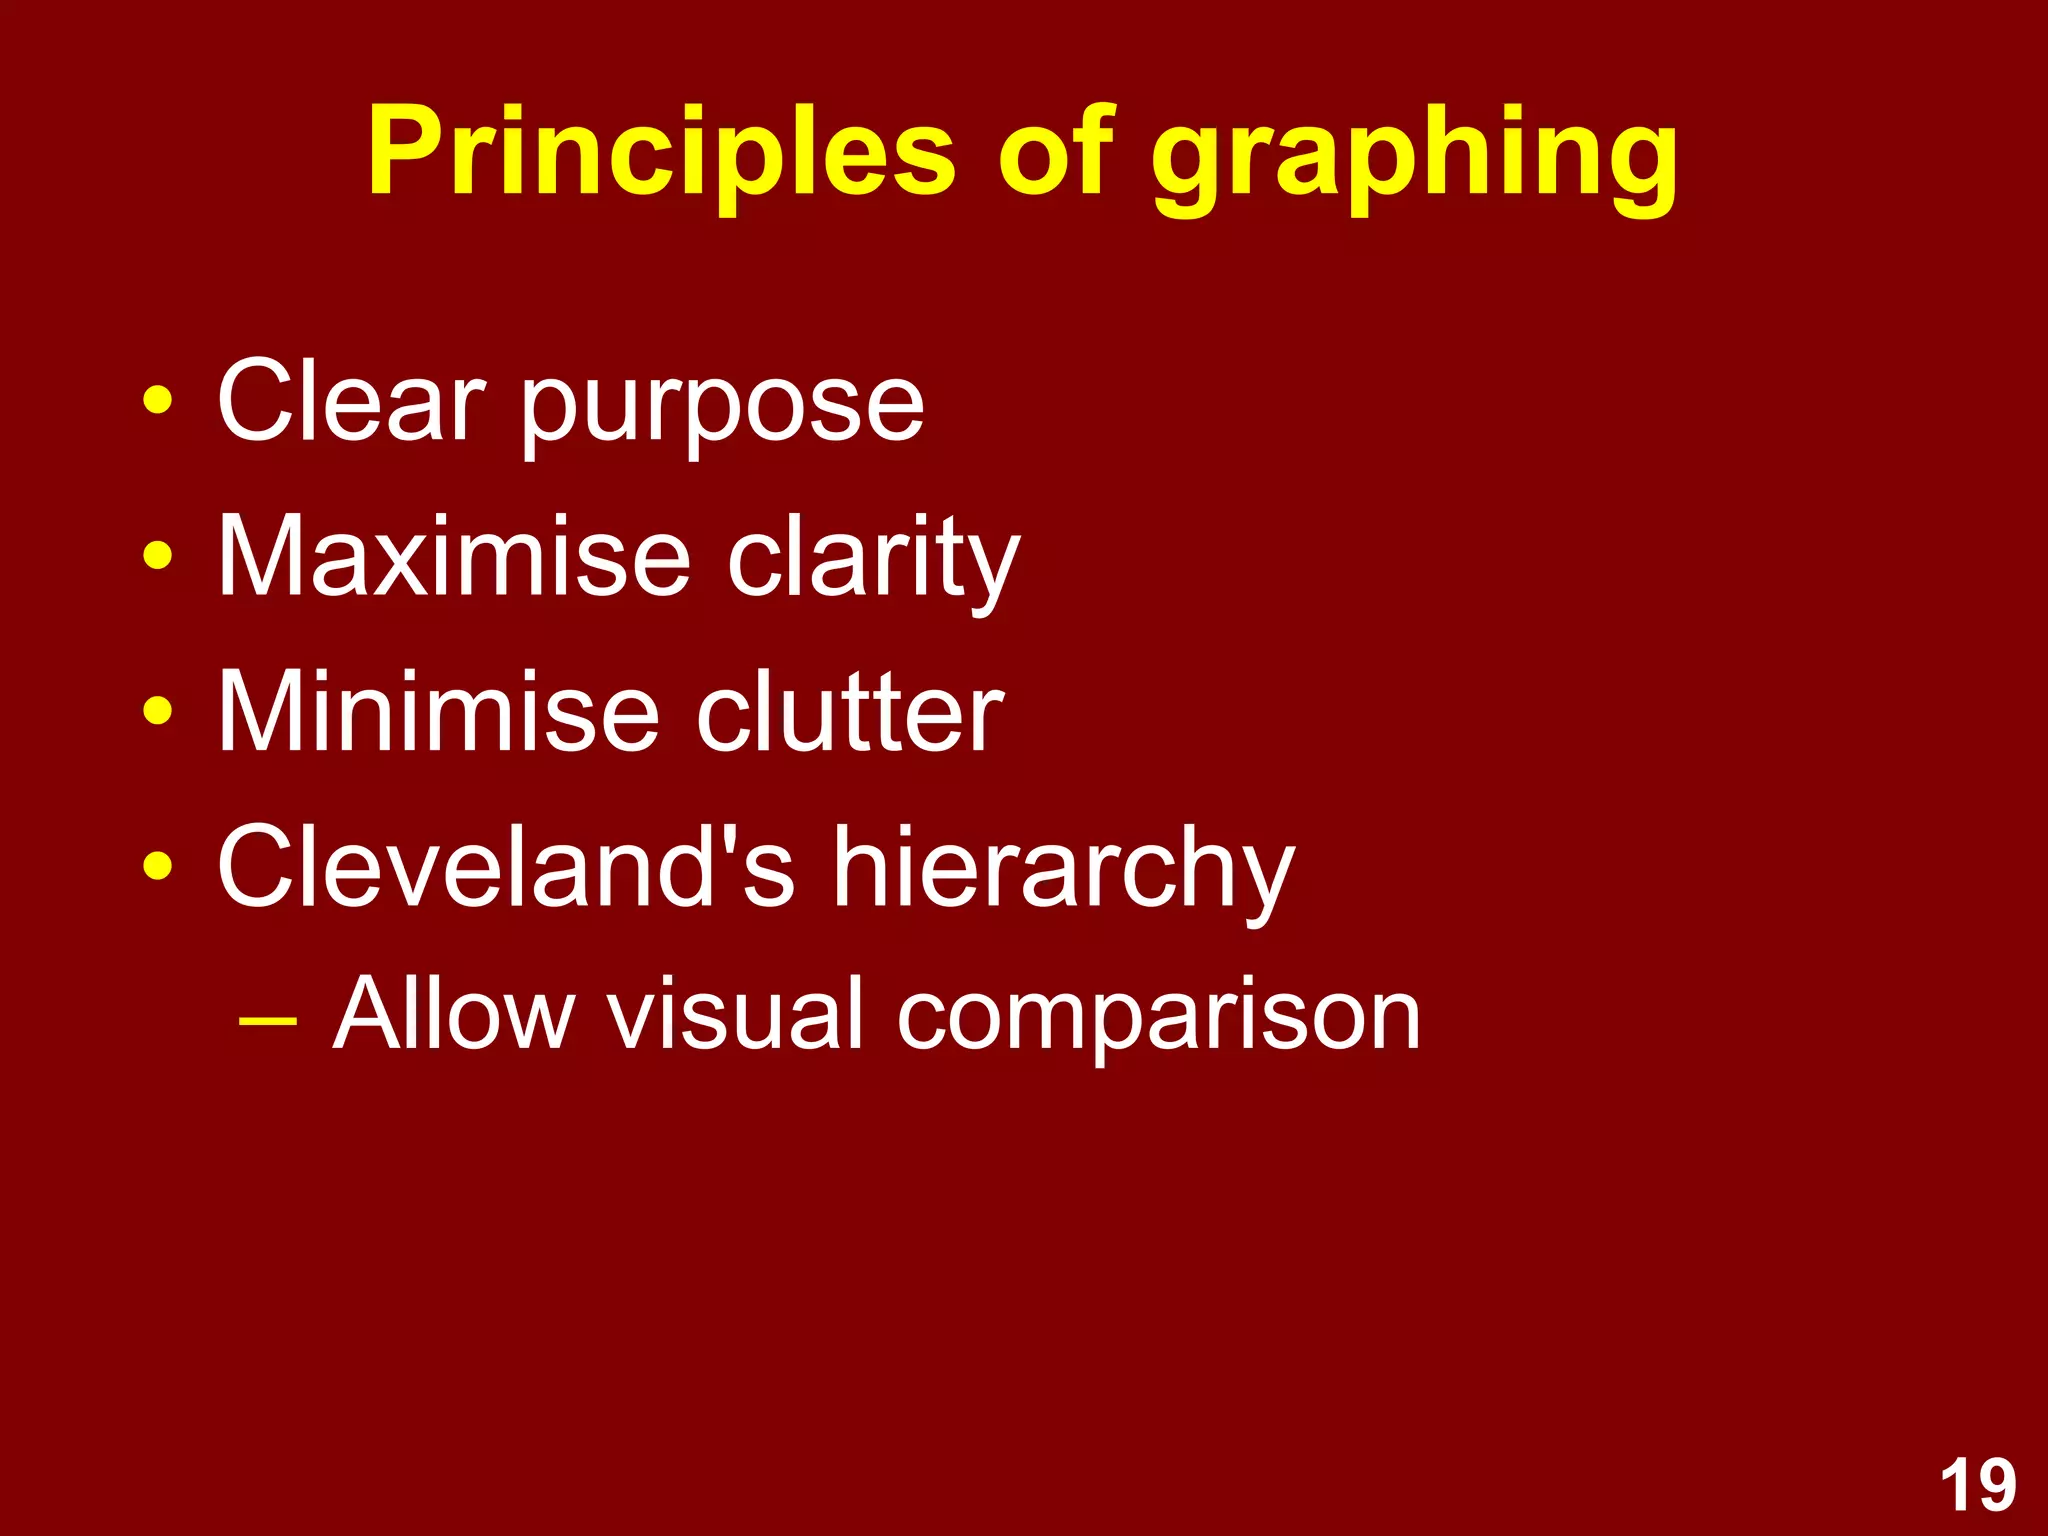
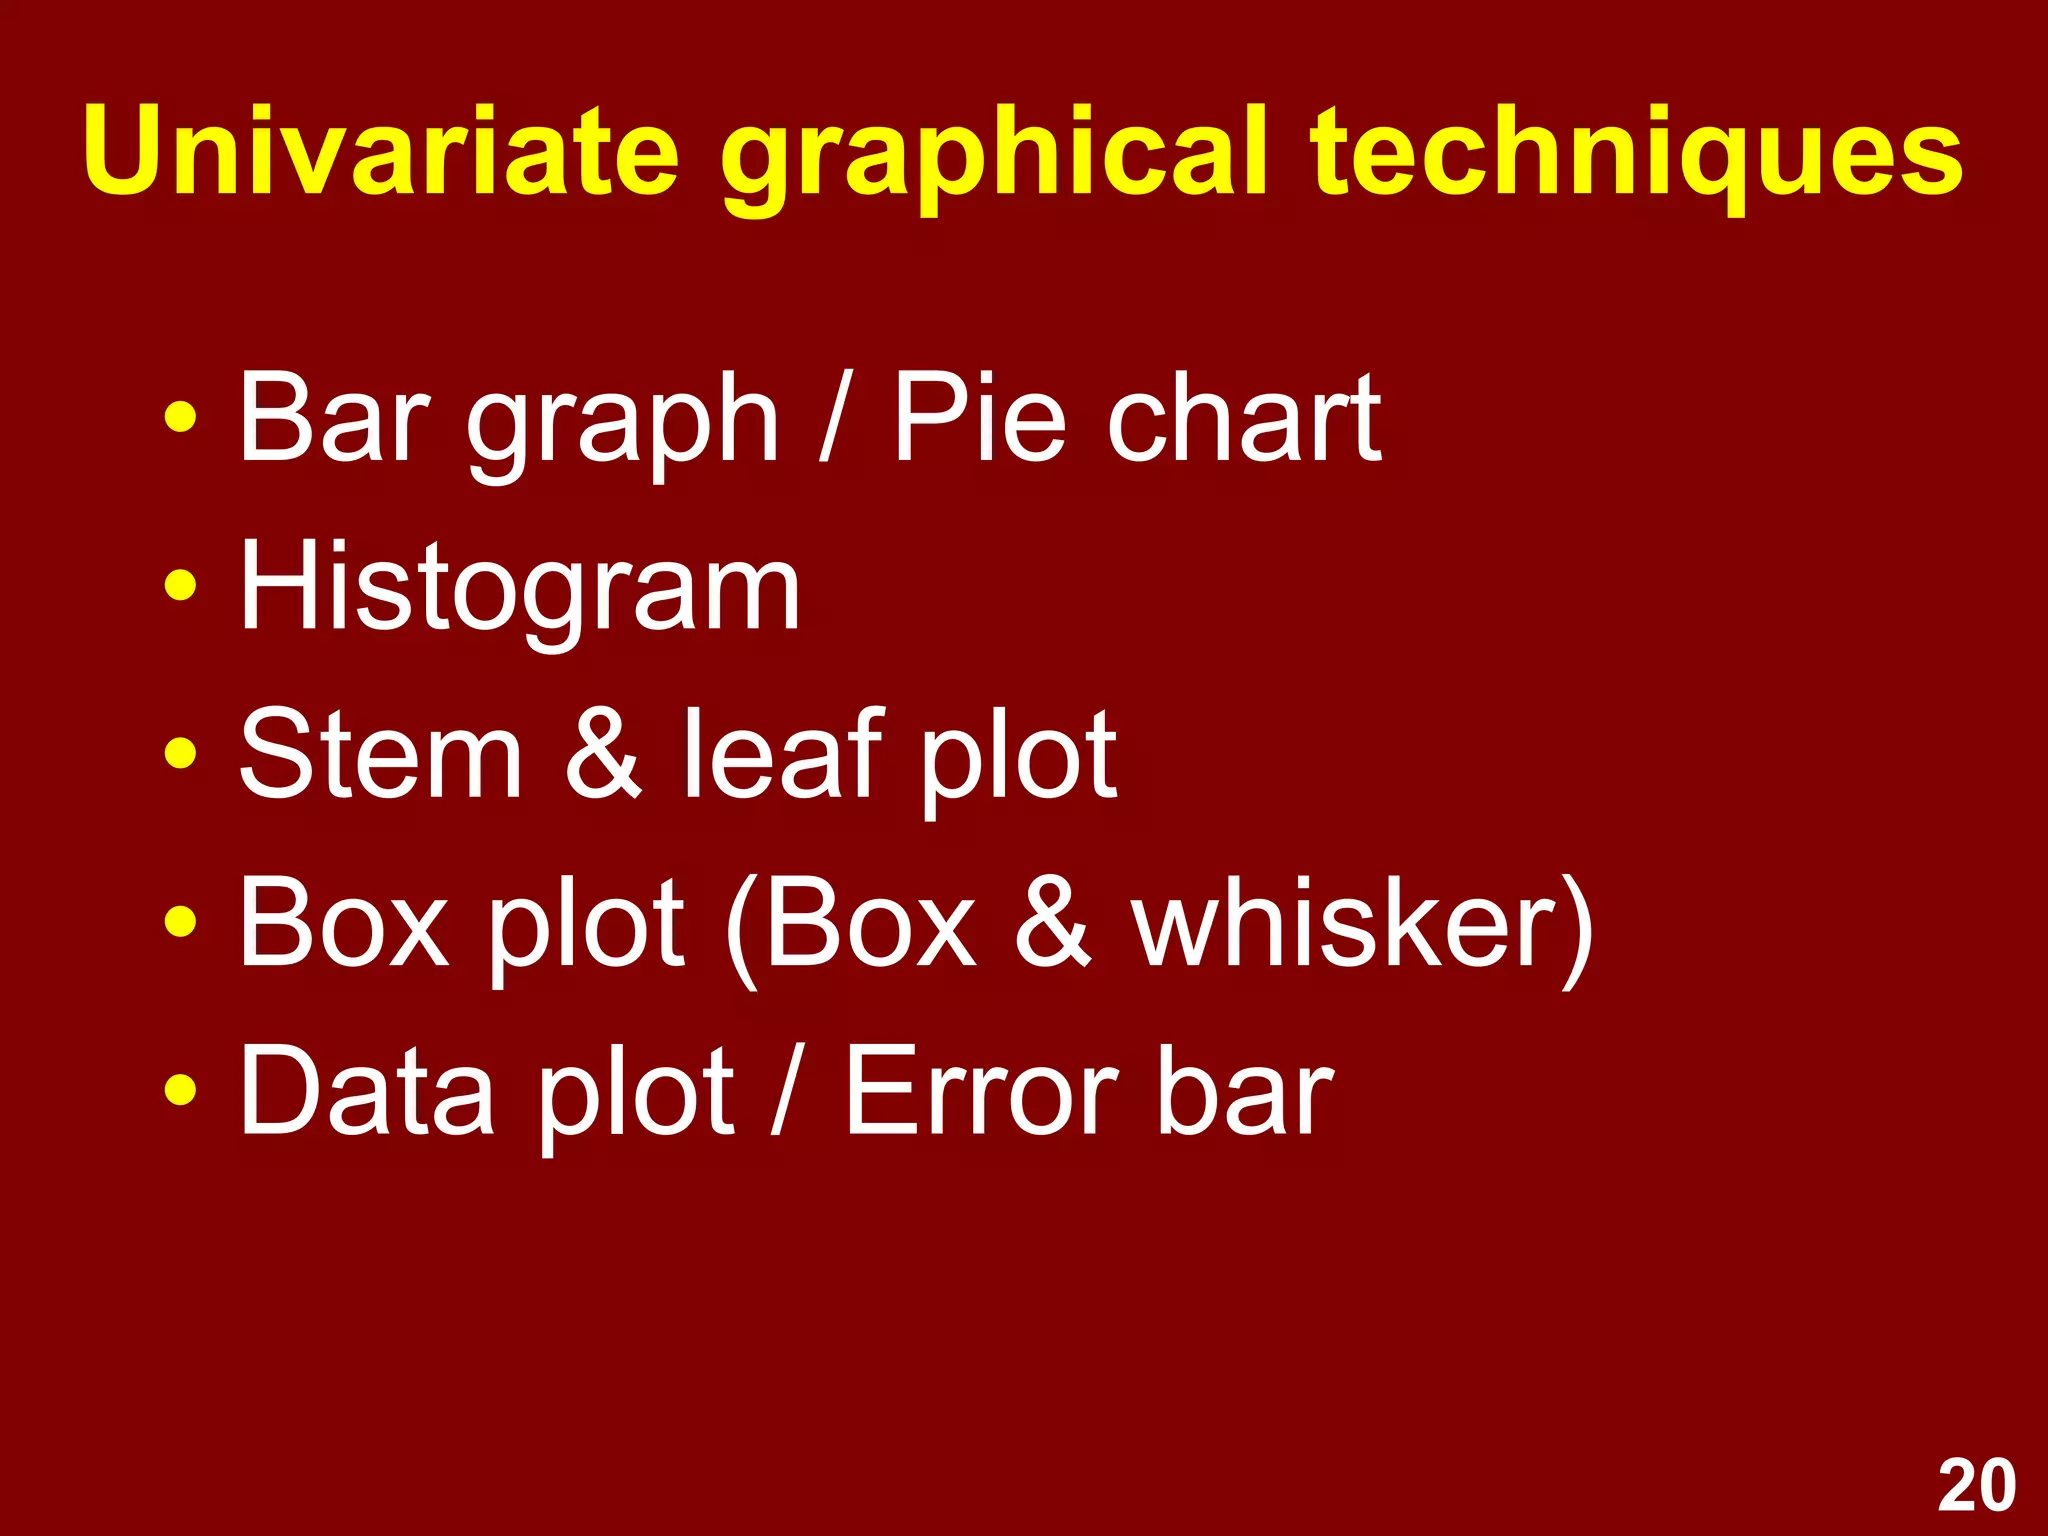
Describes data, statistics, central tendency, variability, and principles of effective graphing.
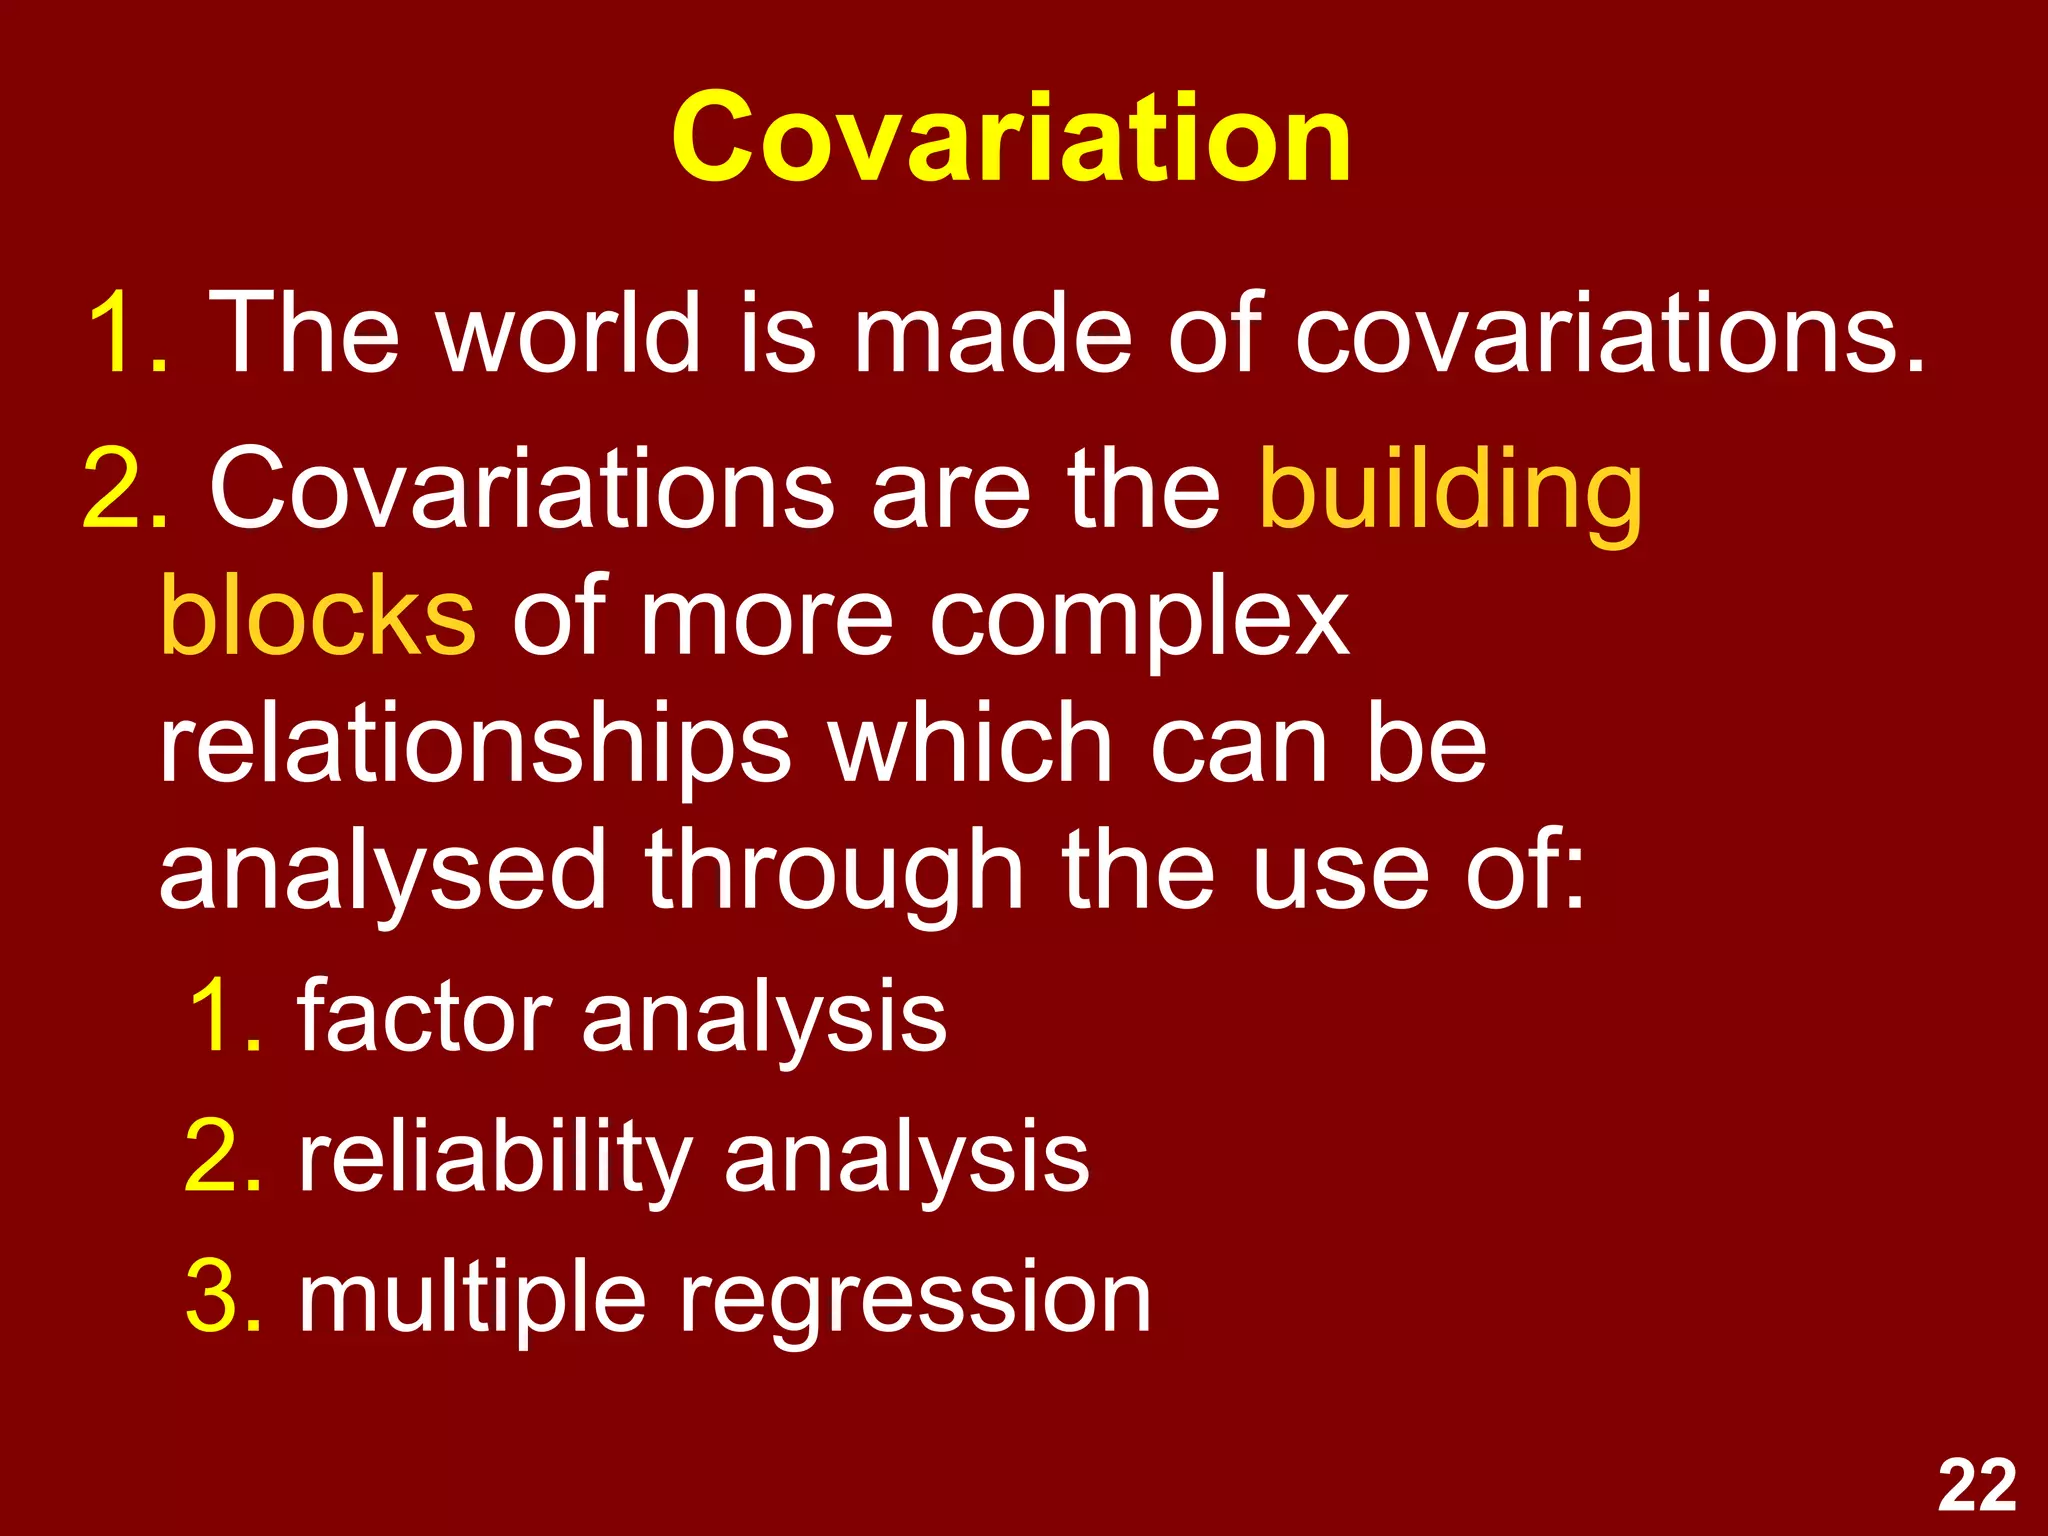
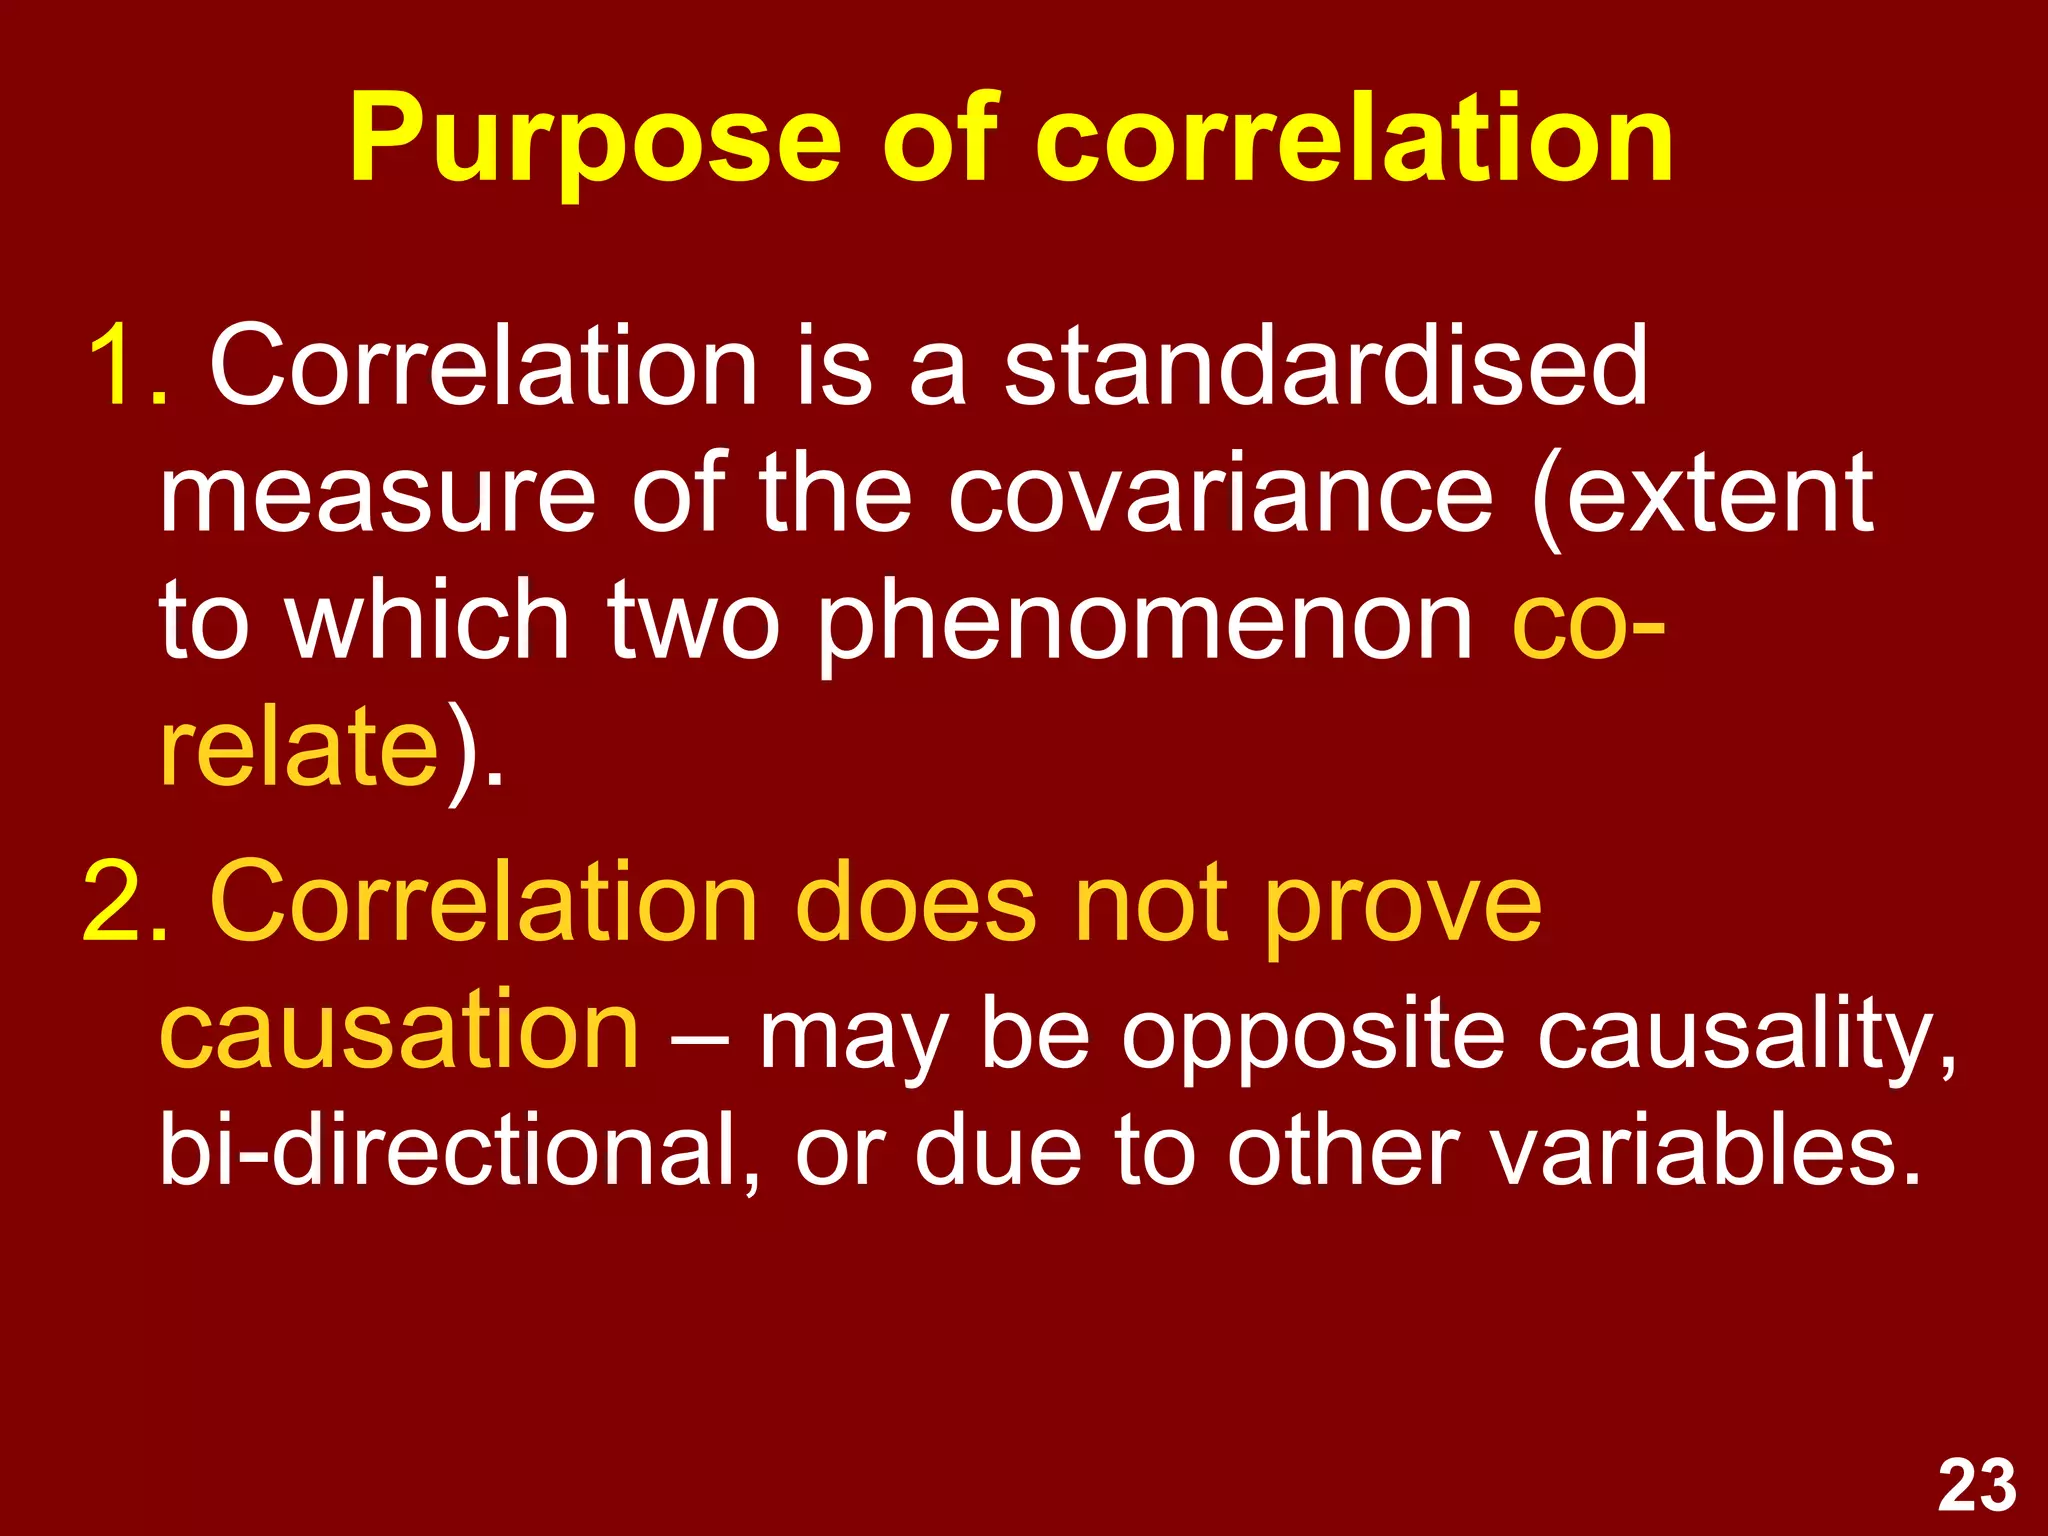
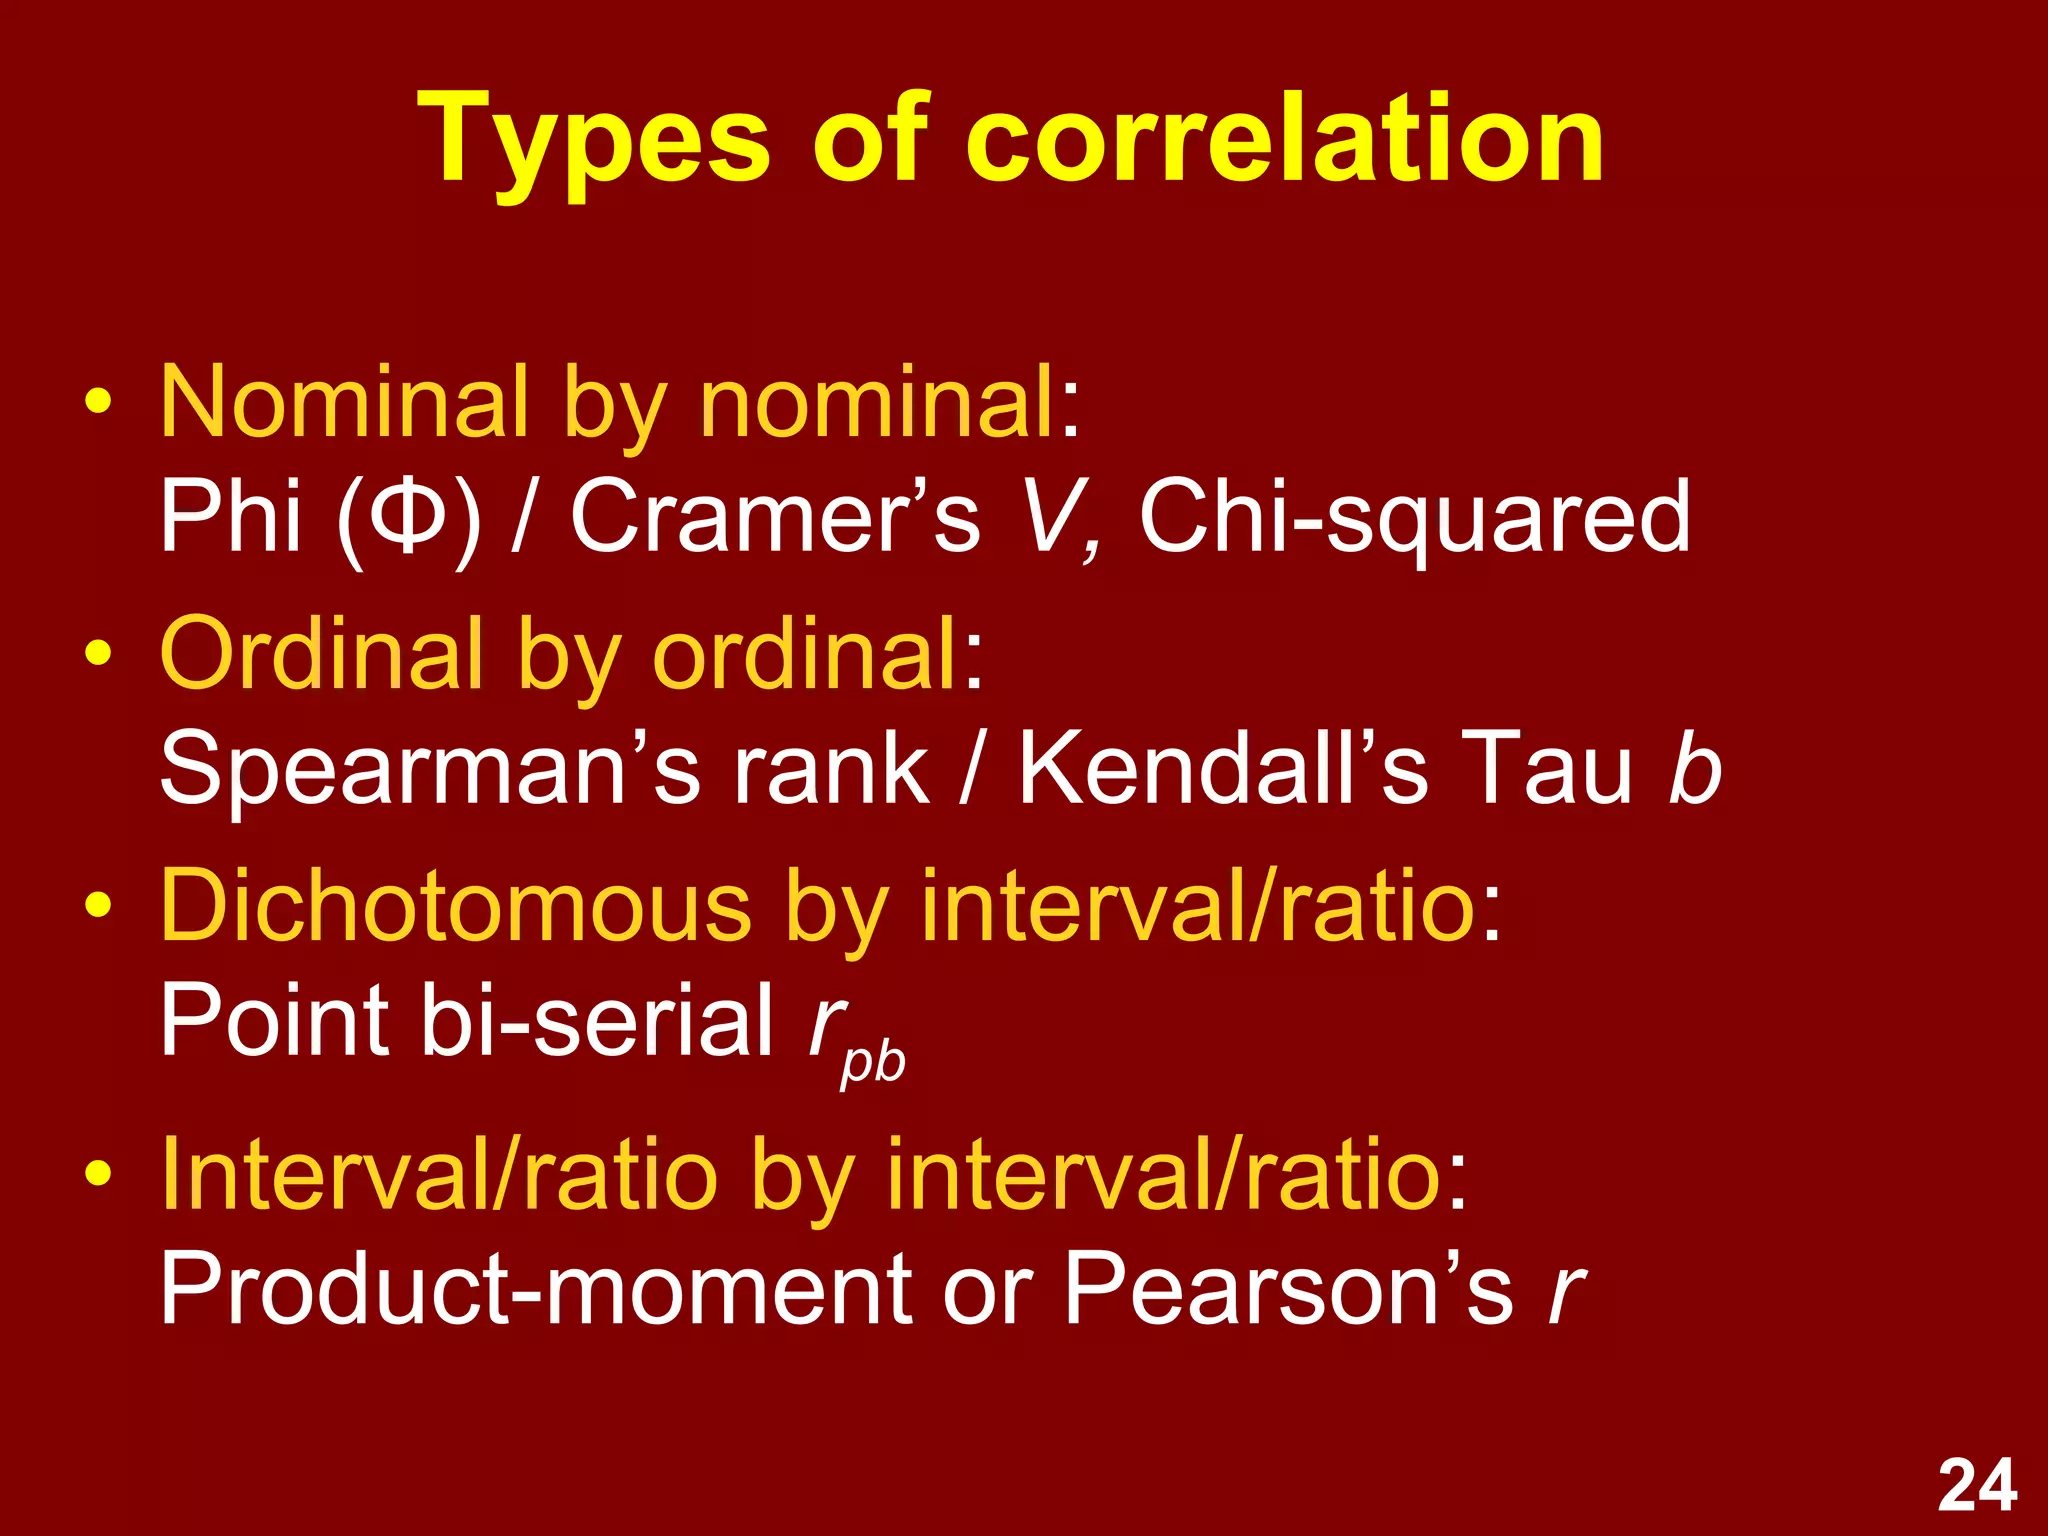
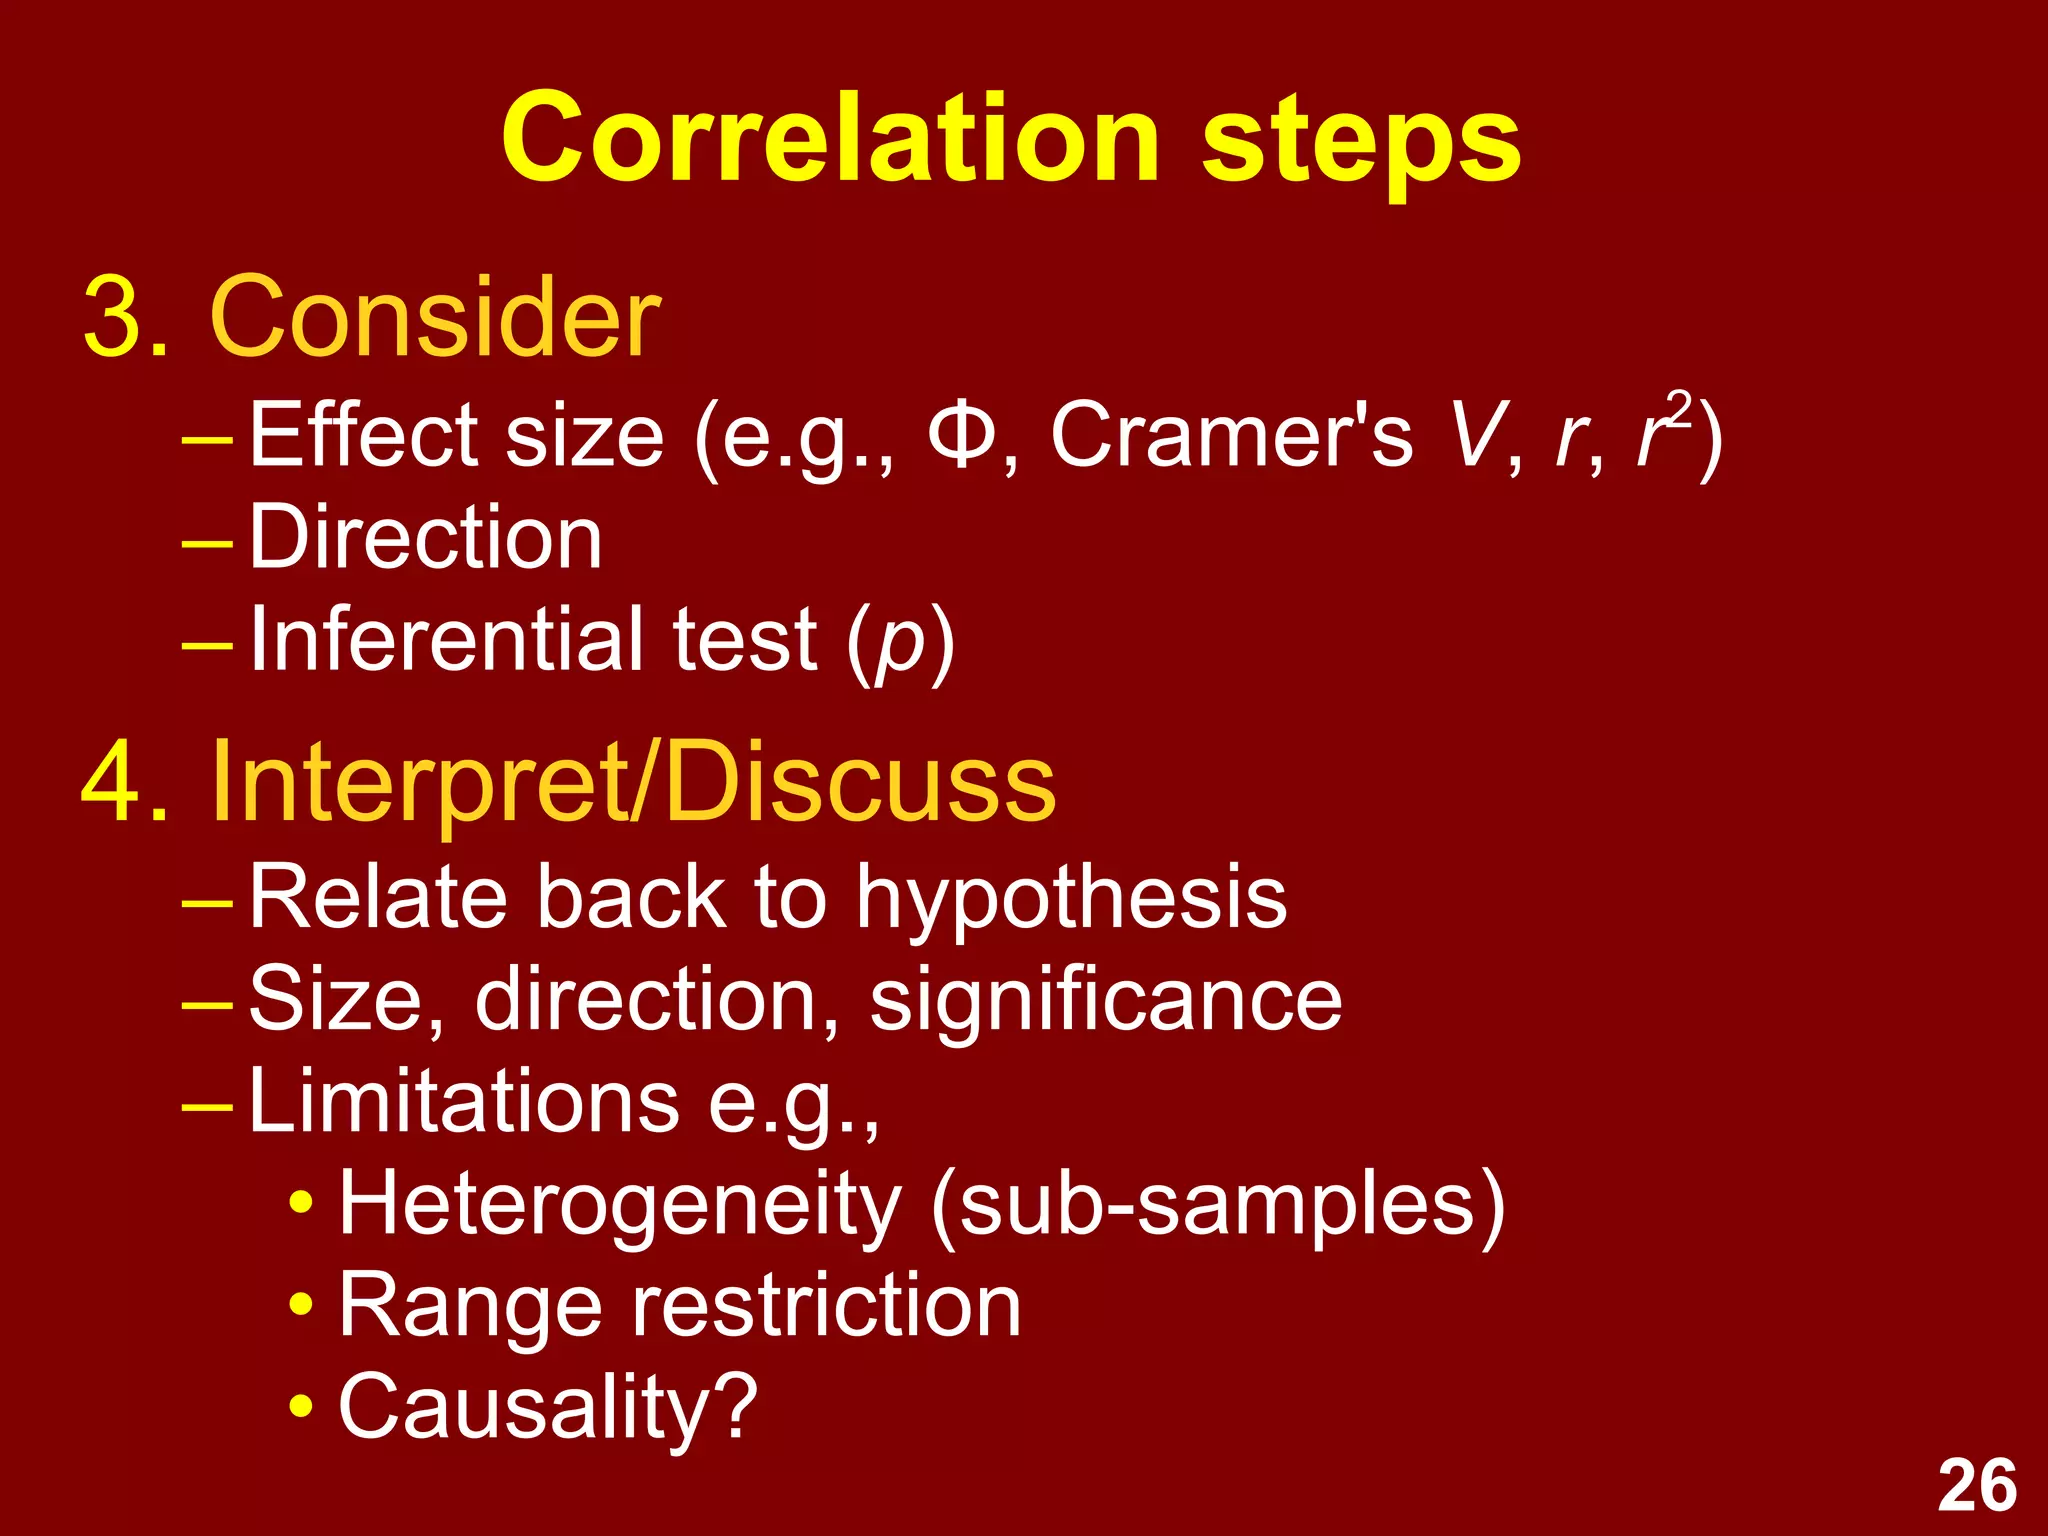
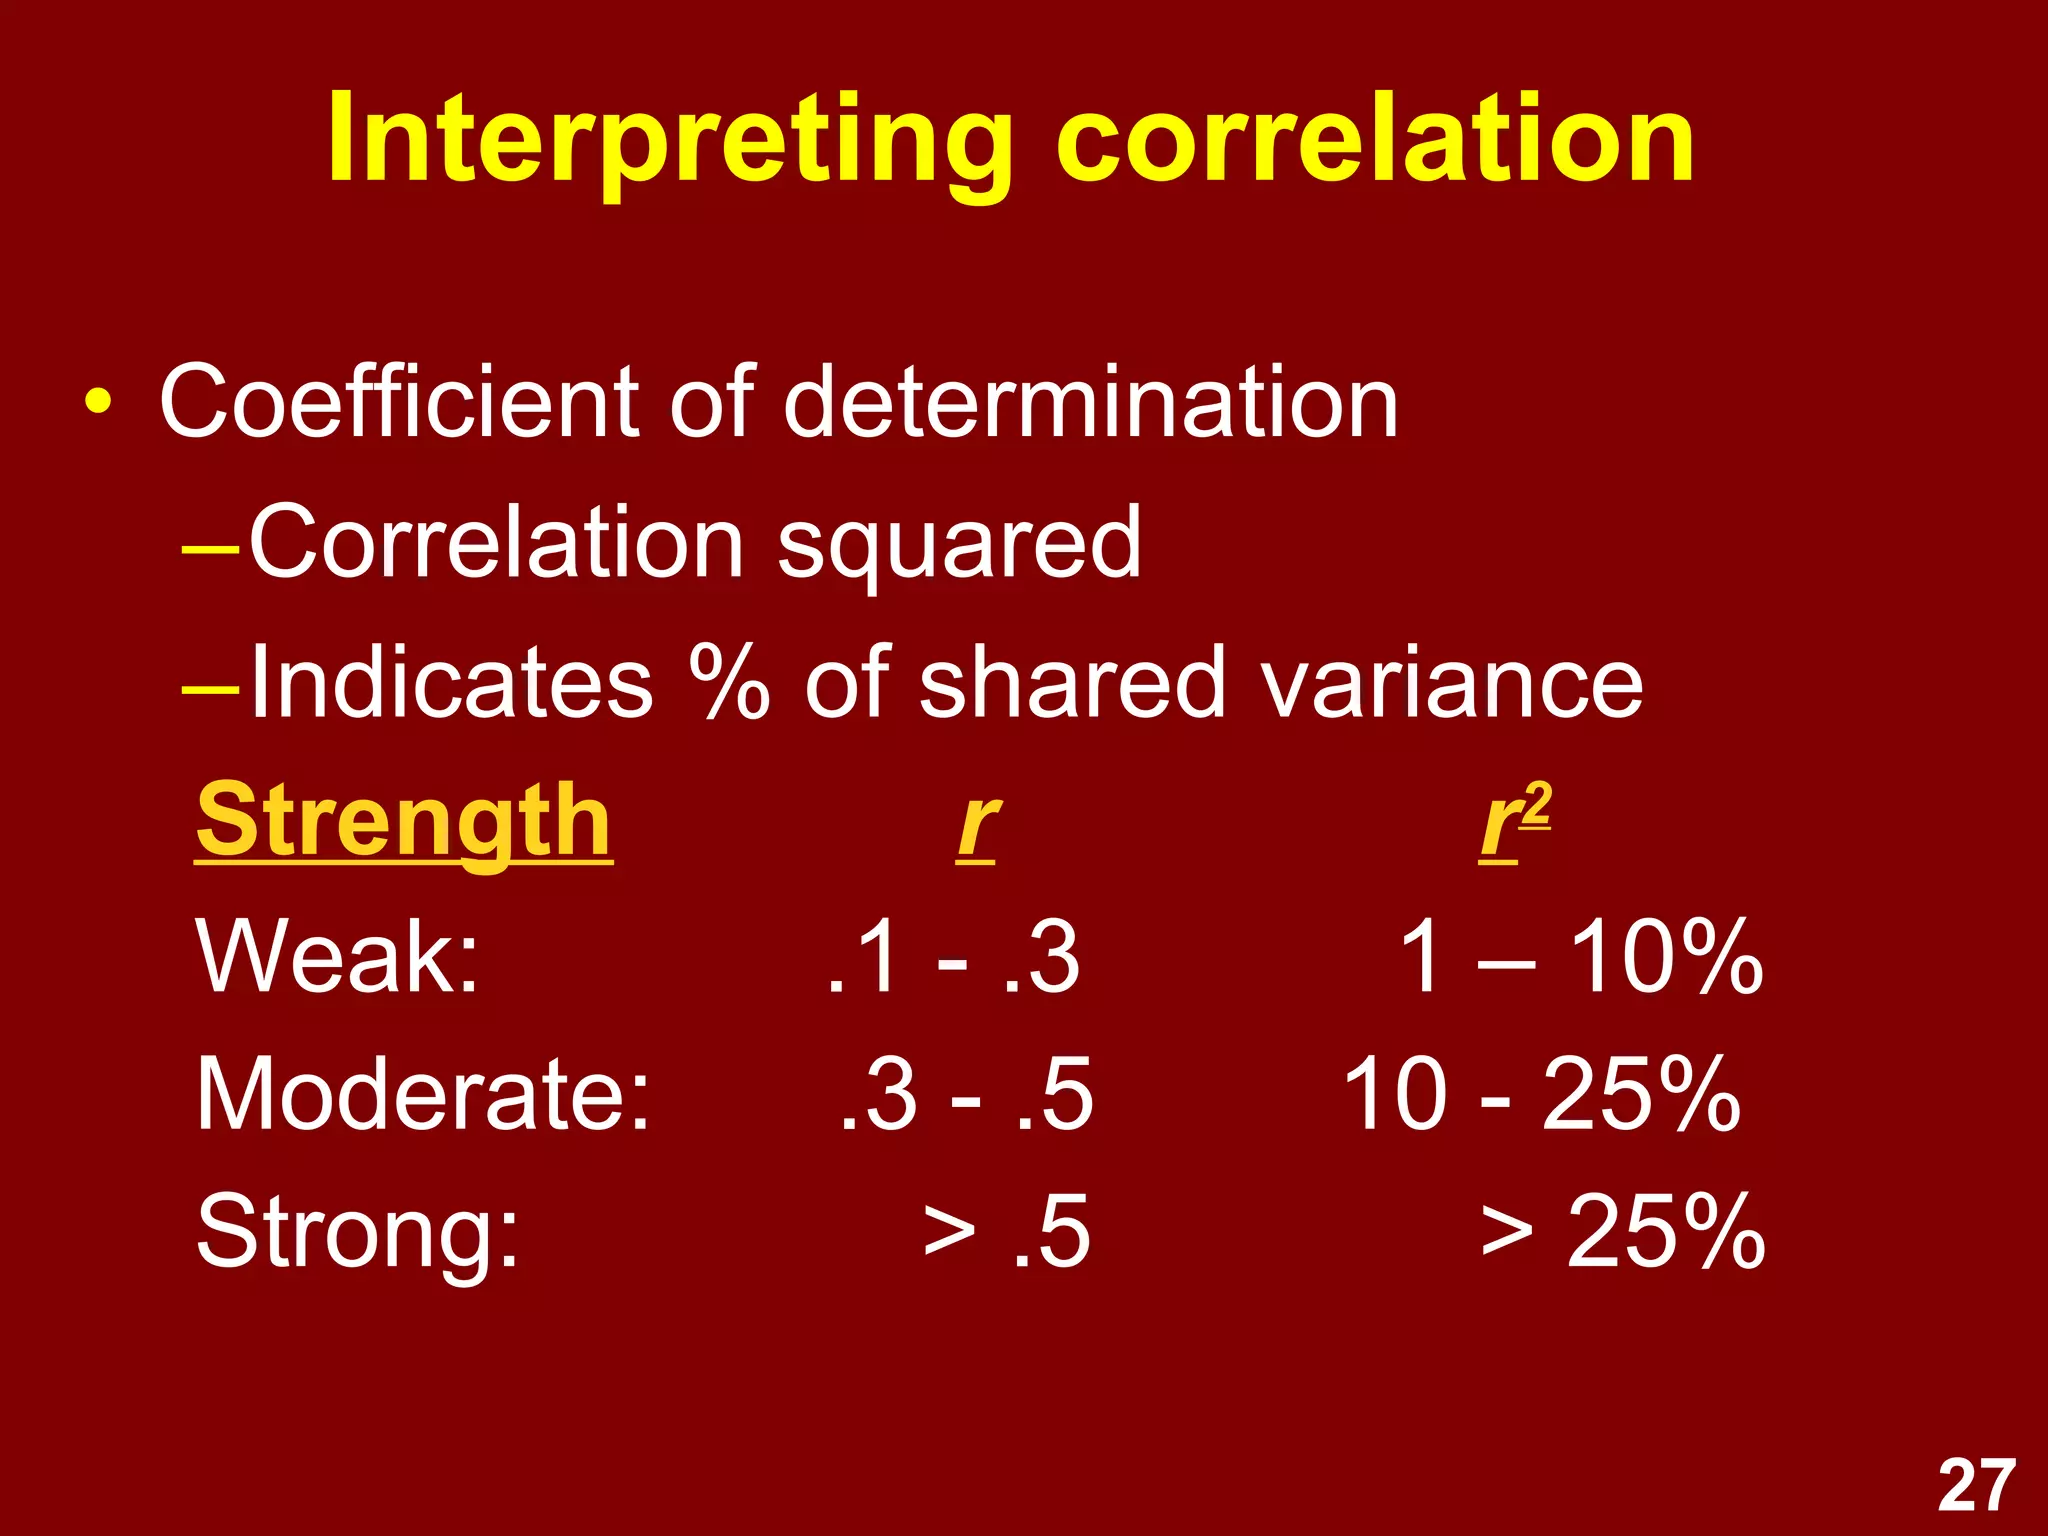
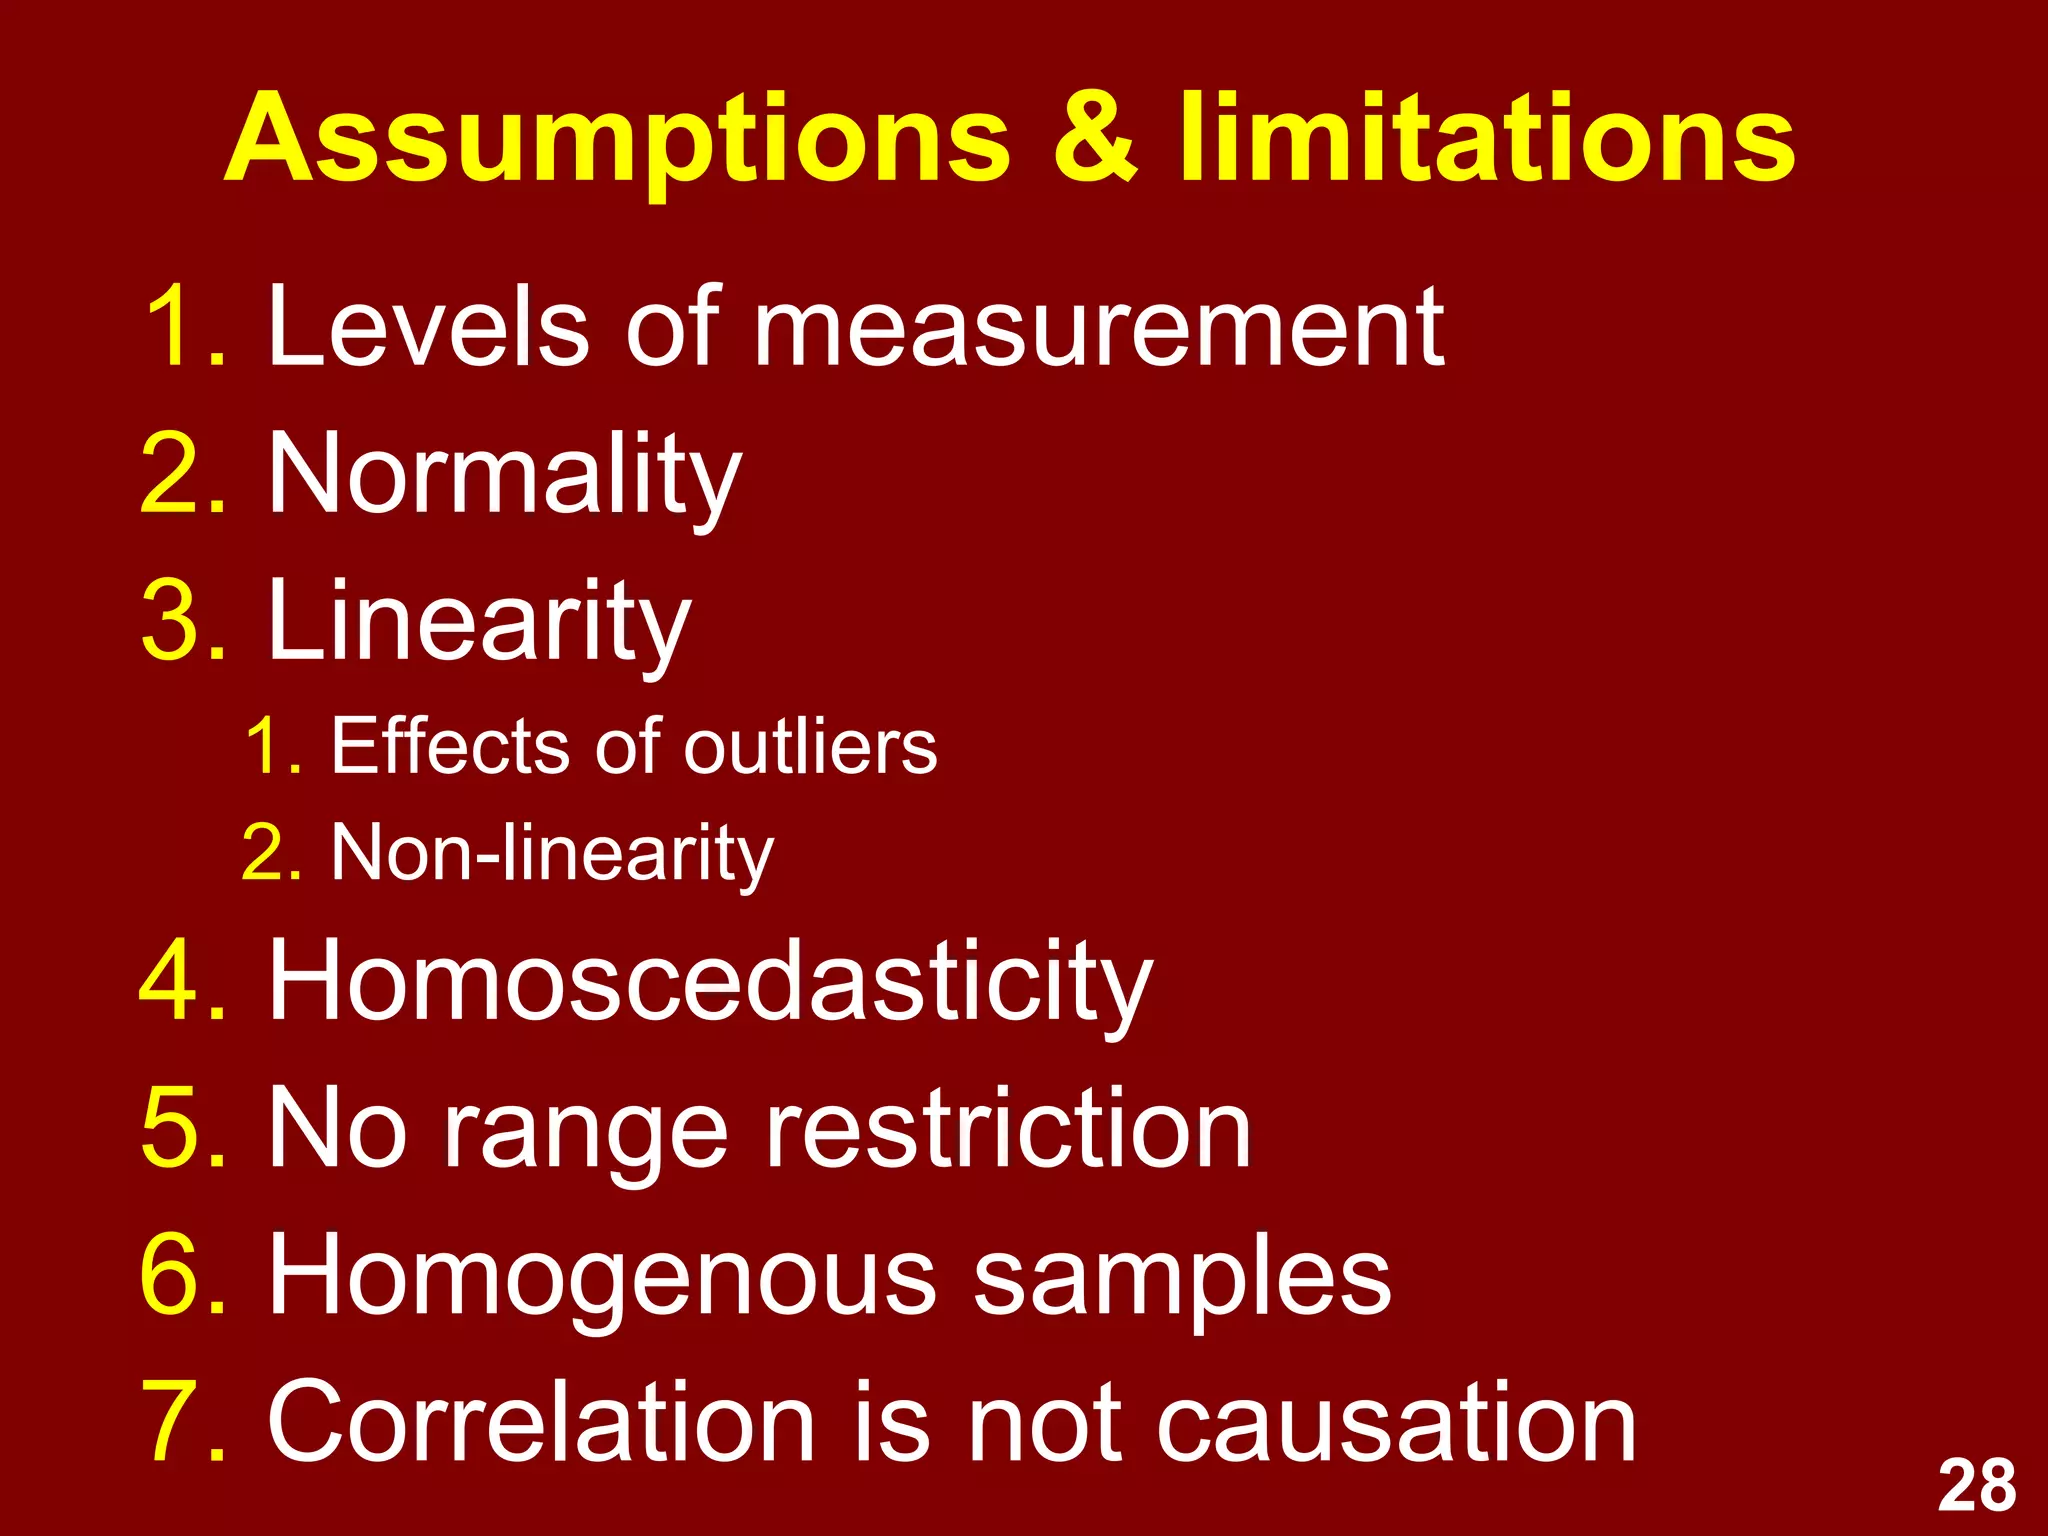
Definition of correlation, types, purposes, and pitfalls including non-causation and limitations.
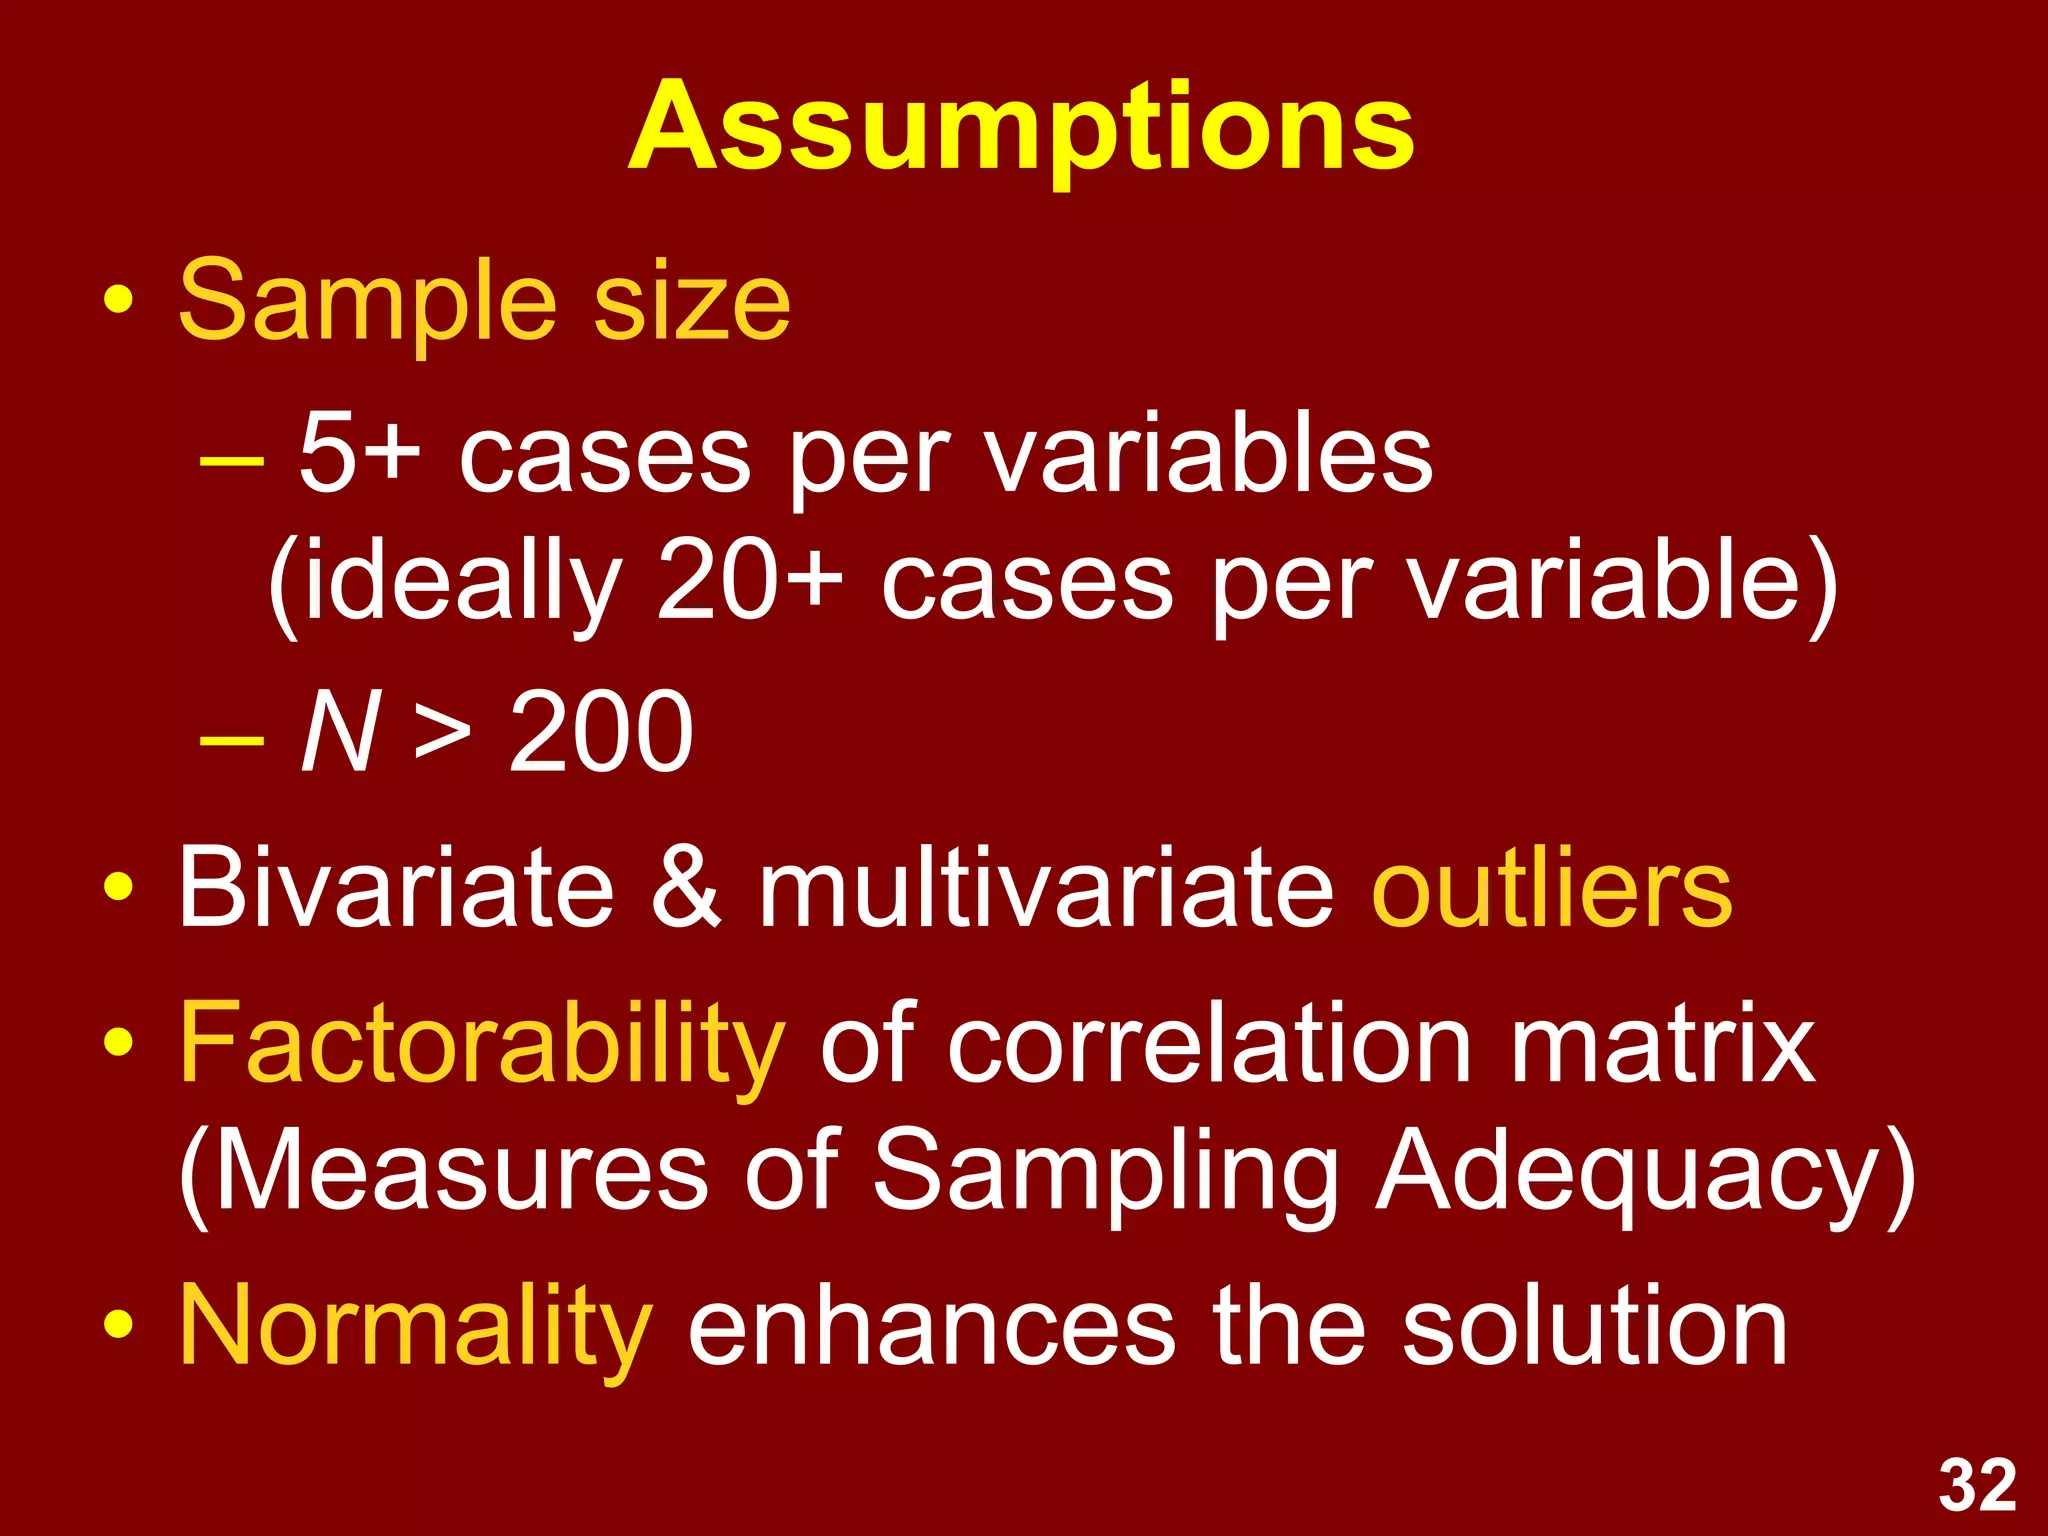
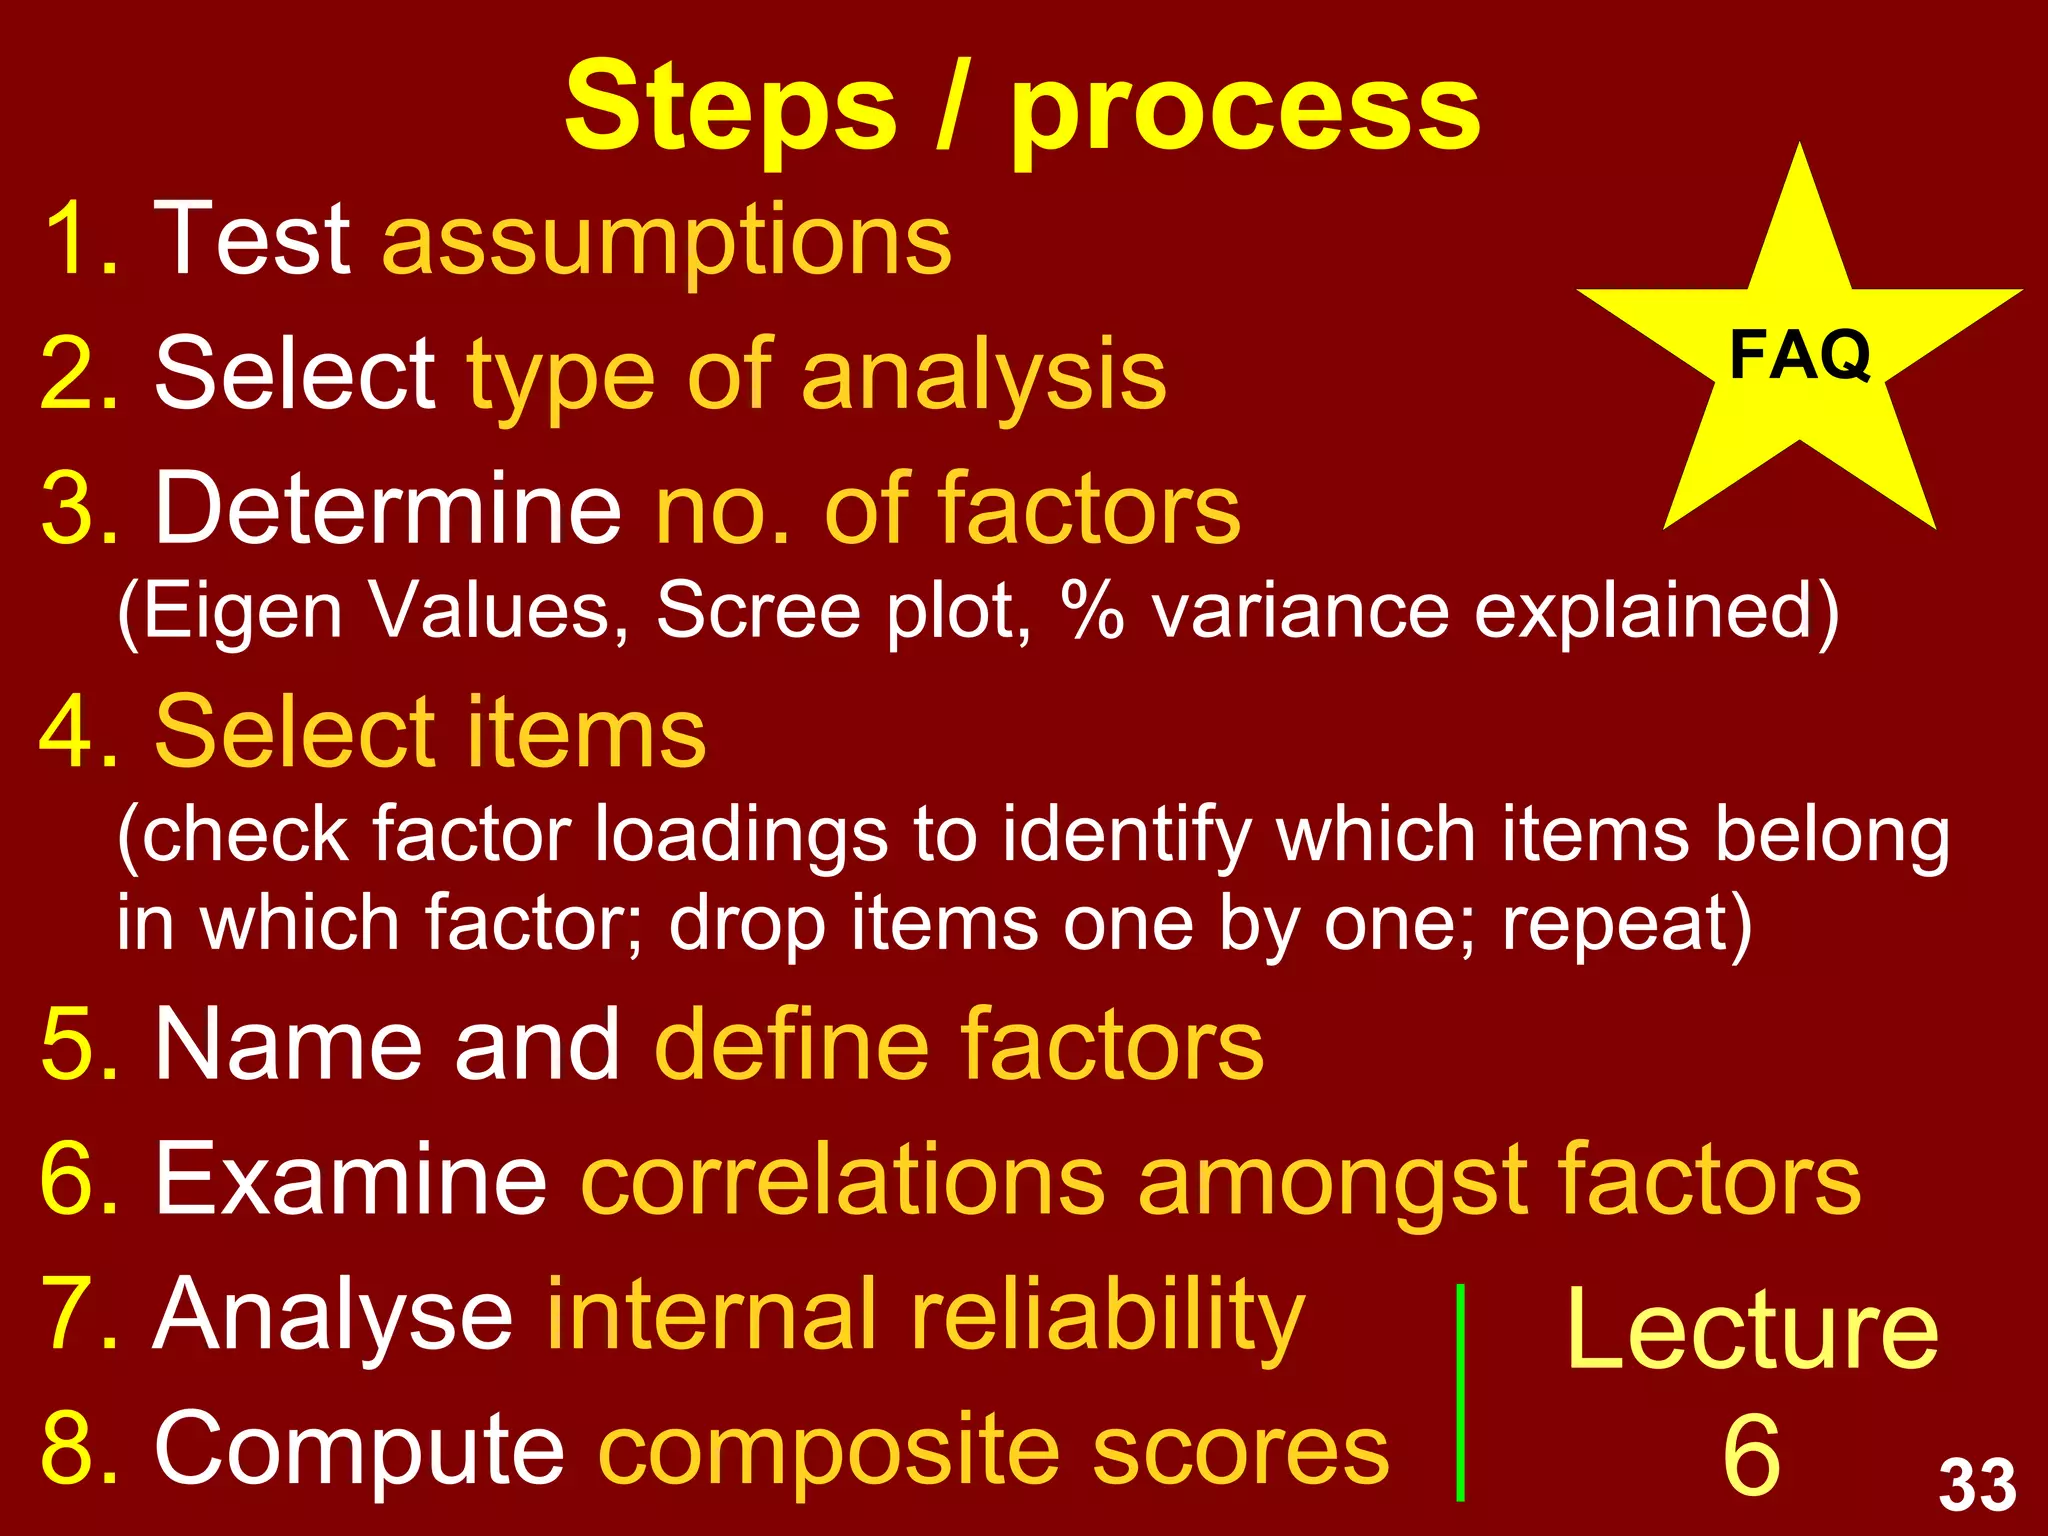
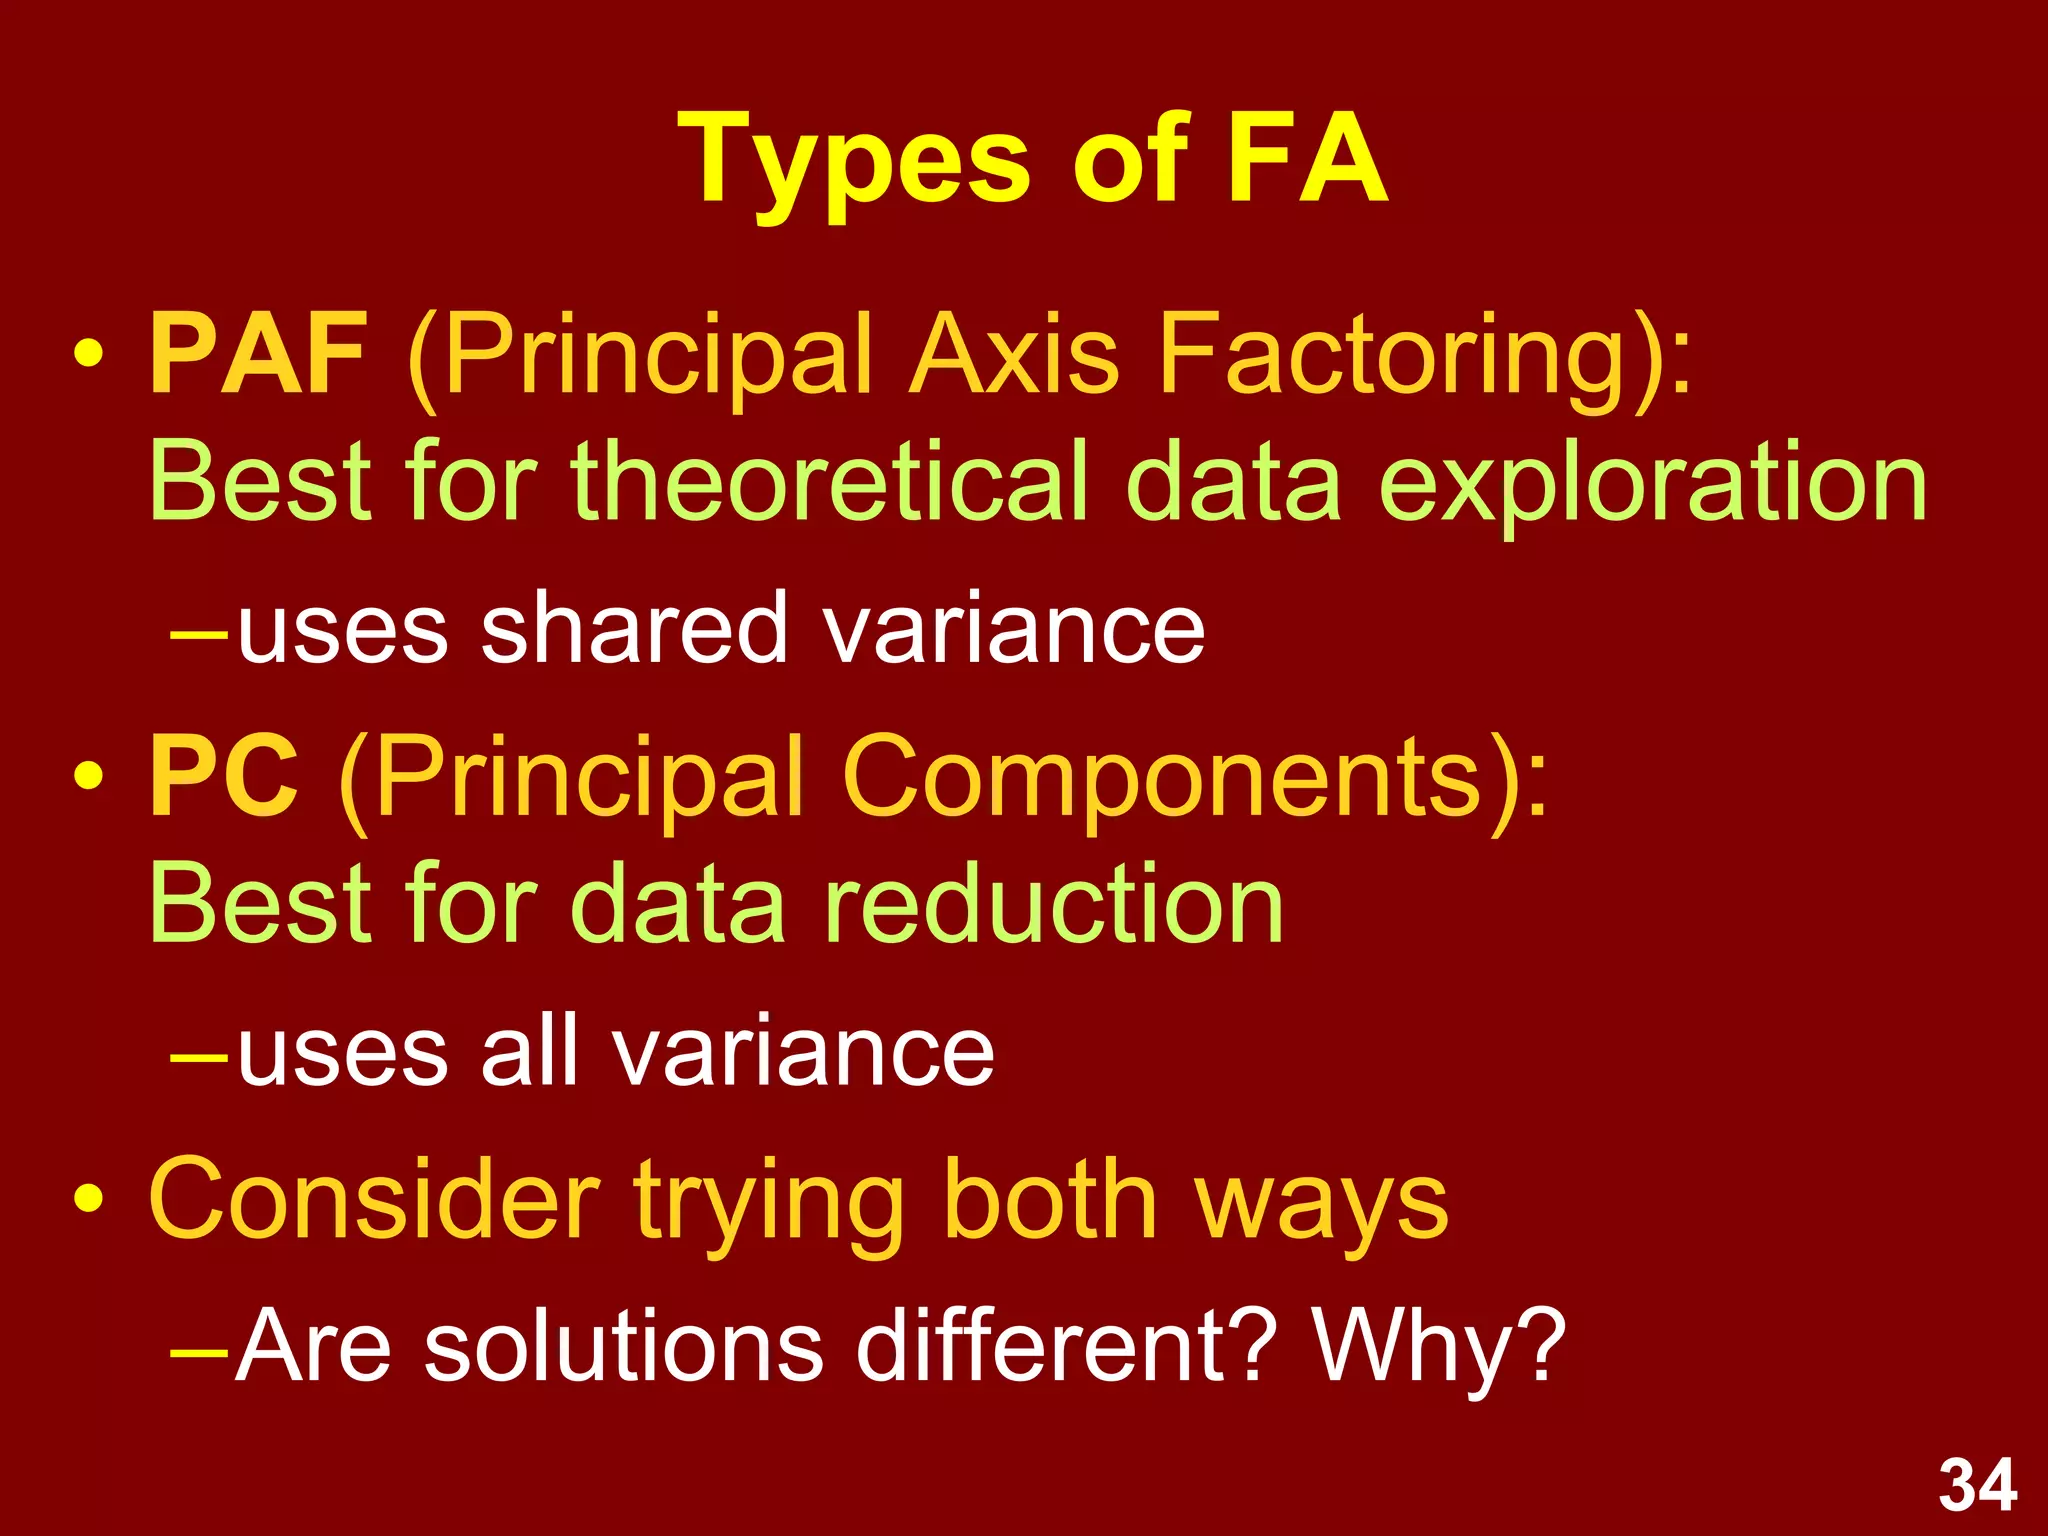
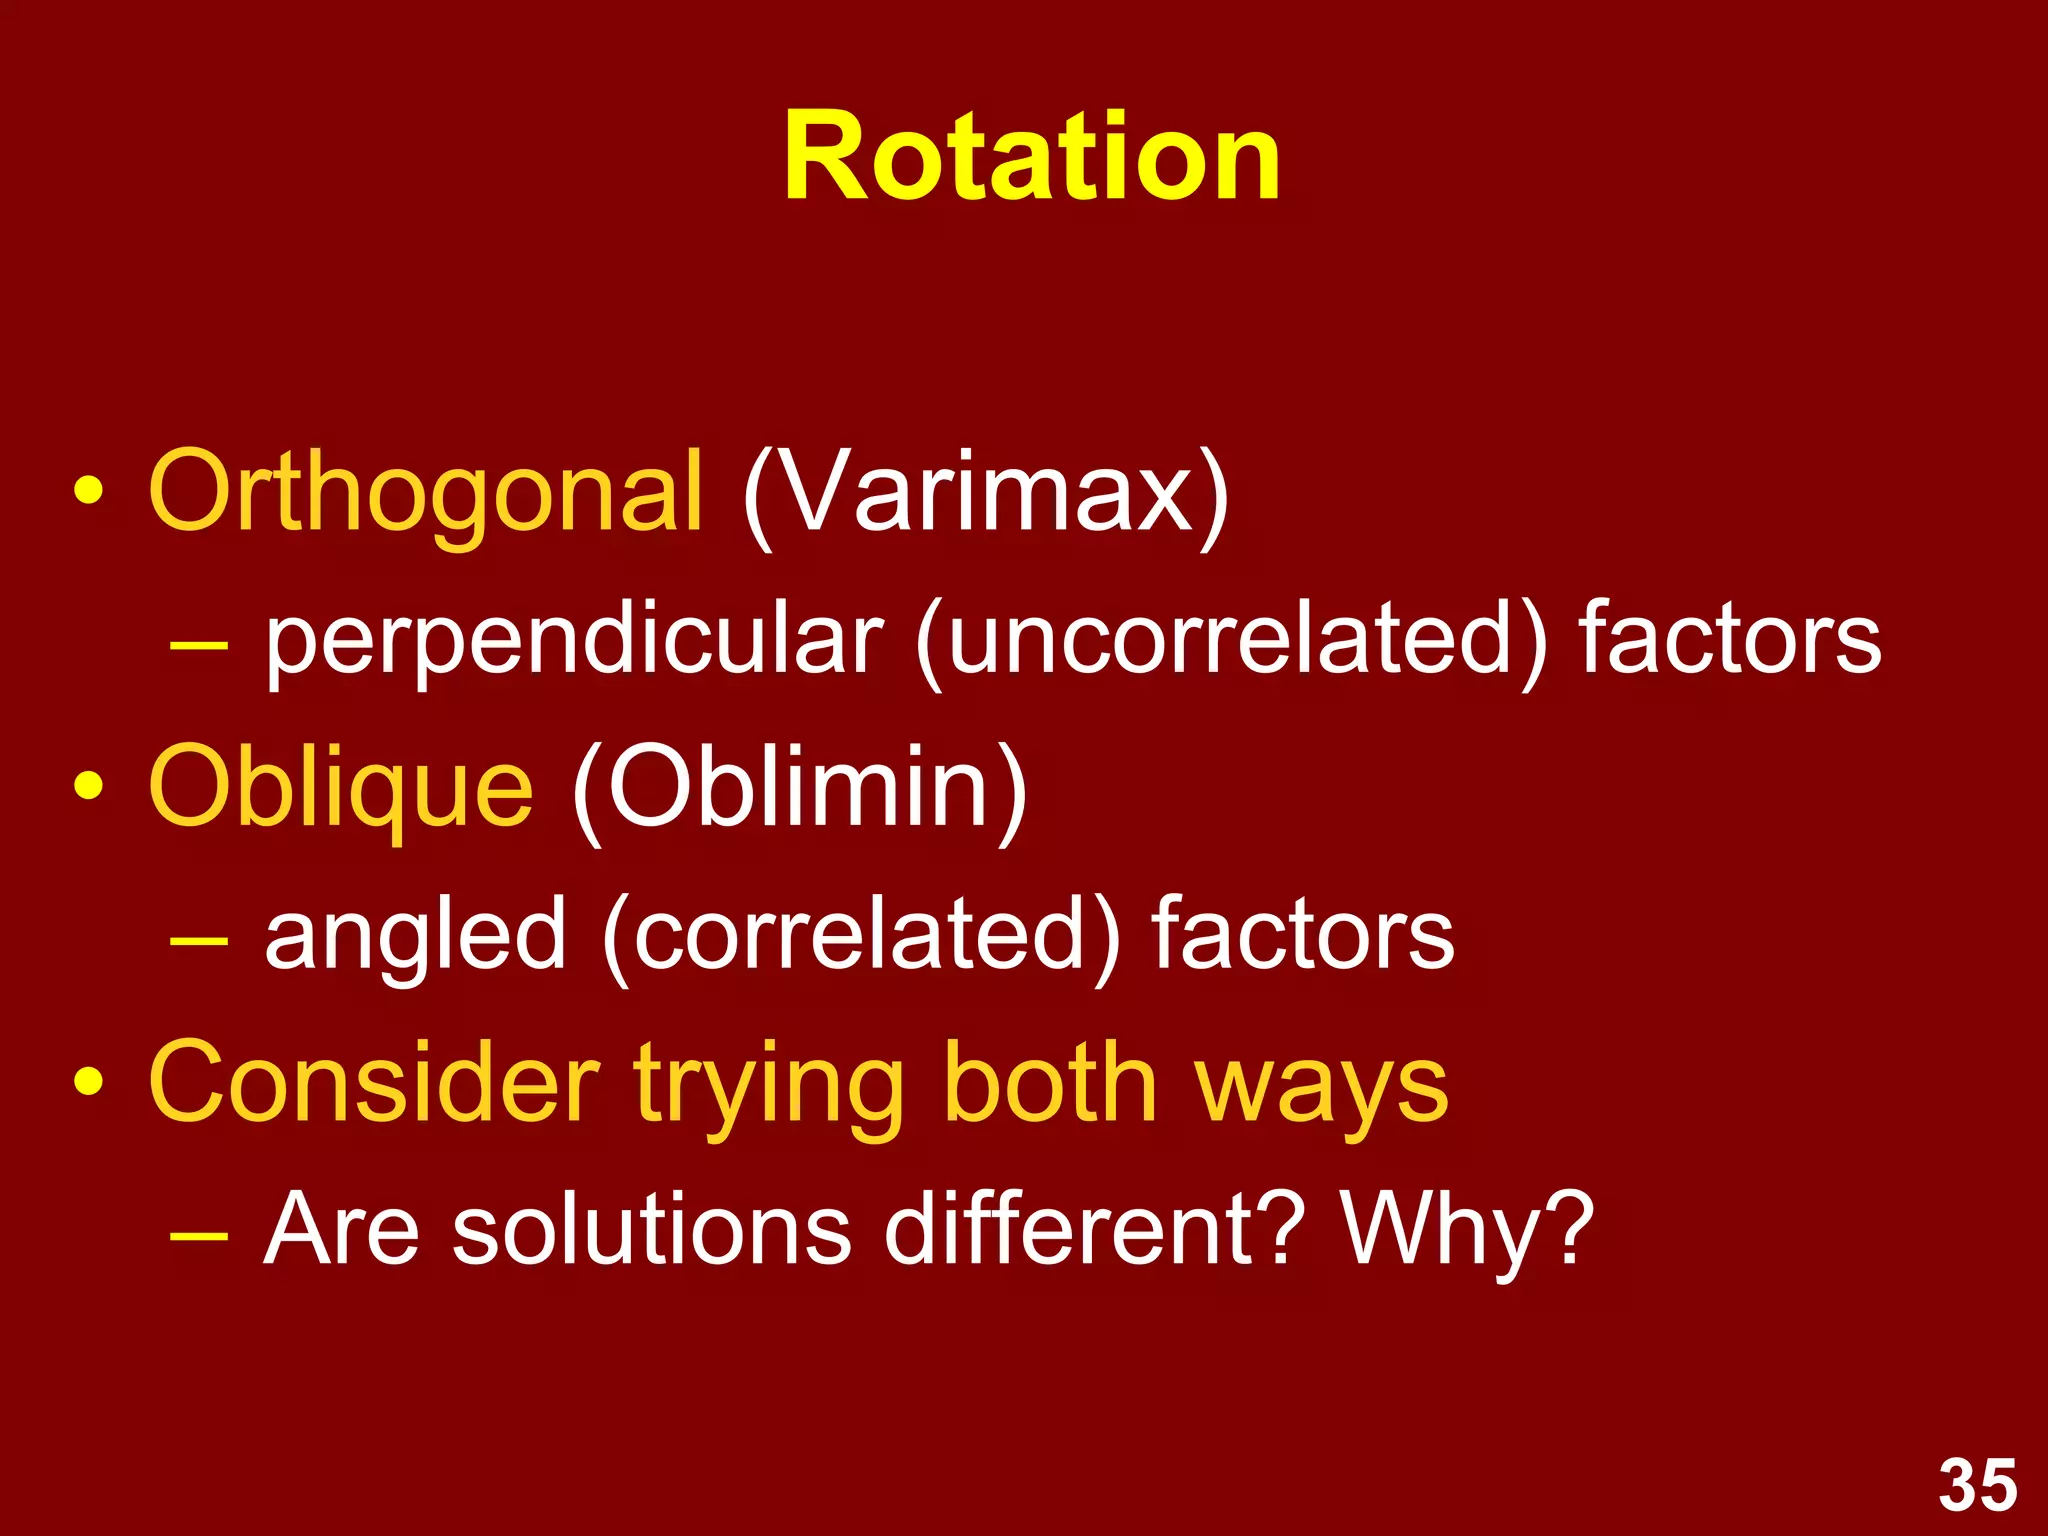
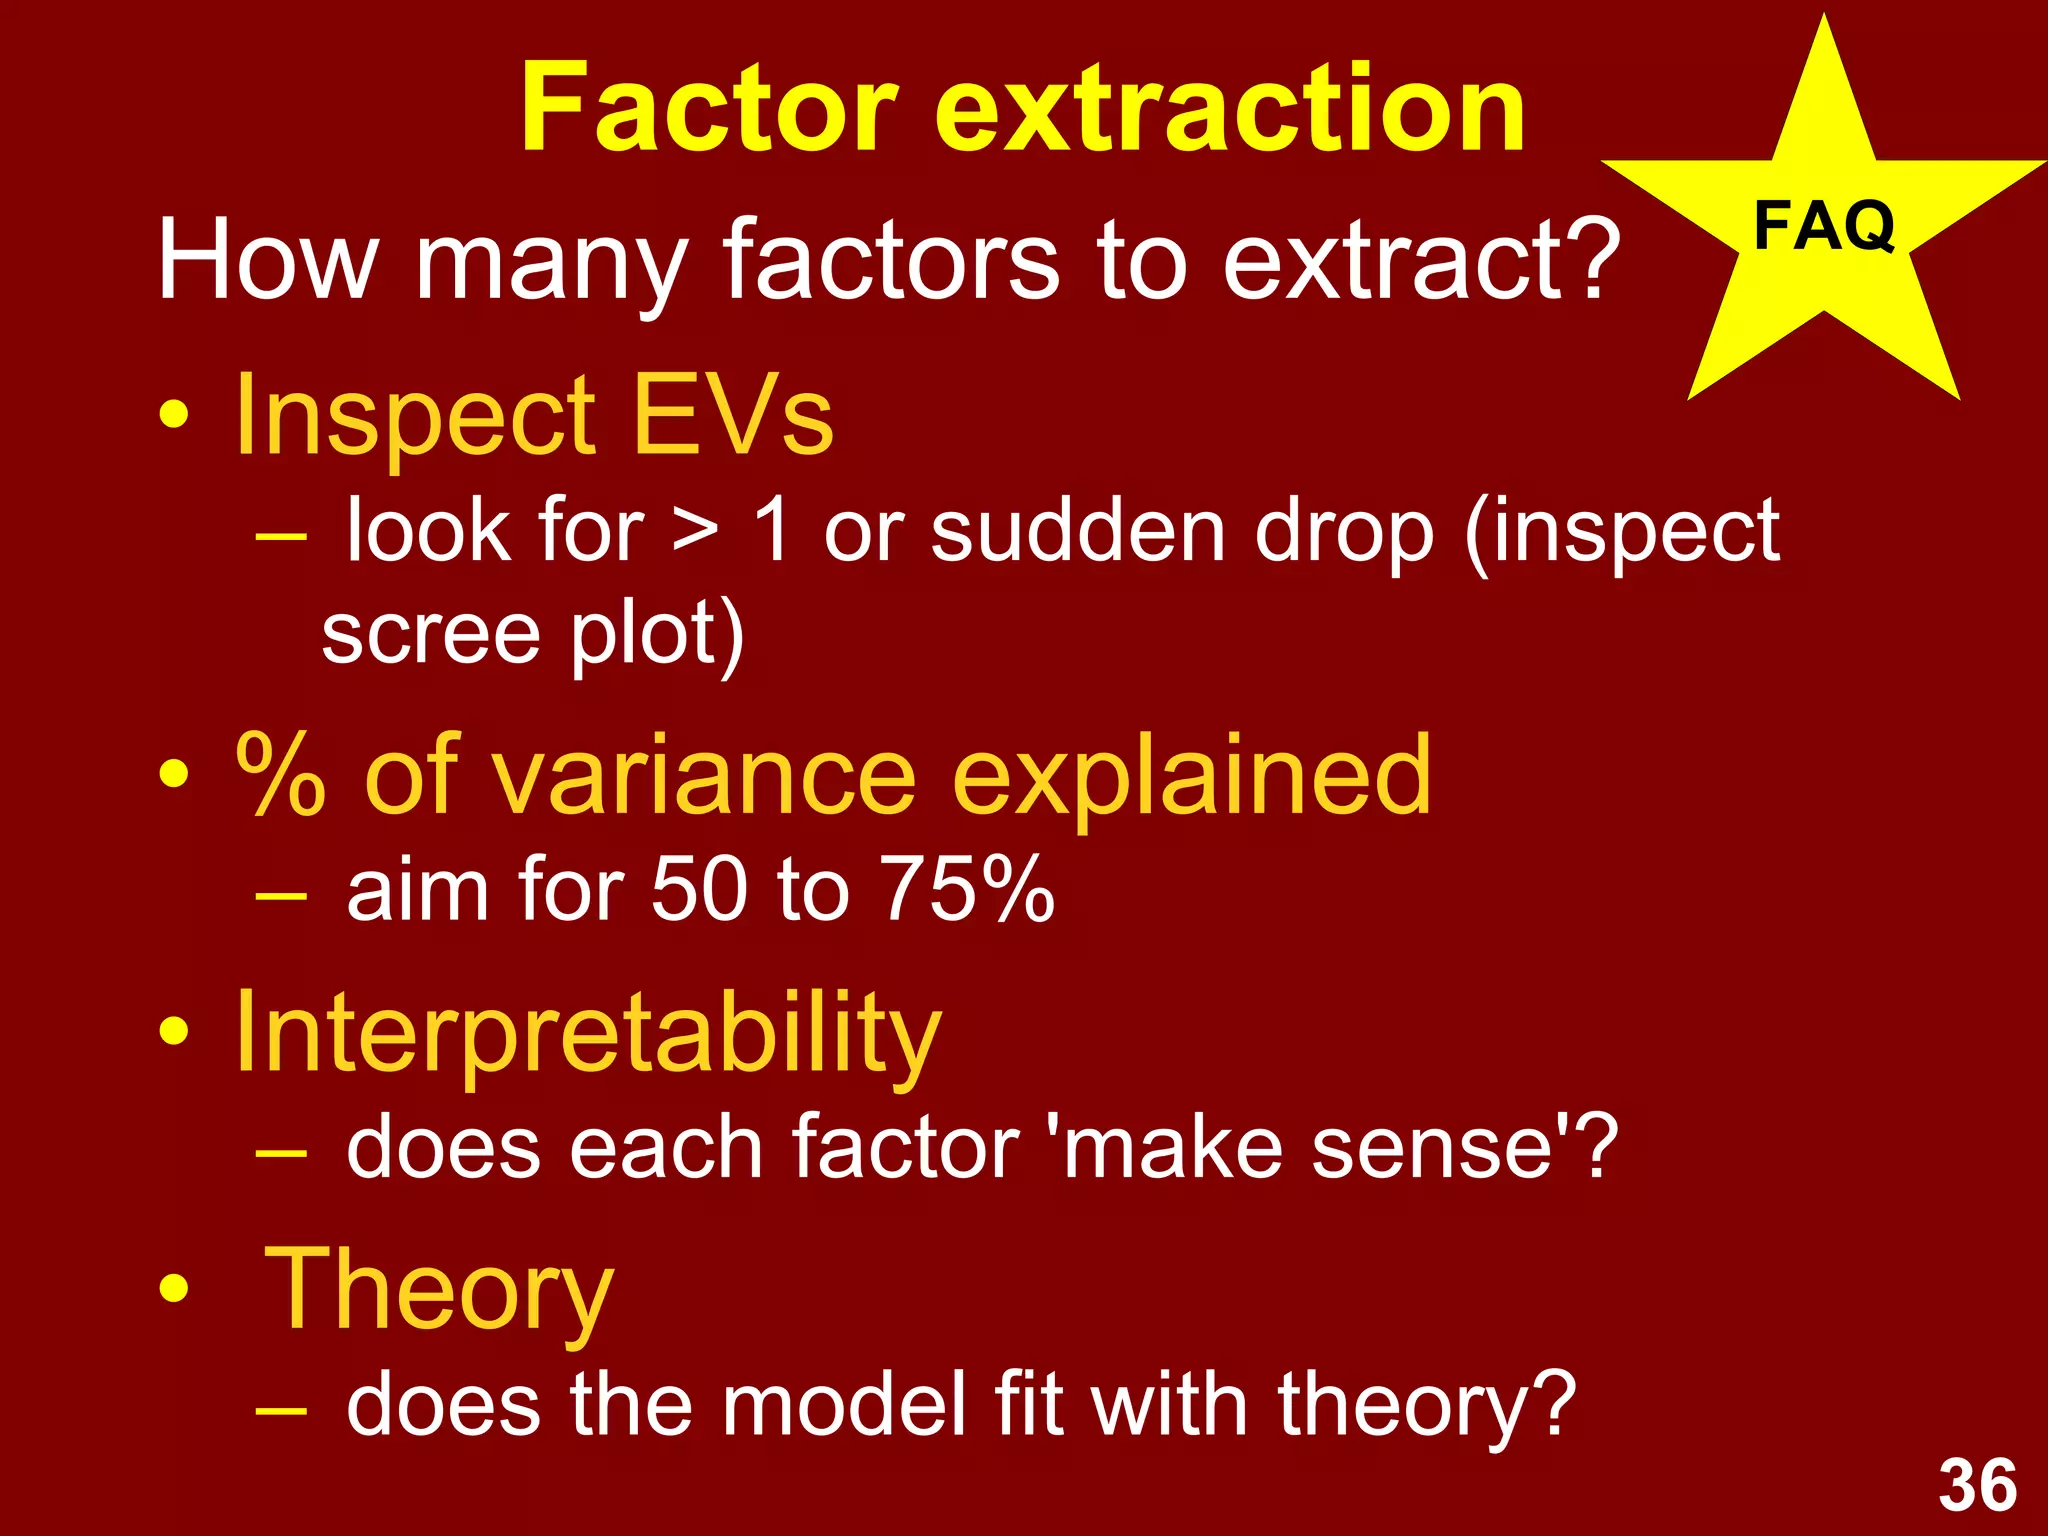
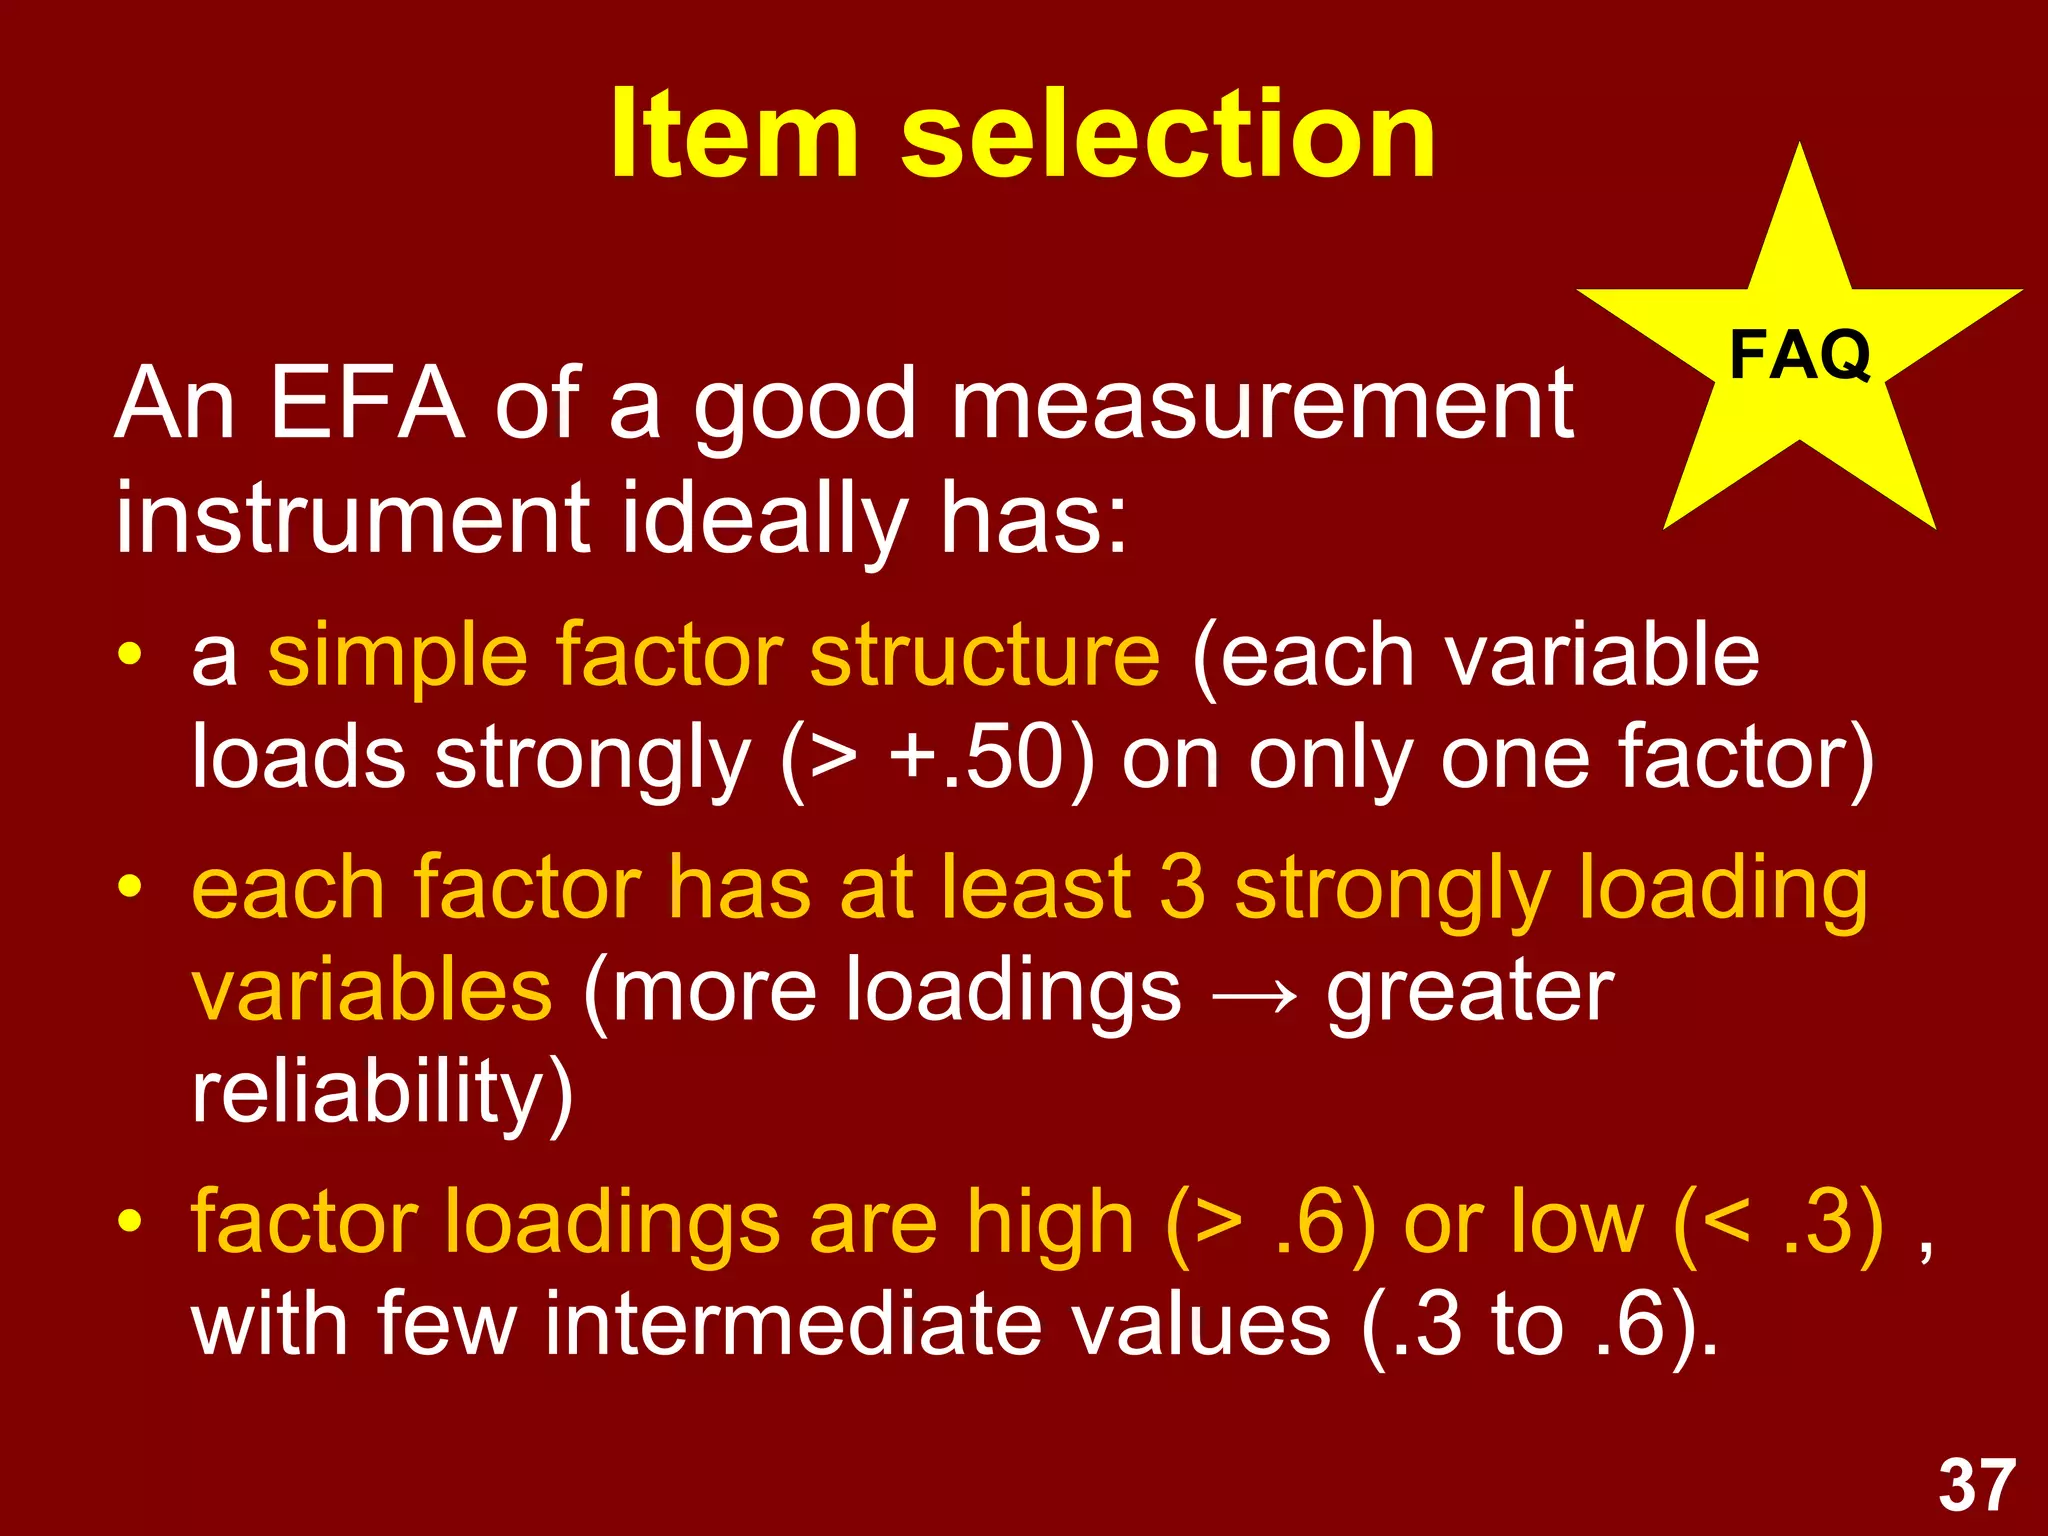
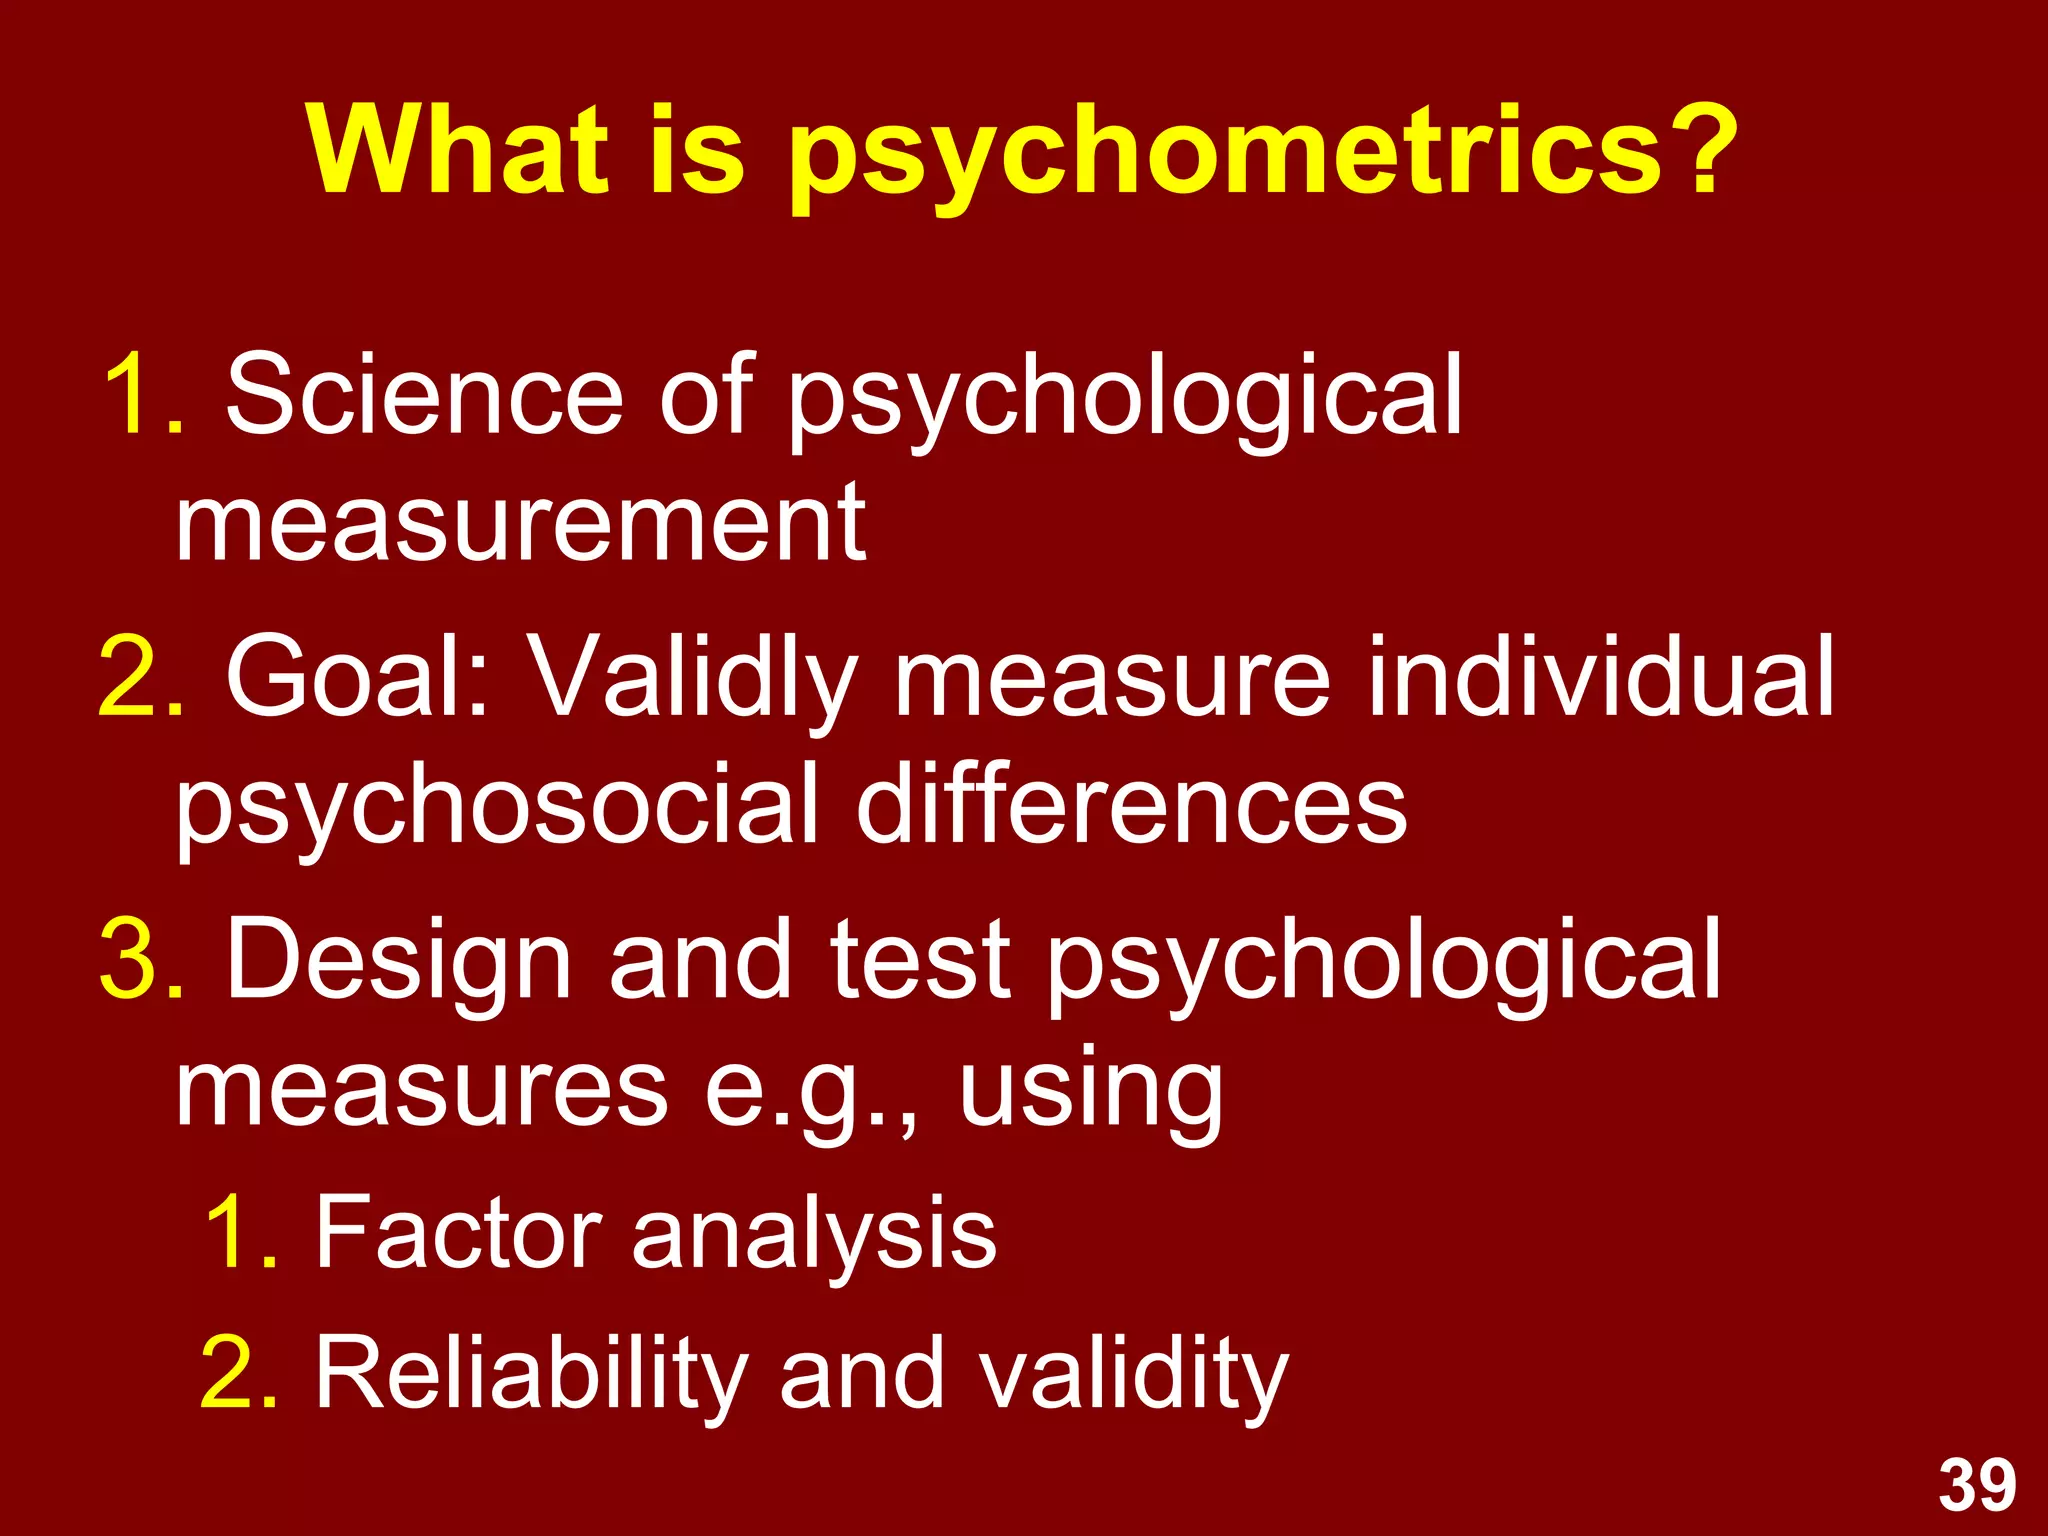
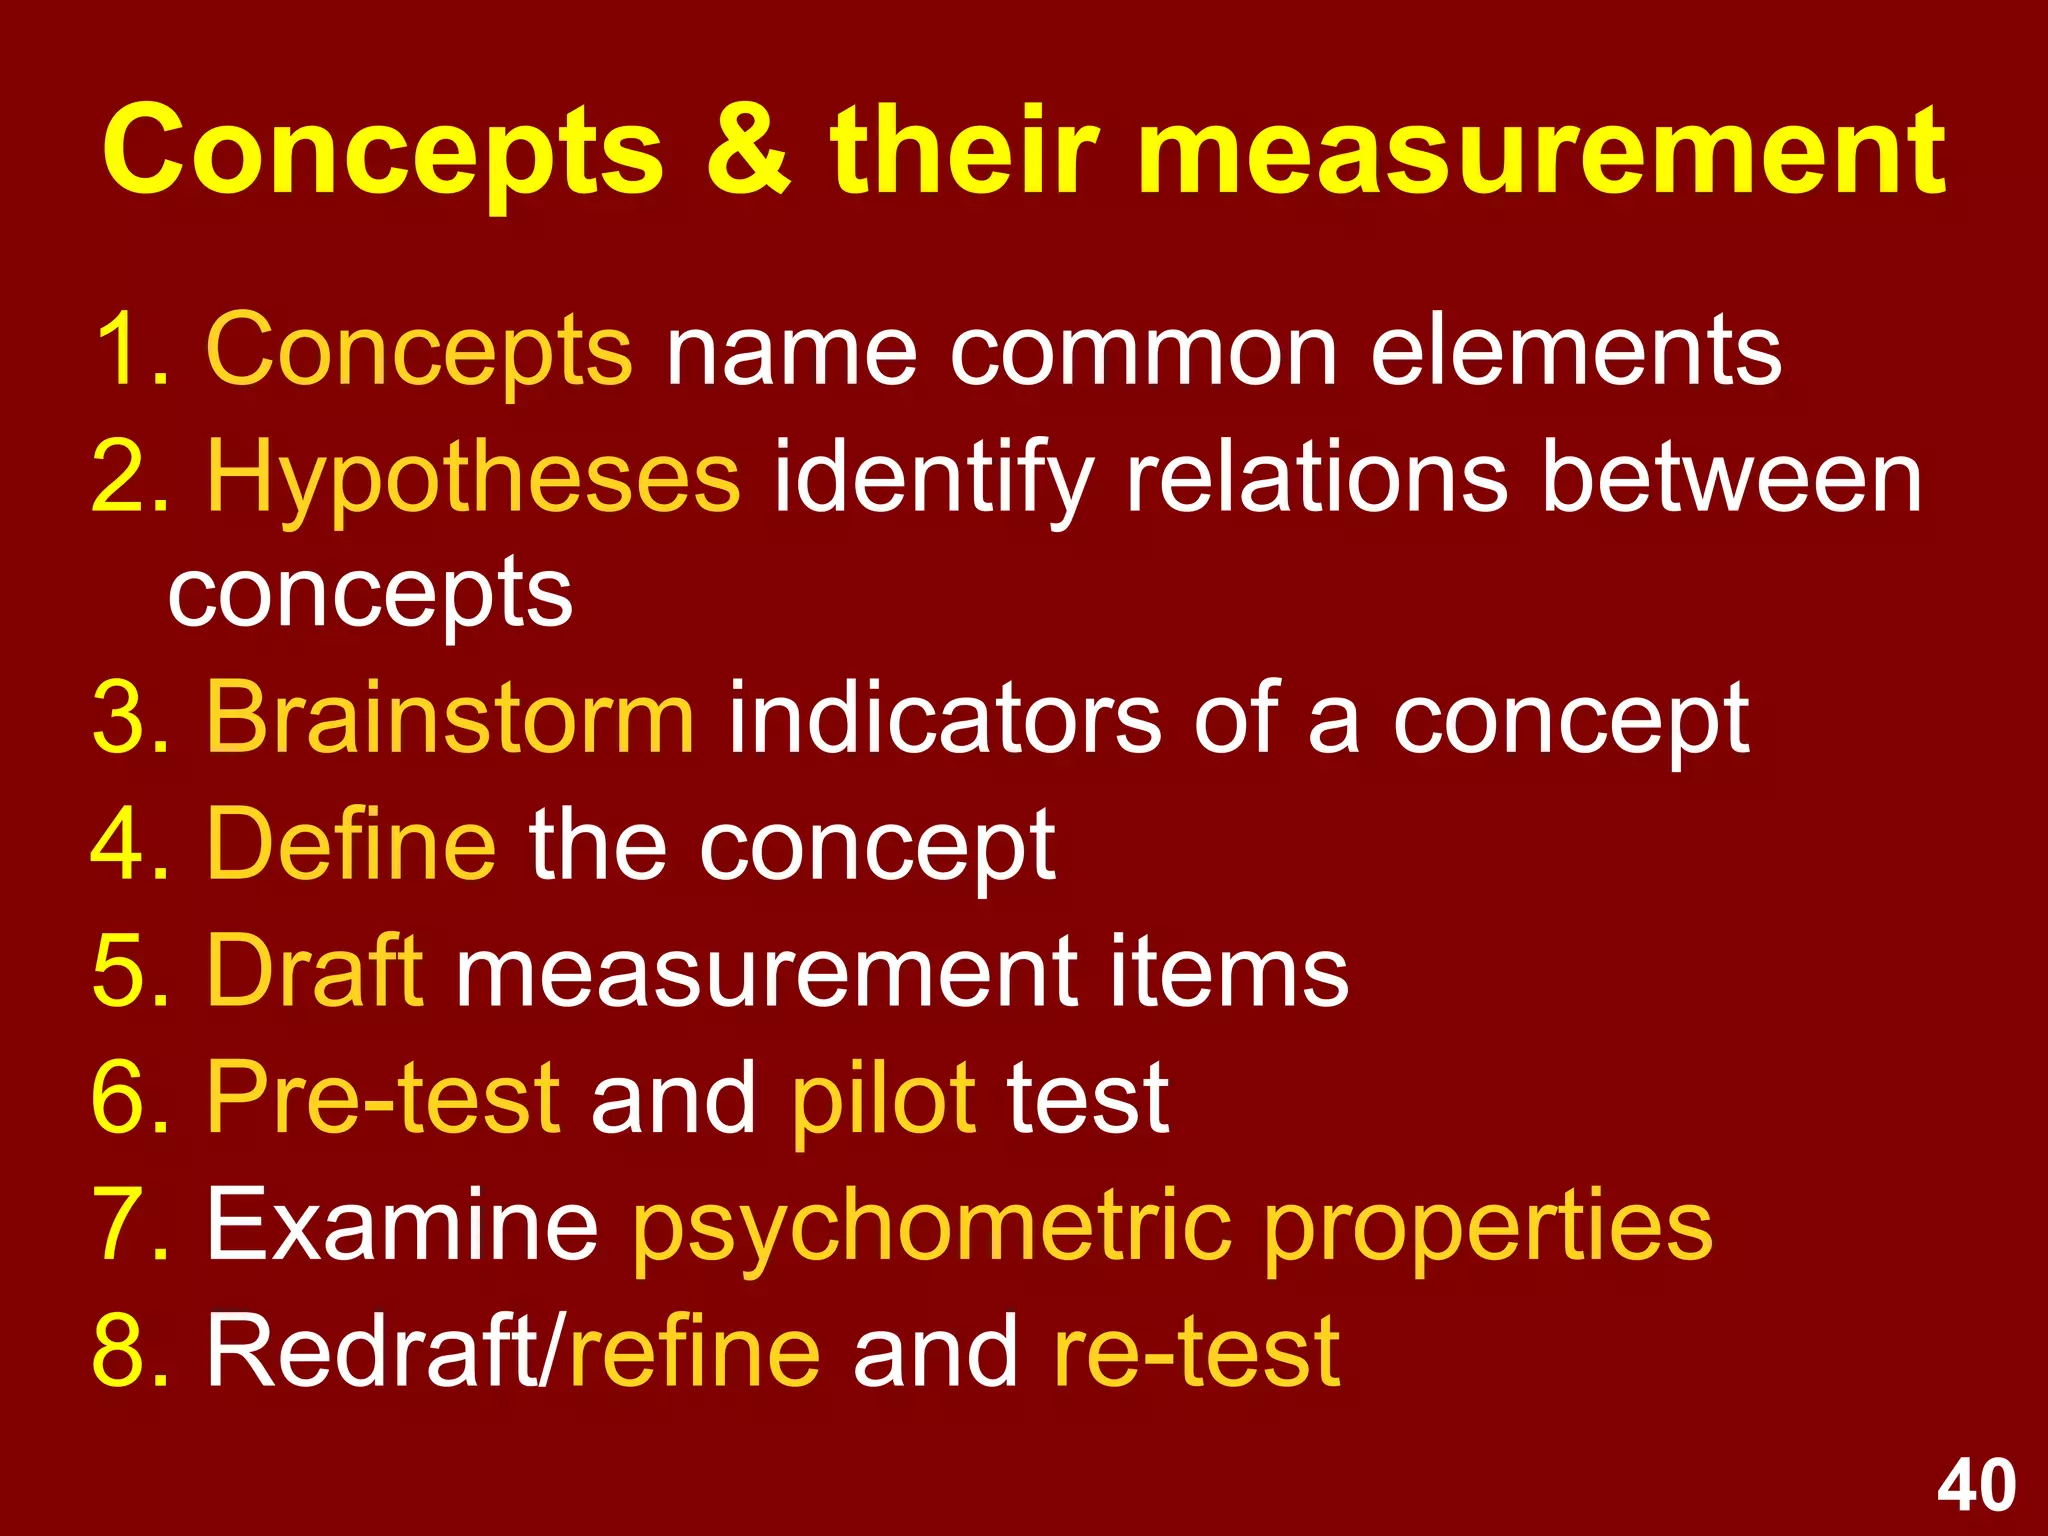
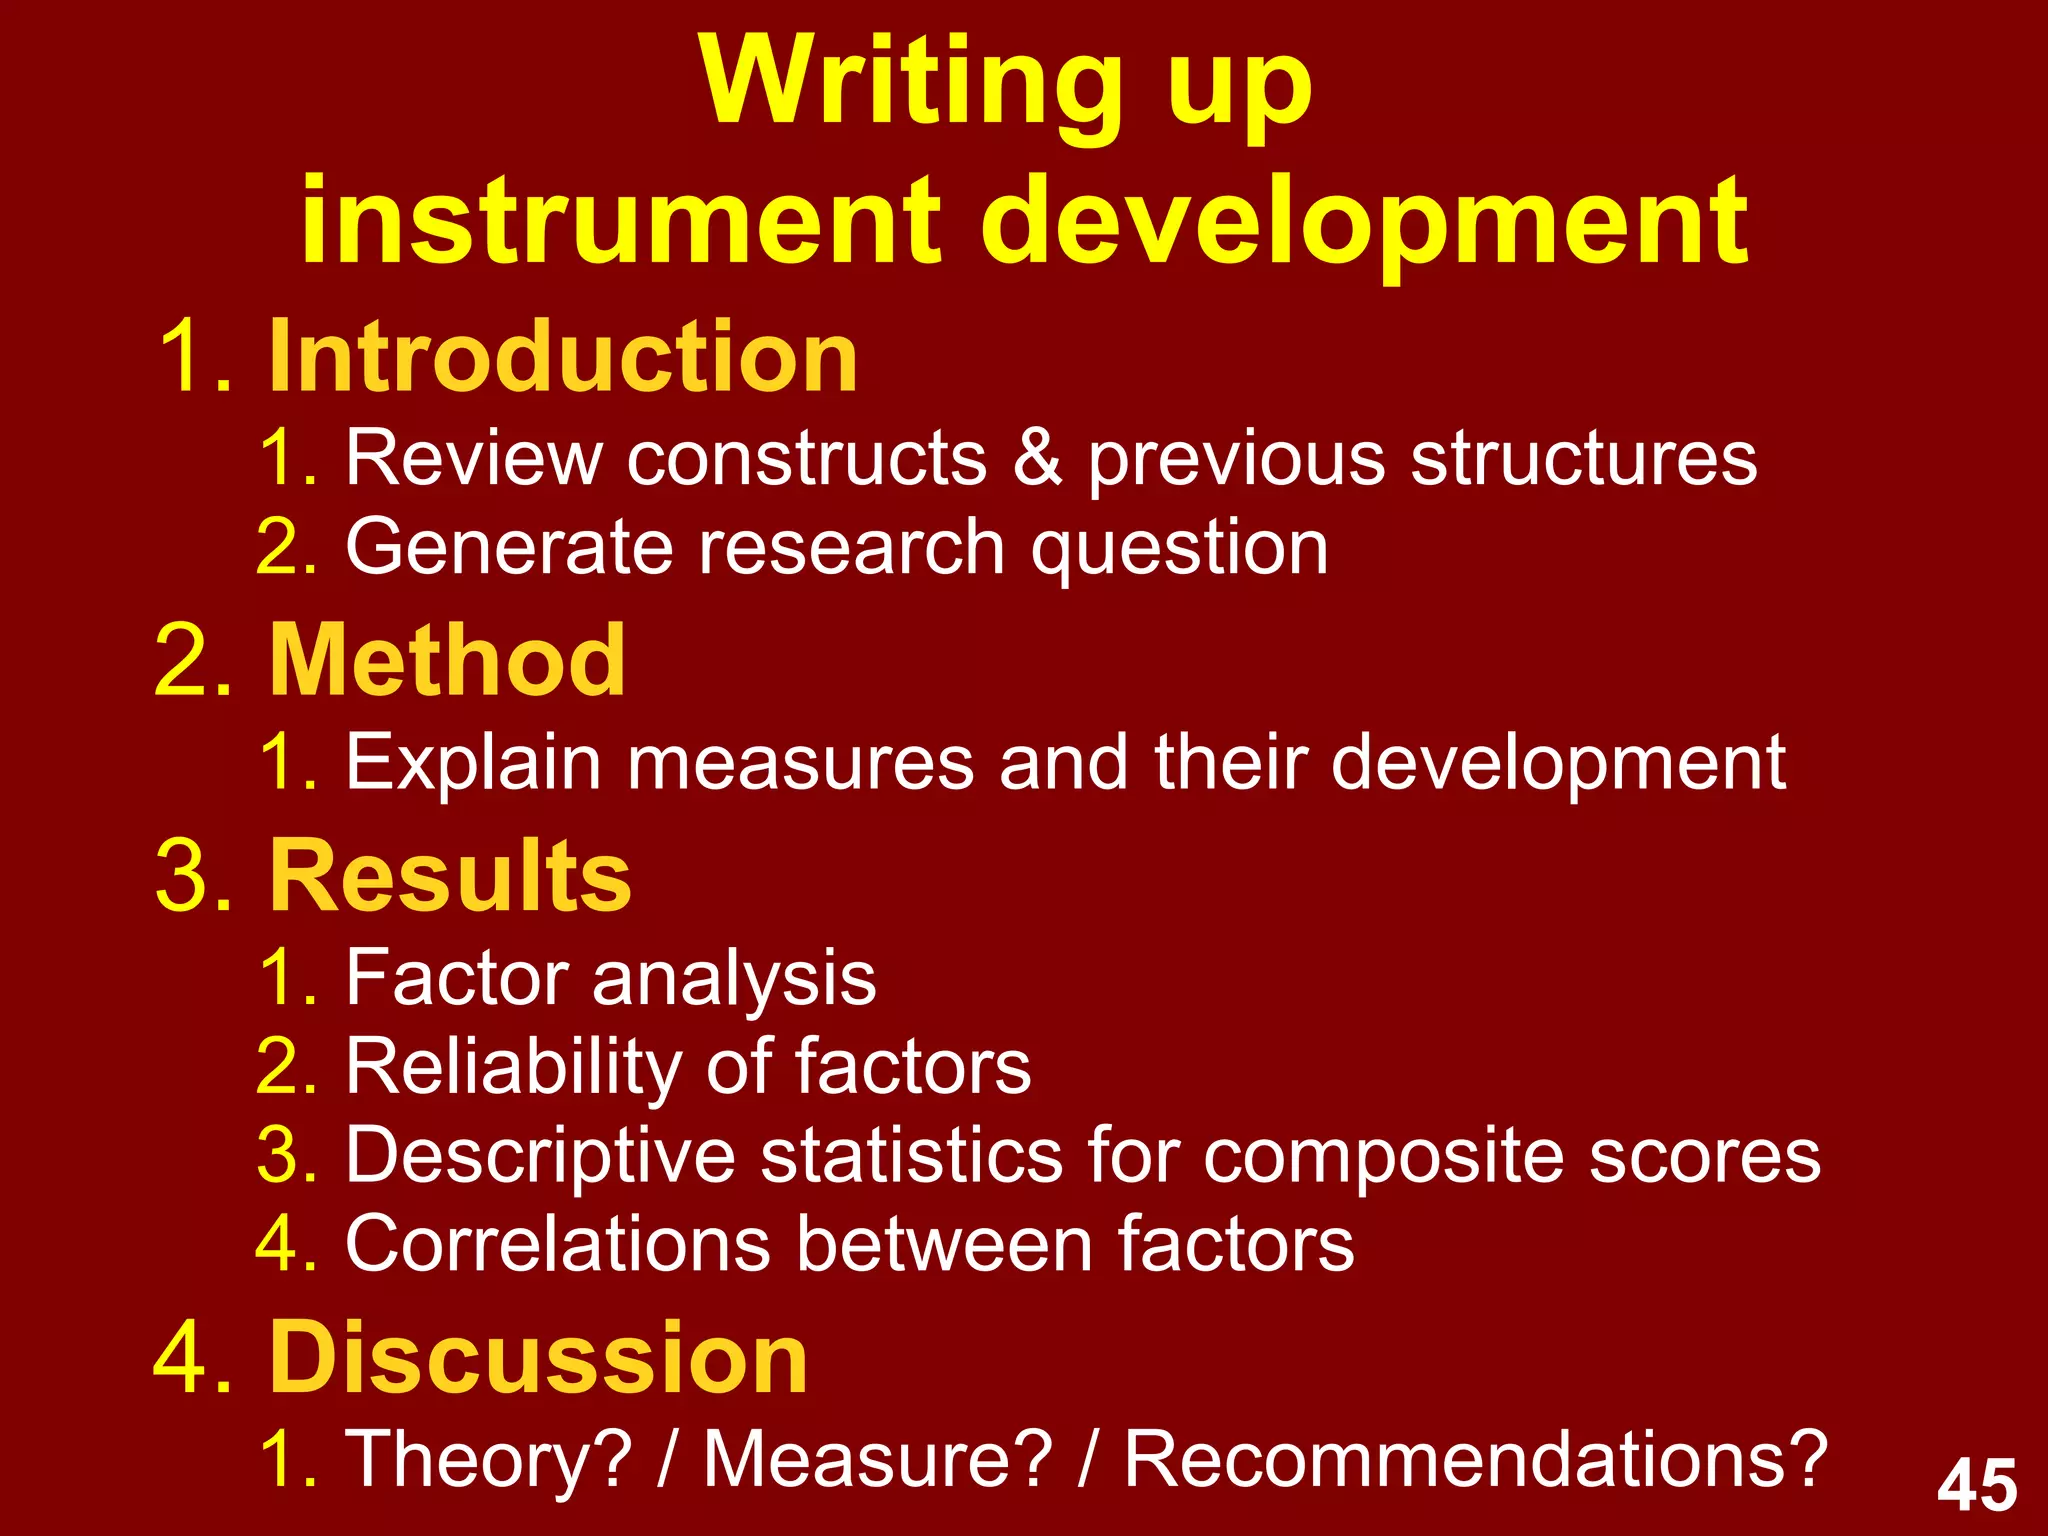
Overview of factor analysis processes, assumptions, types, and psychometric instrument development.
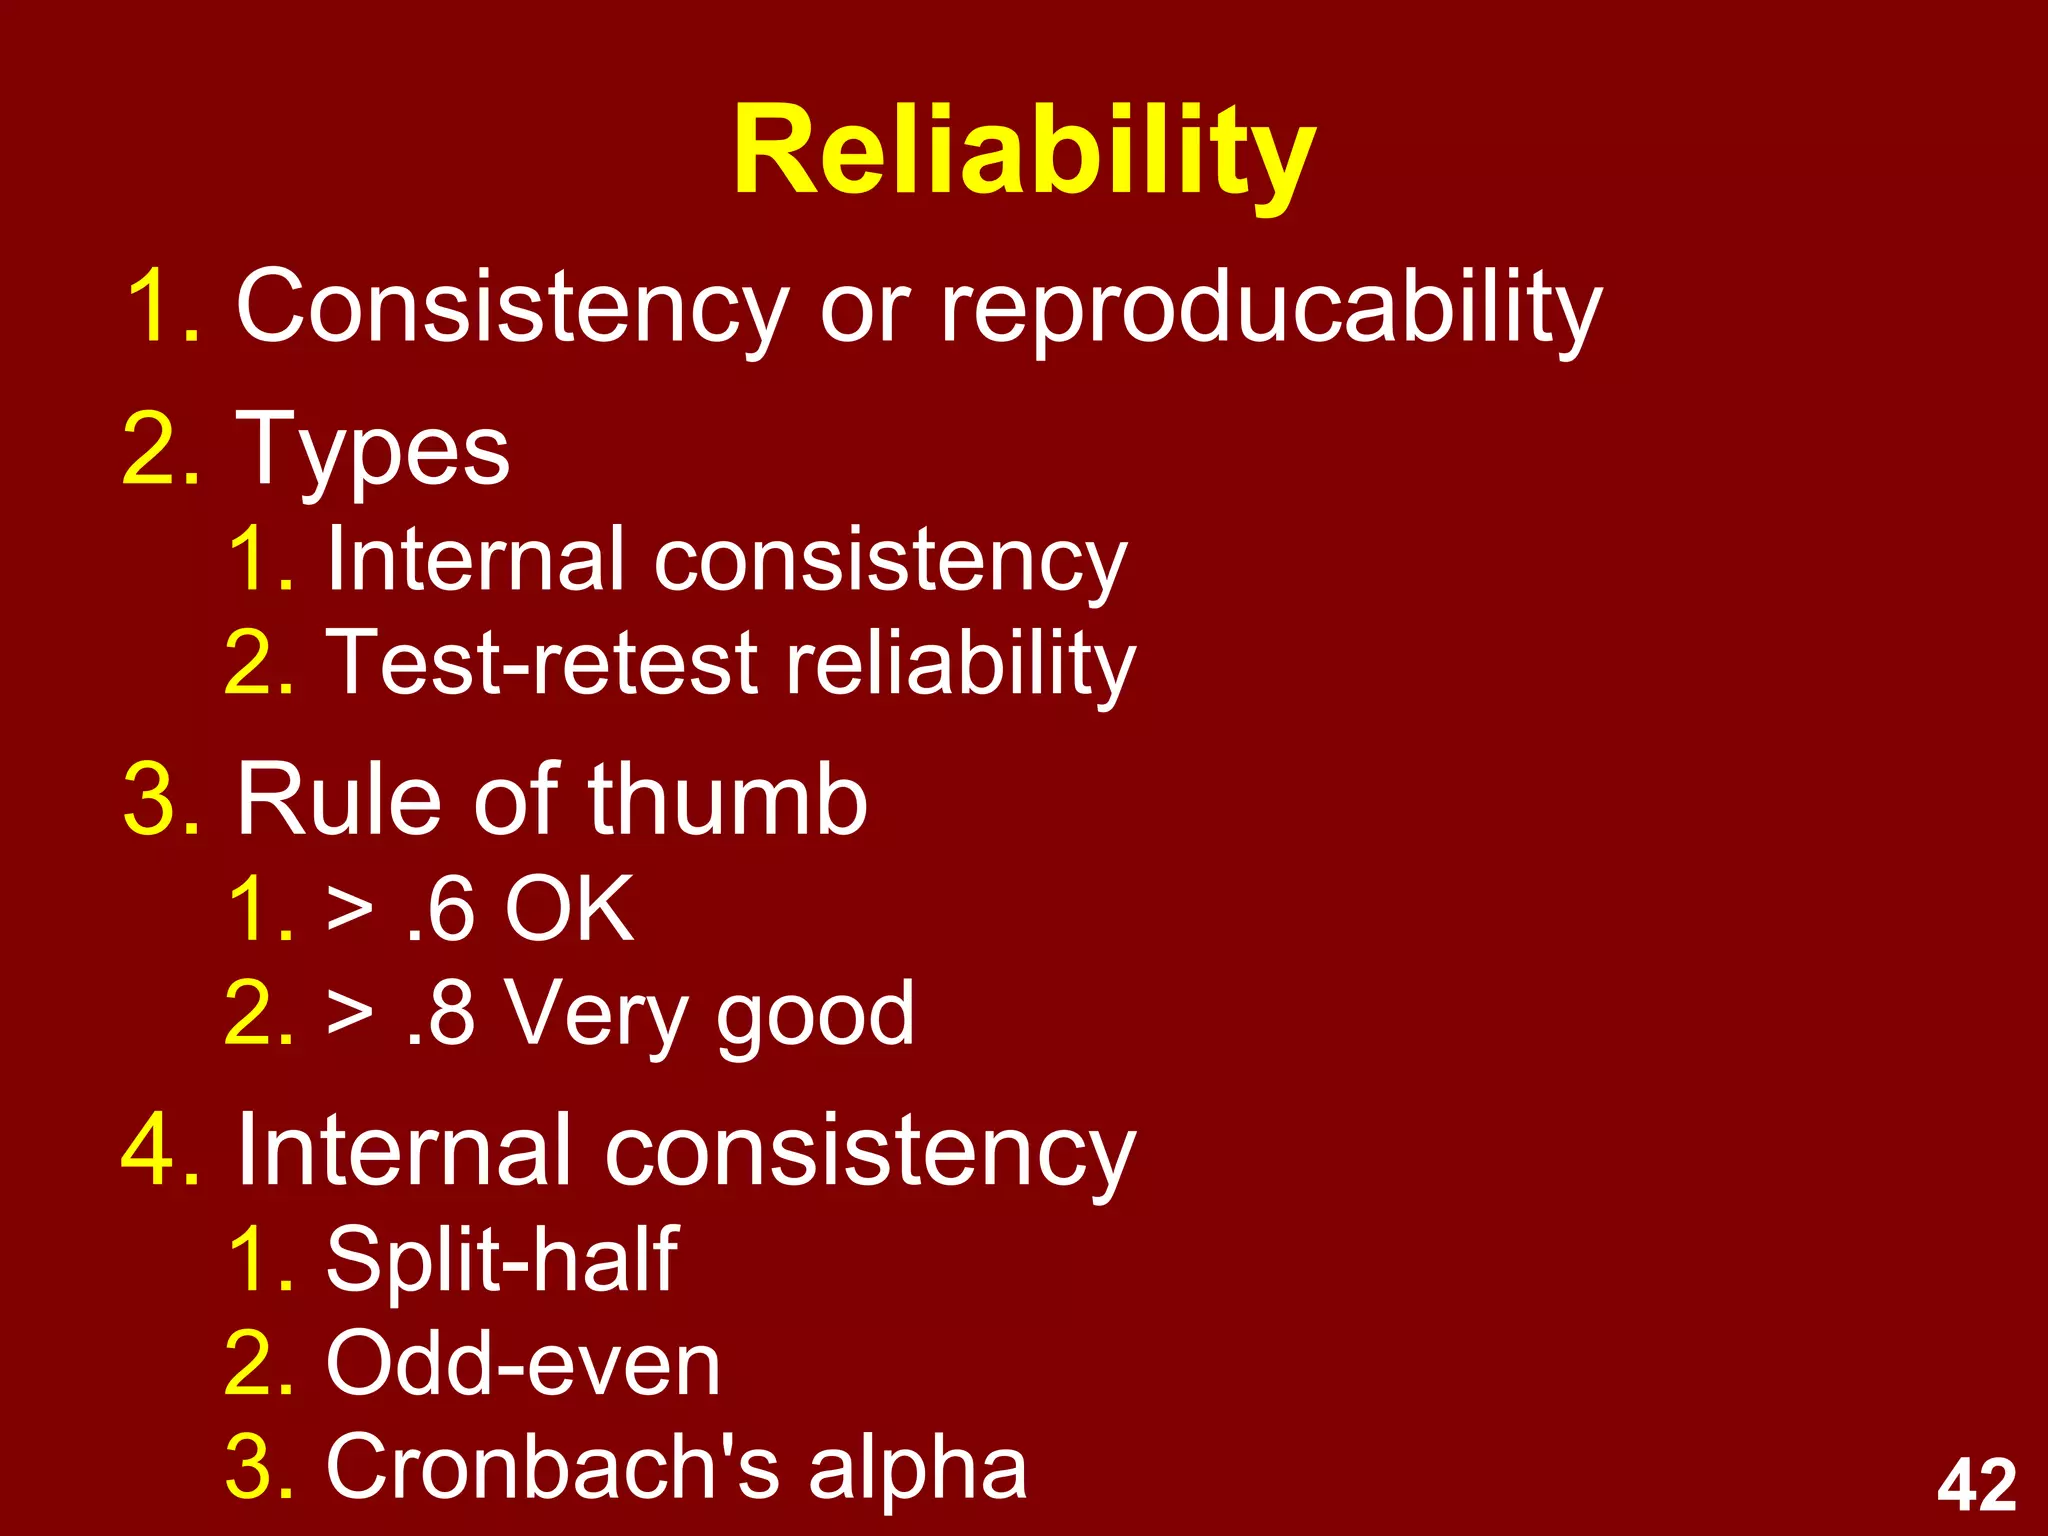
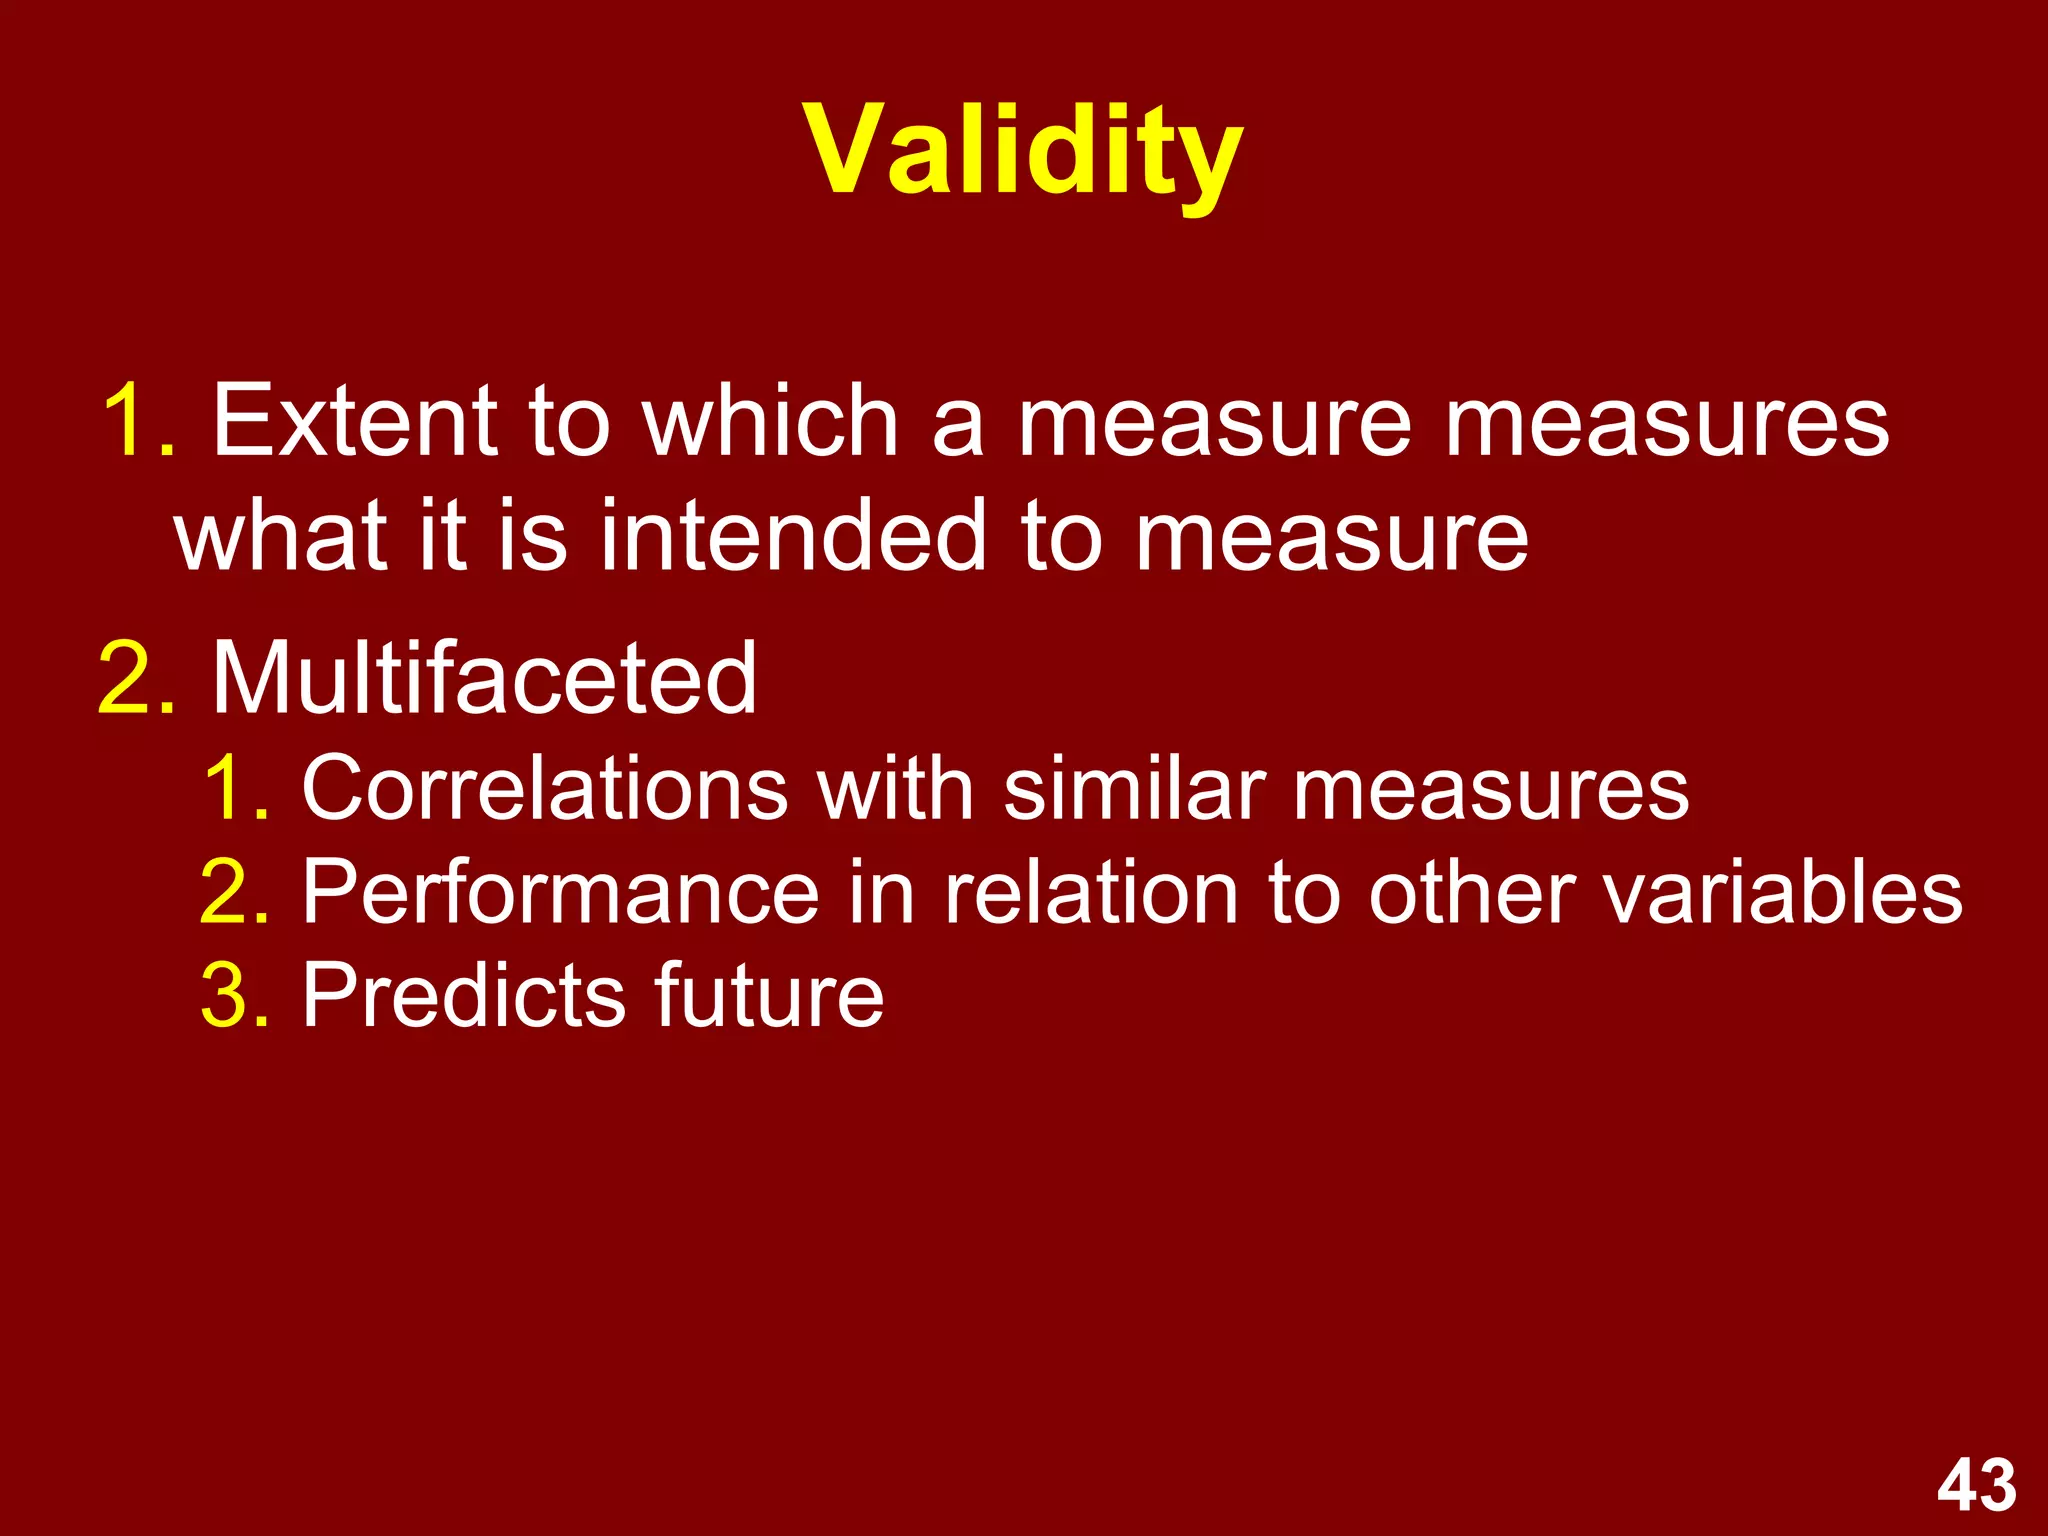
Discusses psychometric properties, common errors, reliability types, and validity measures.
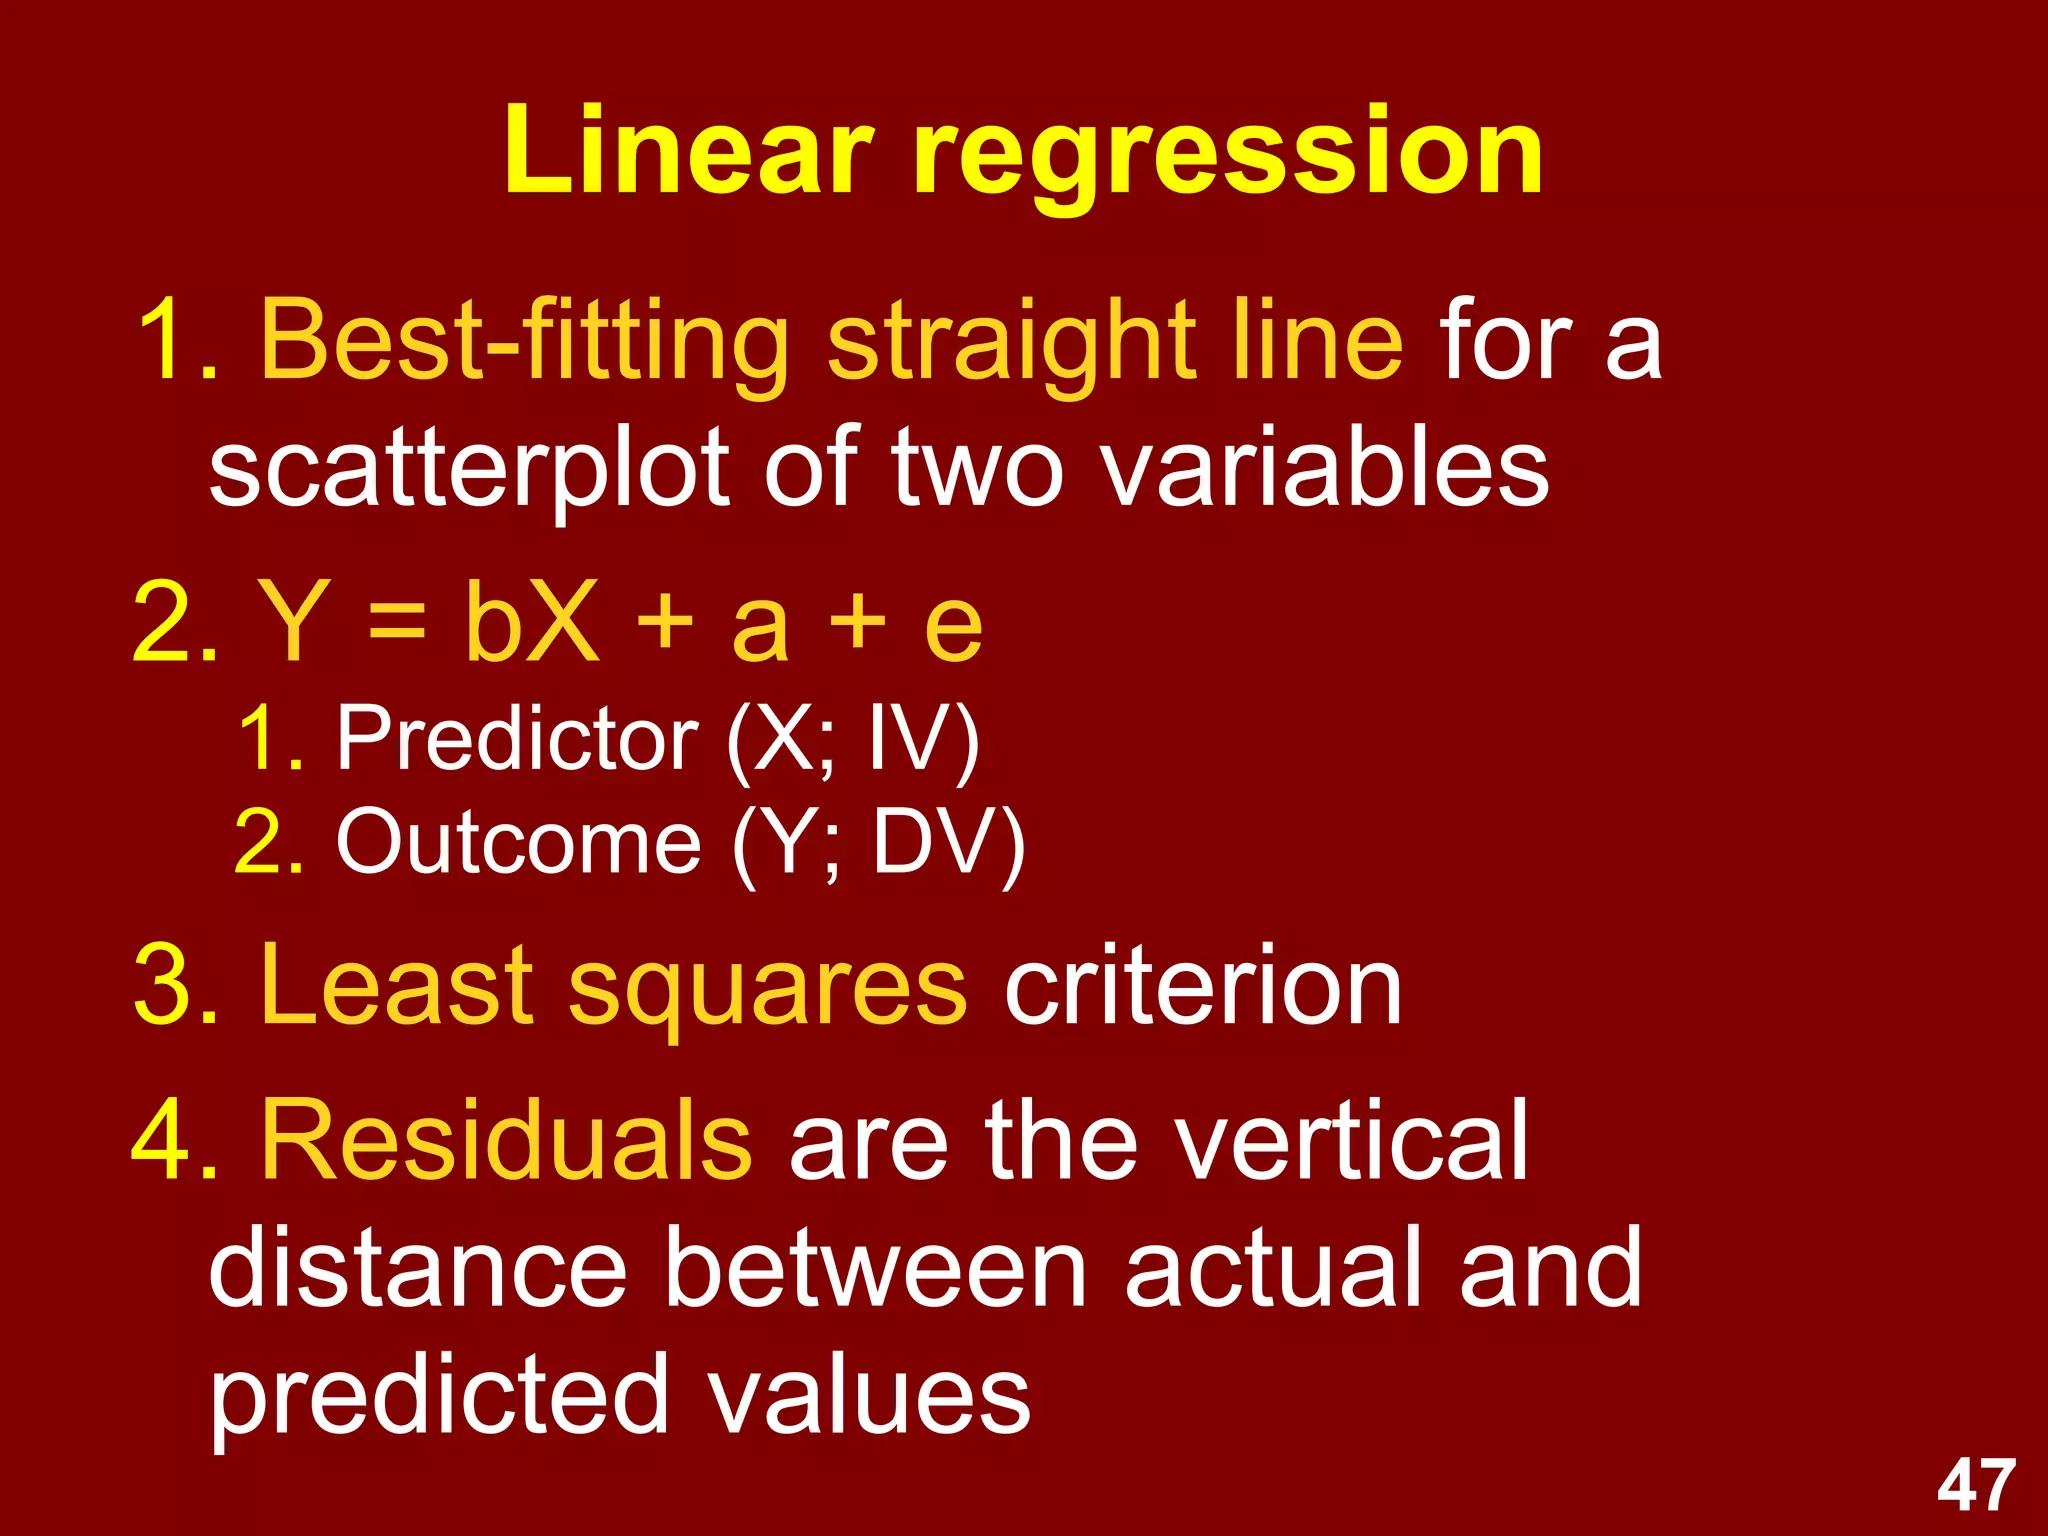
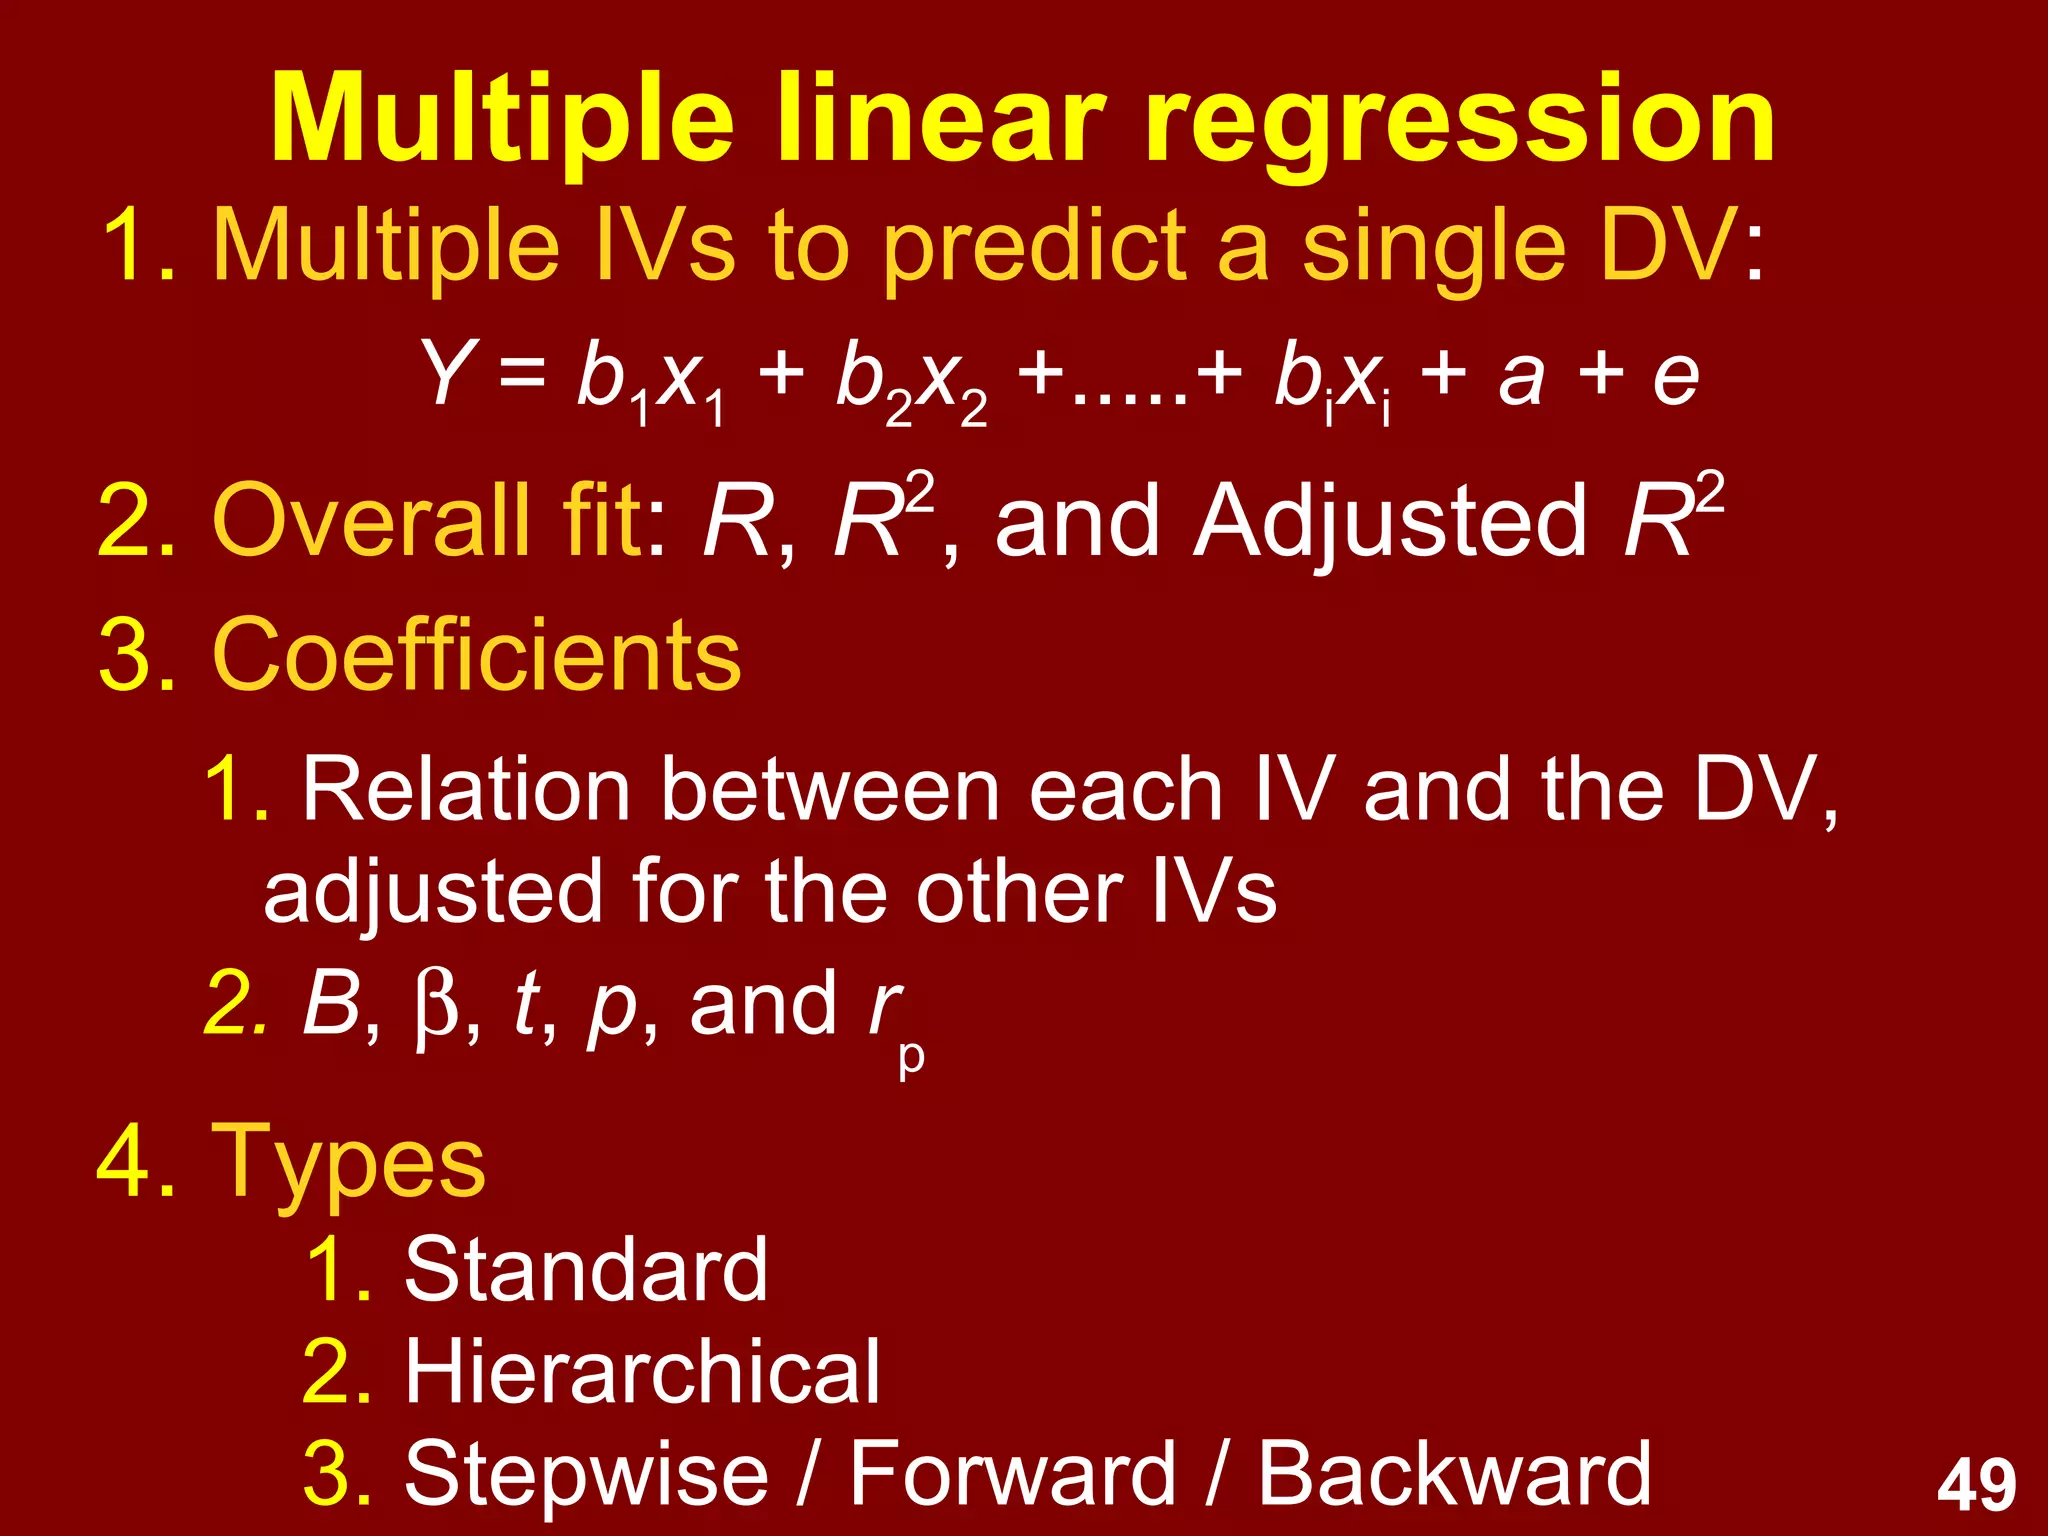
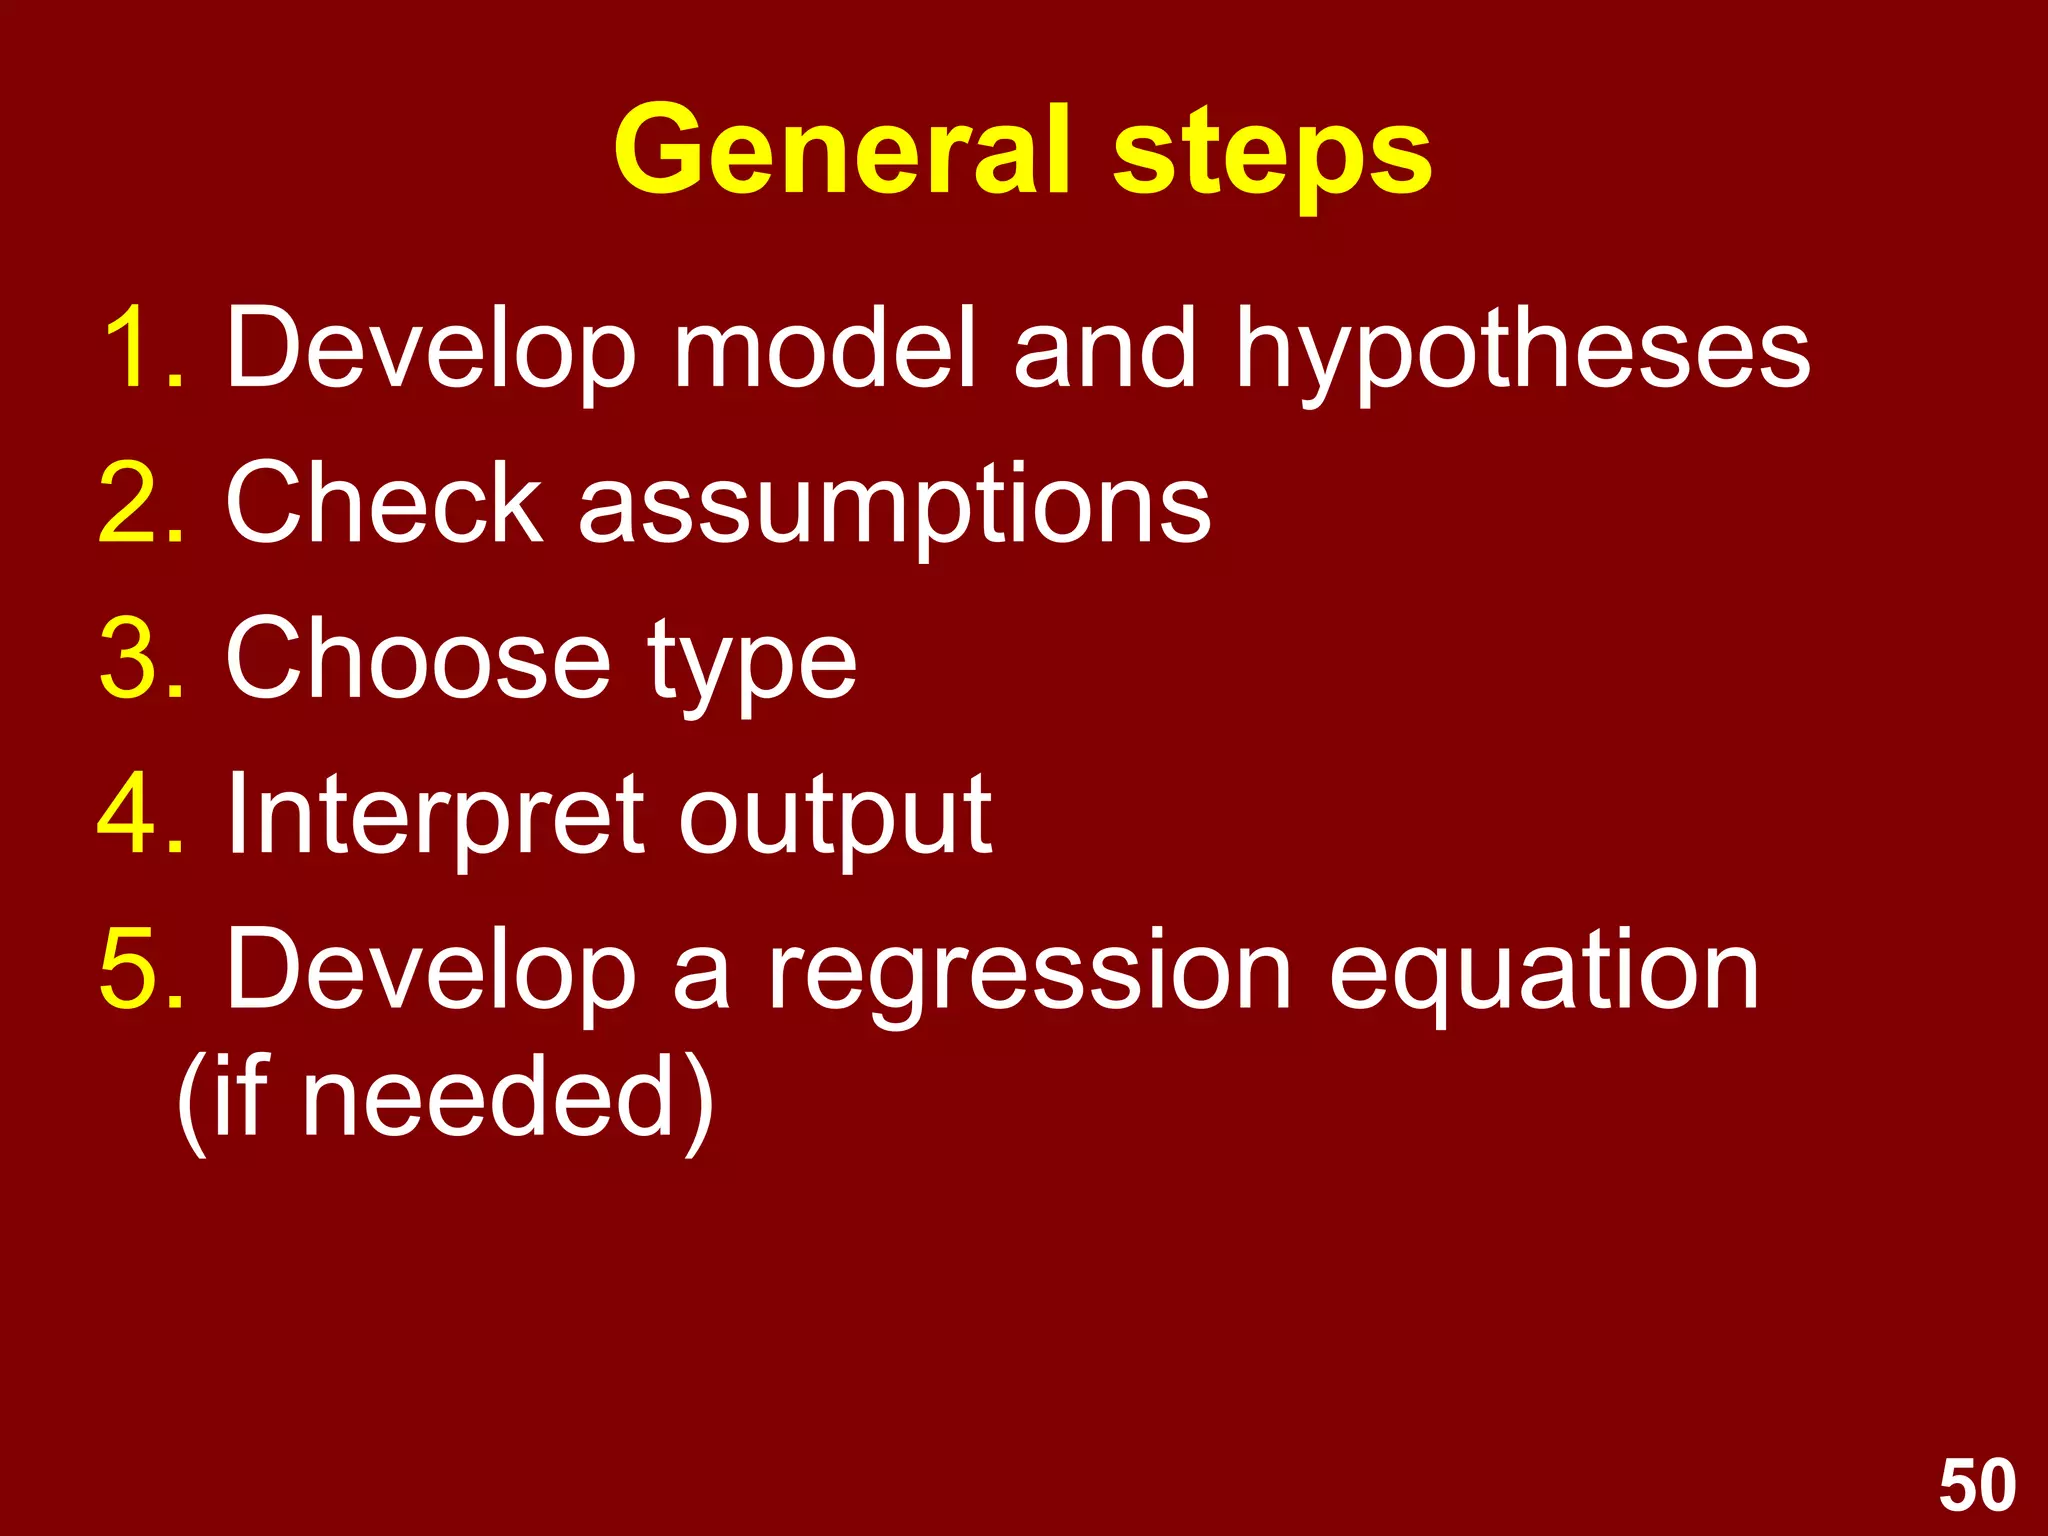
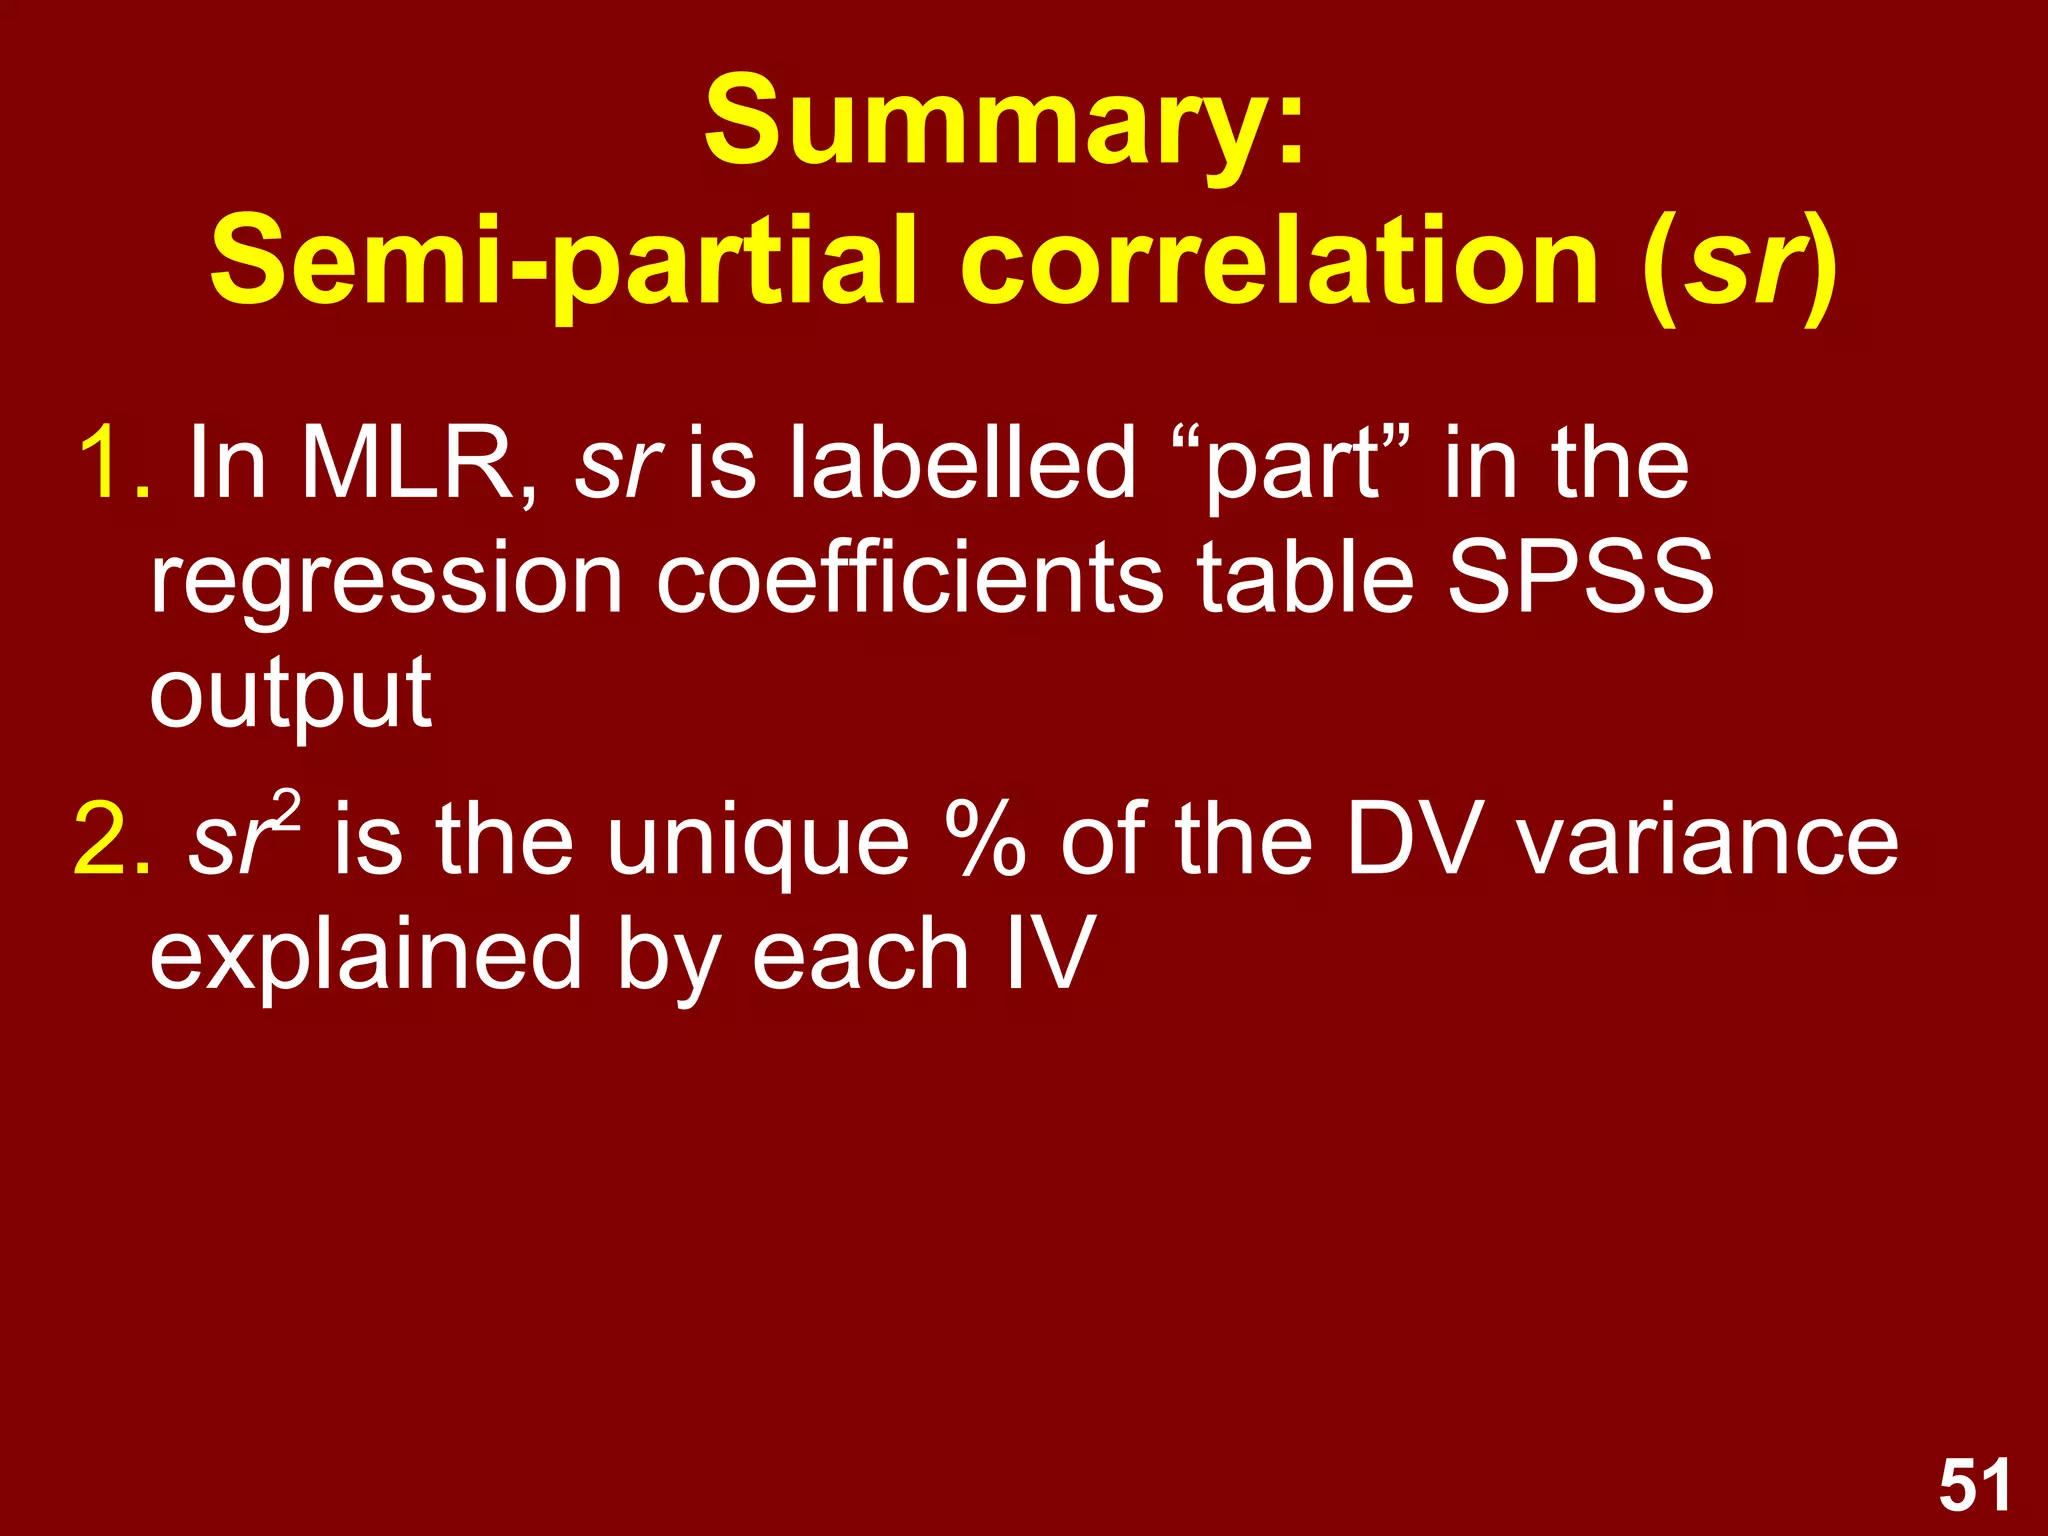
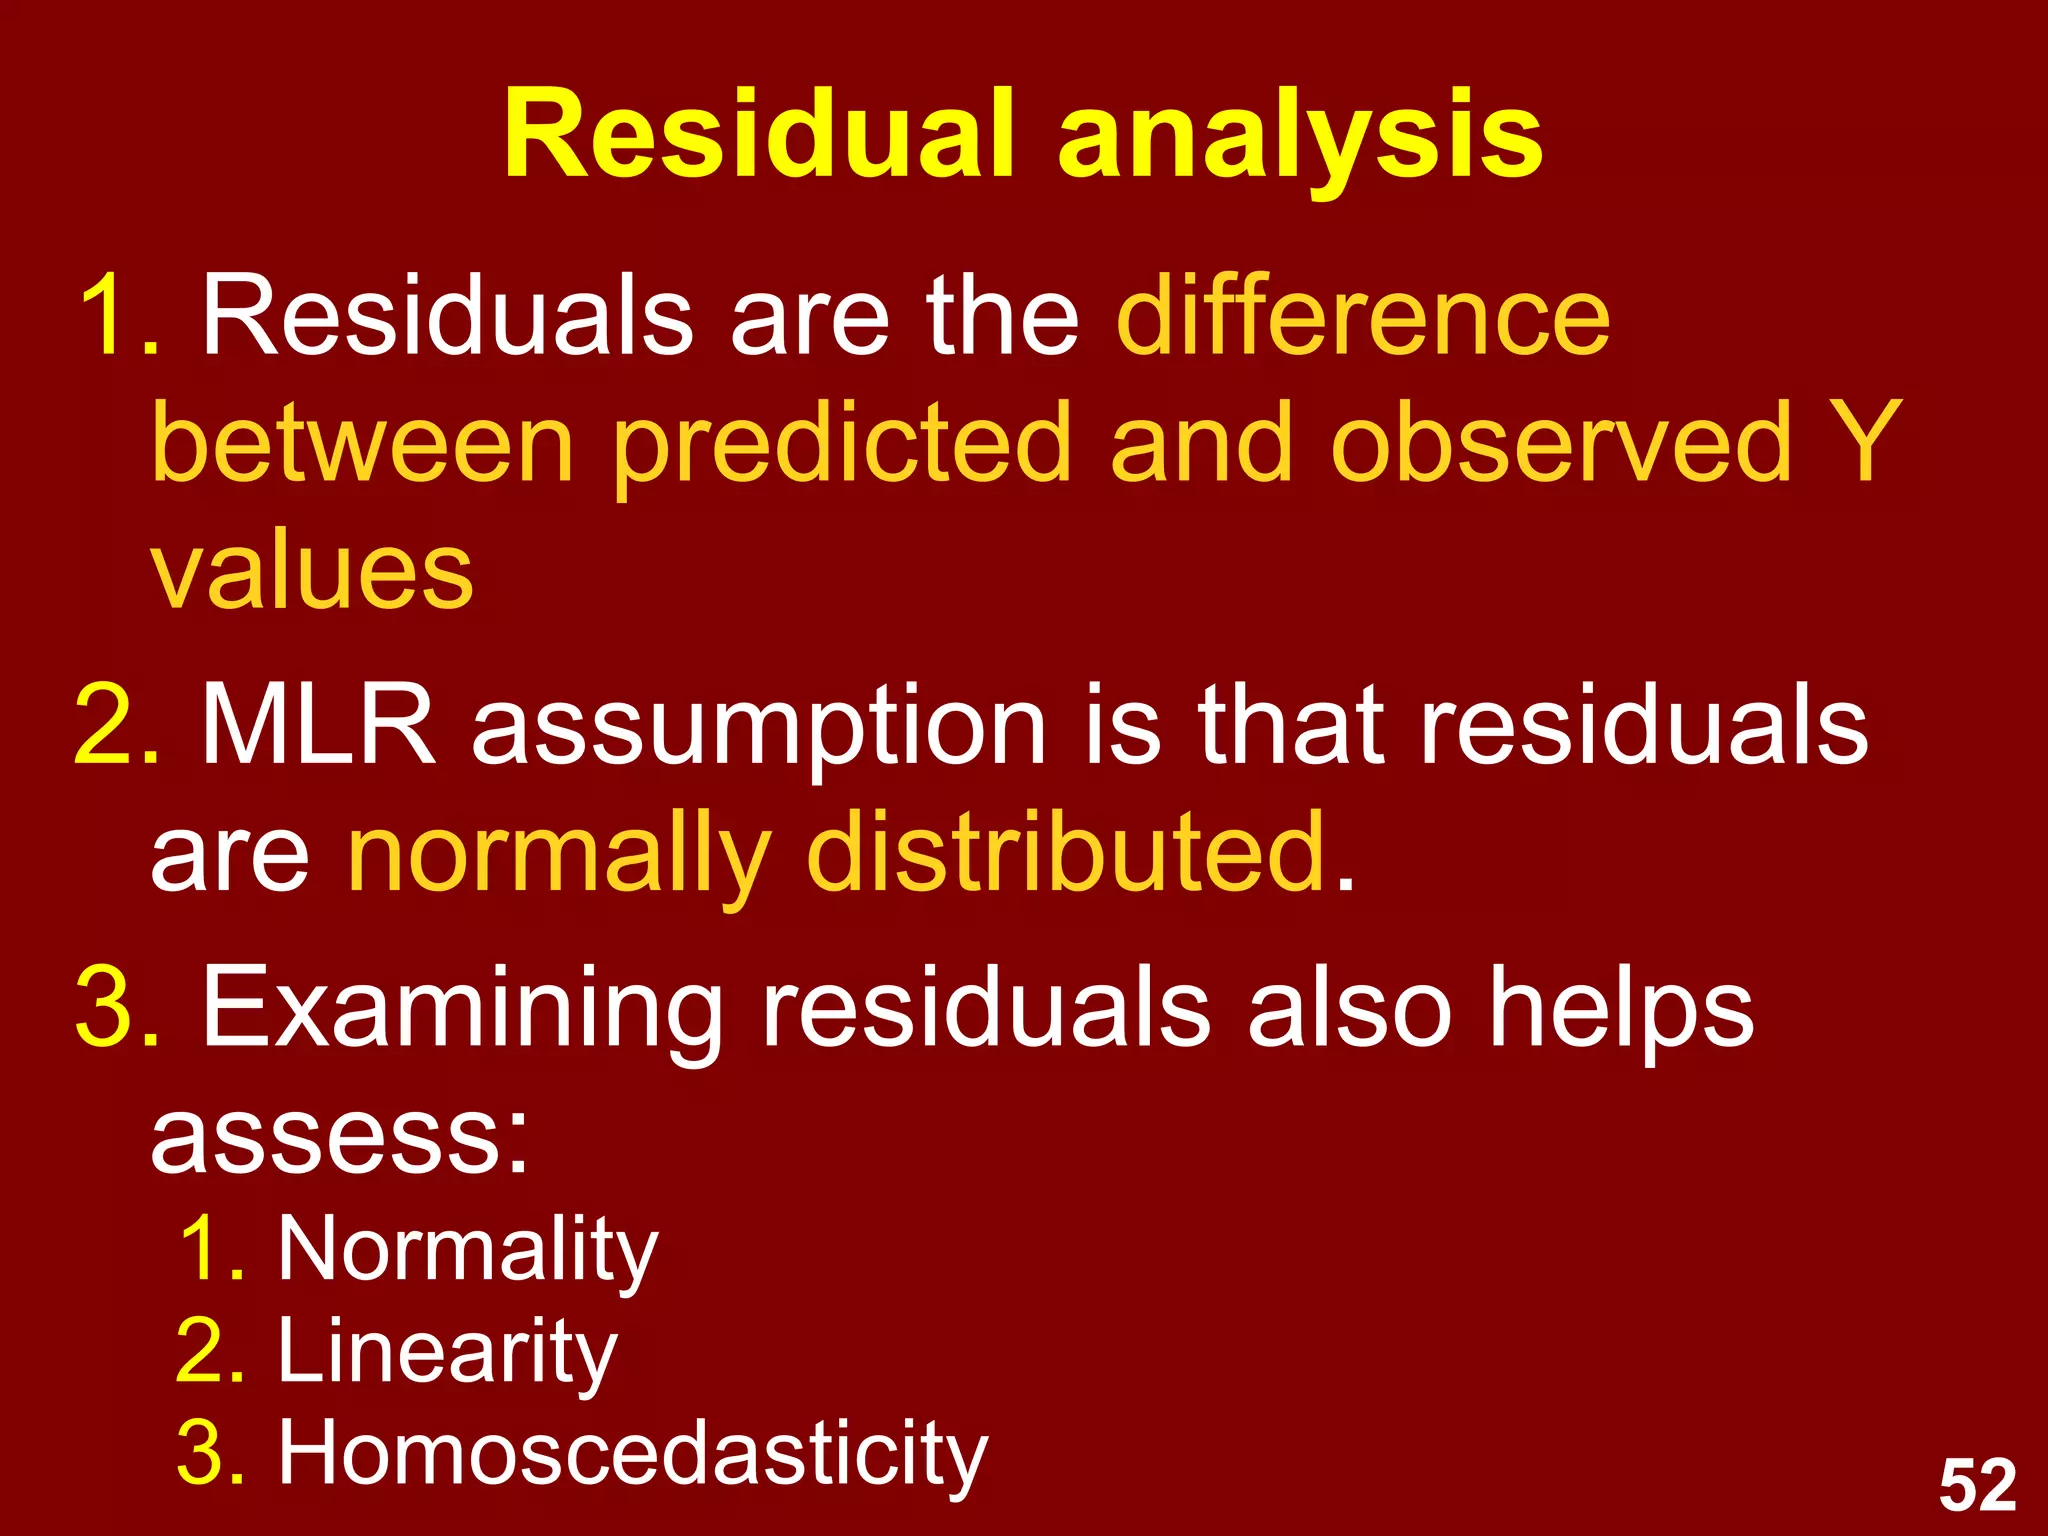
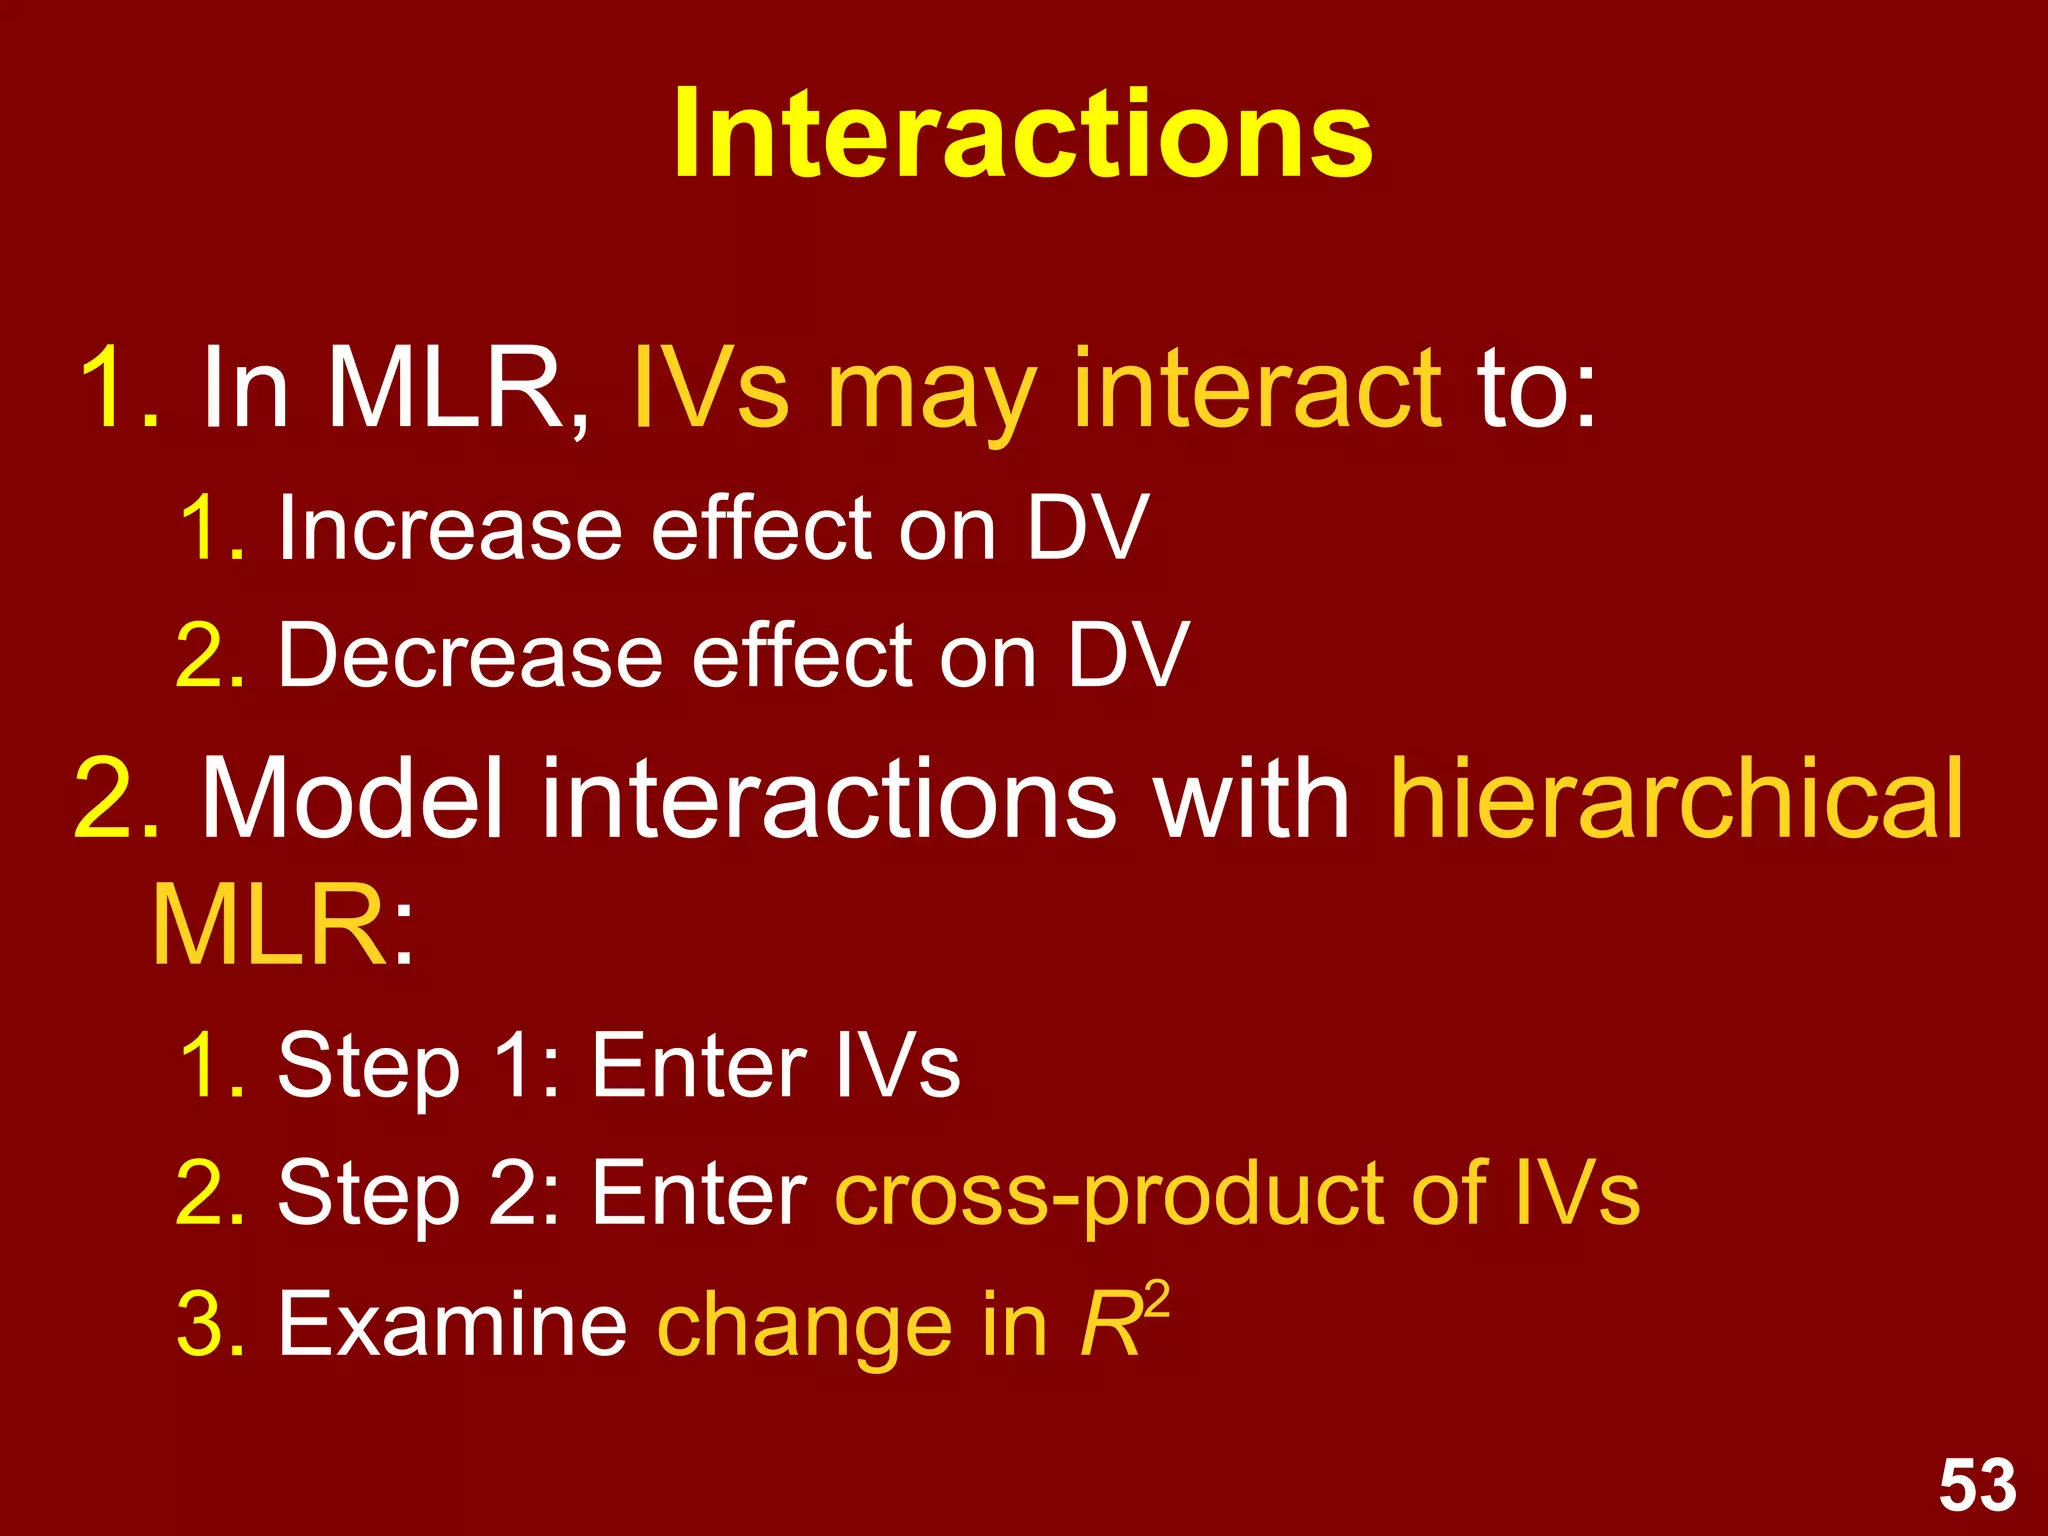
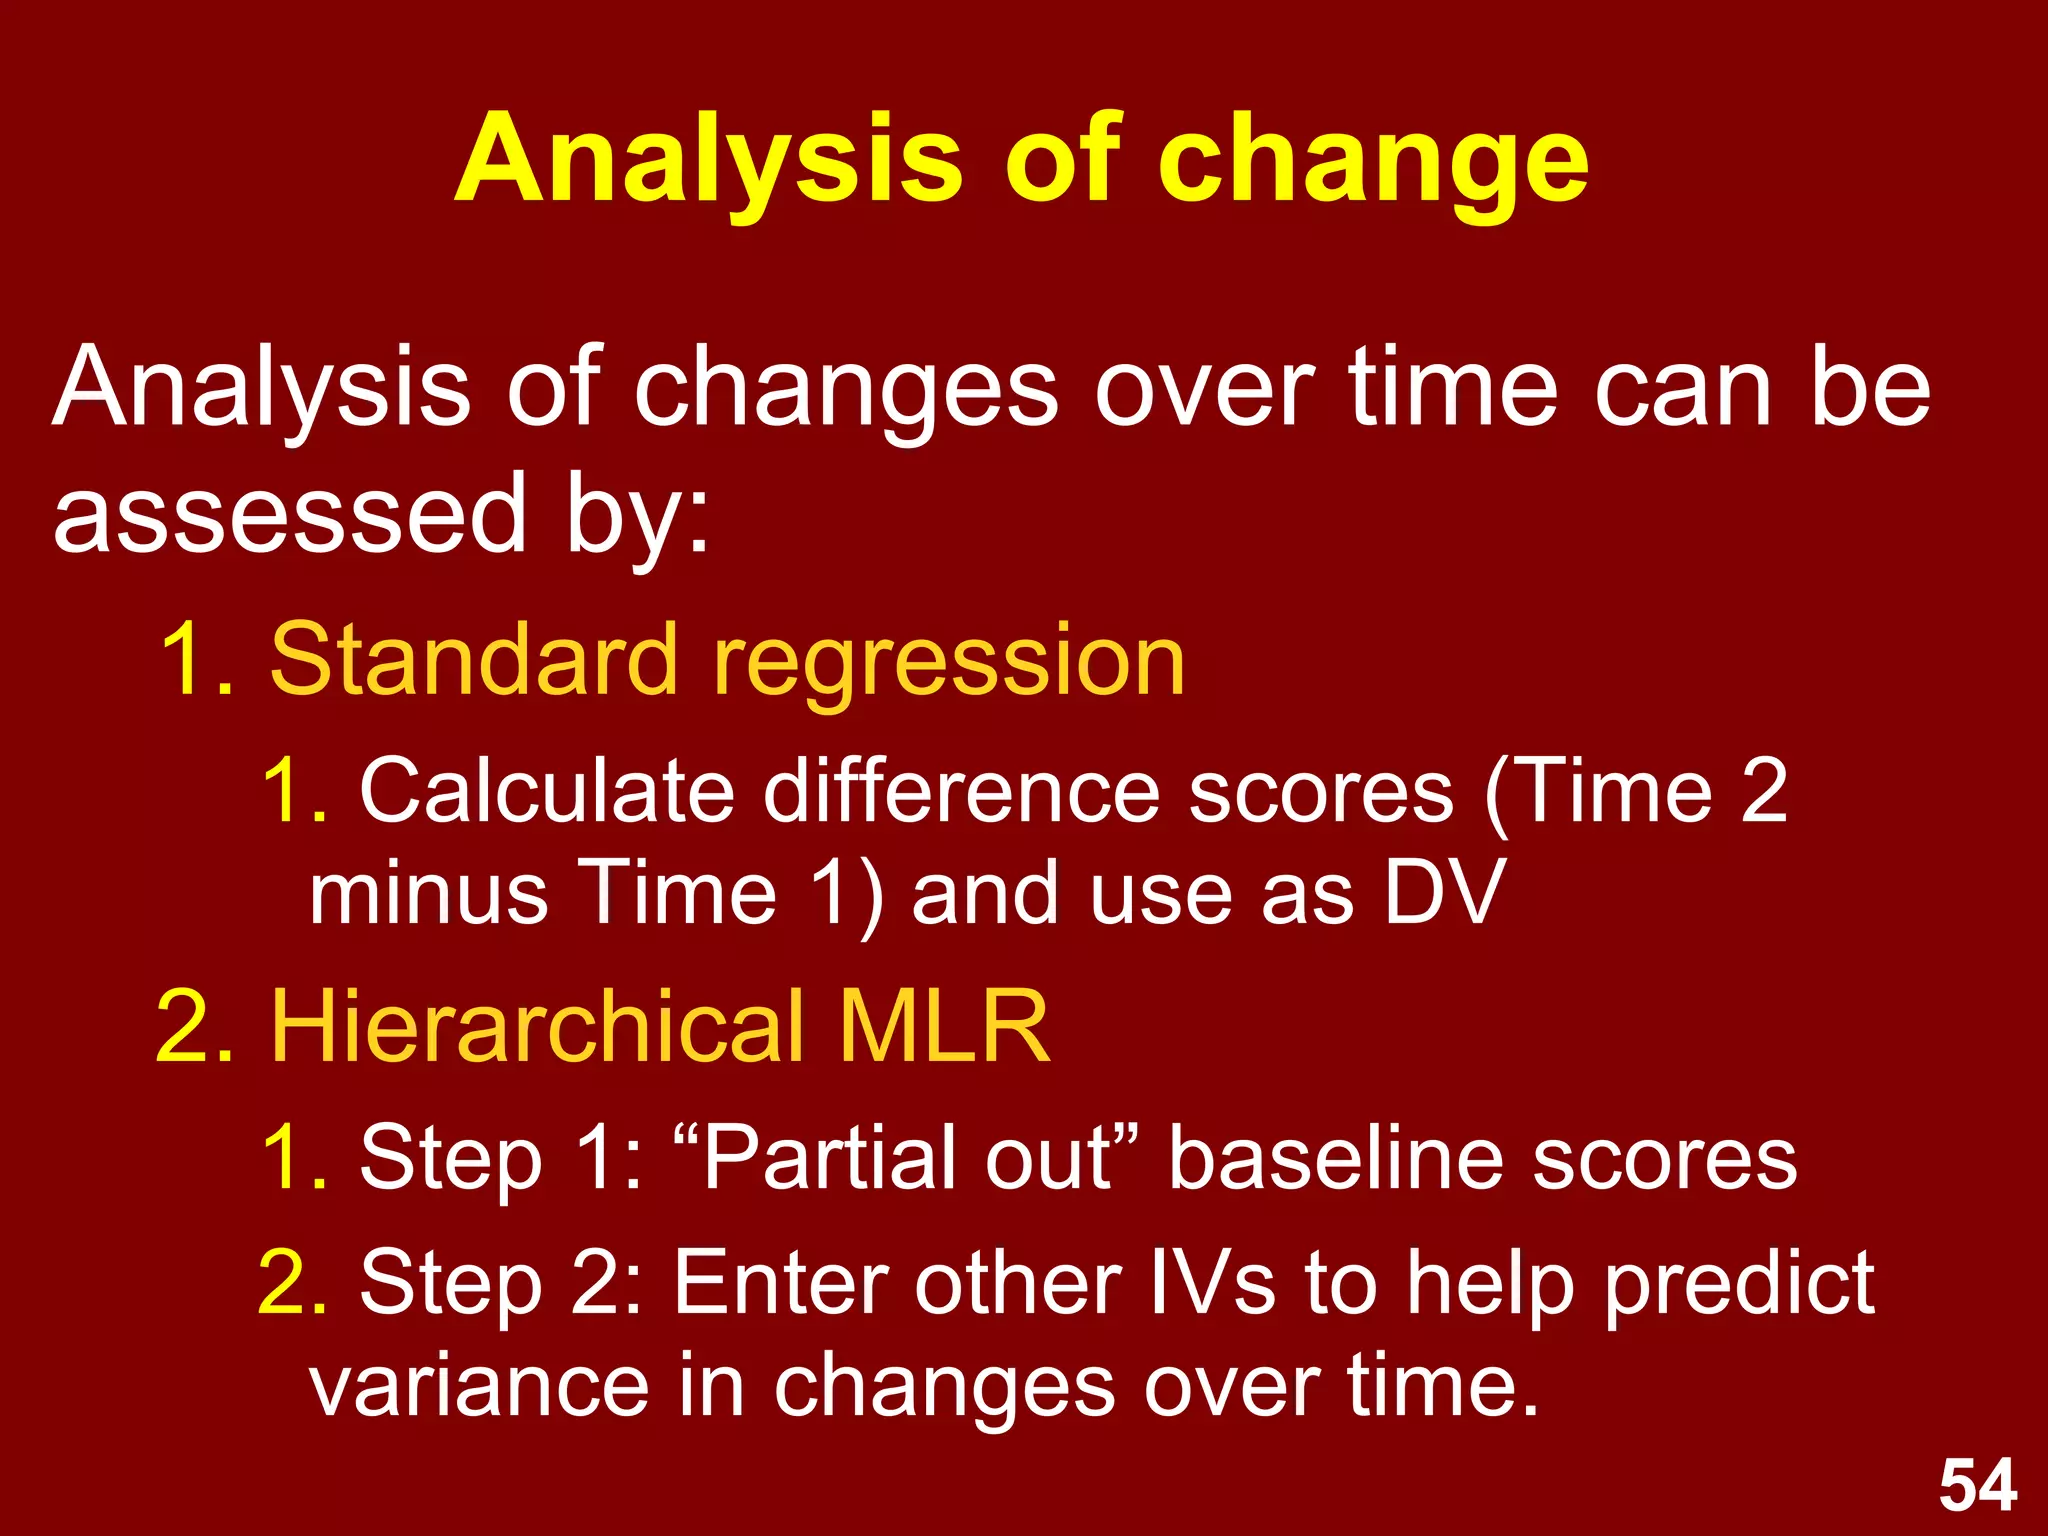
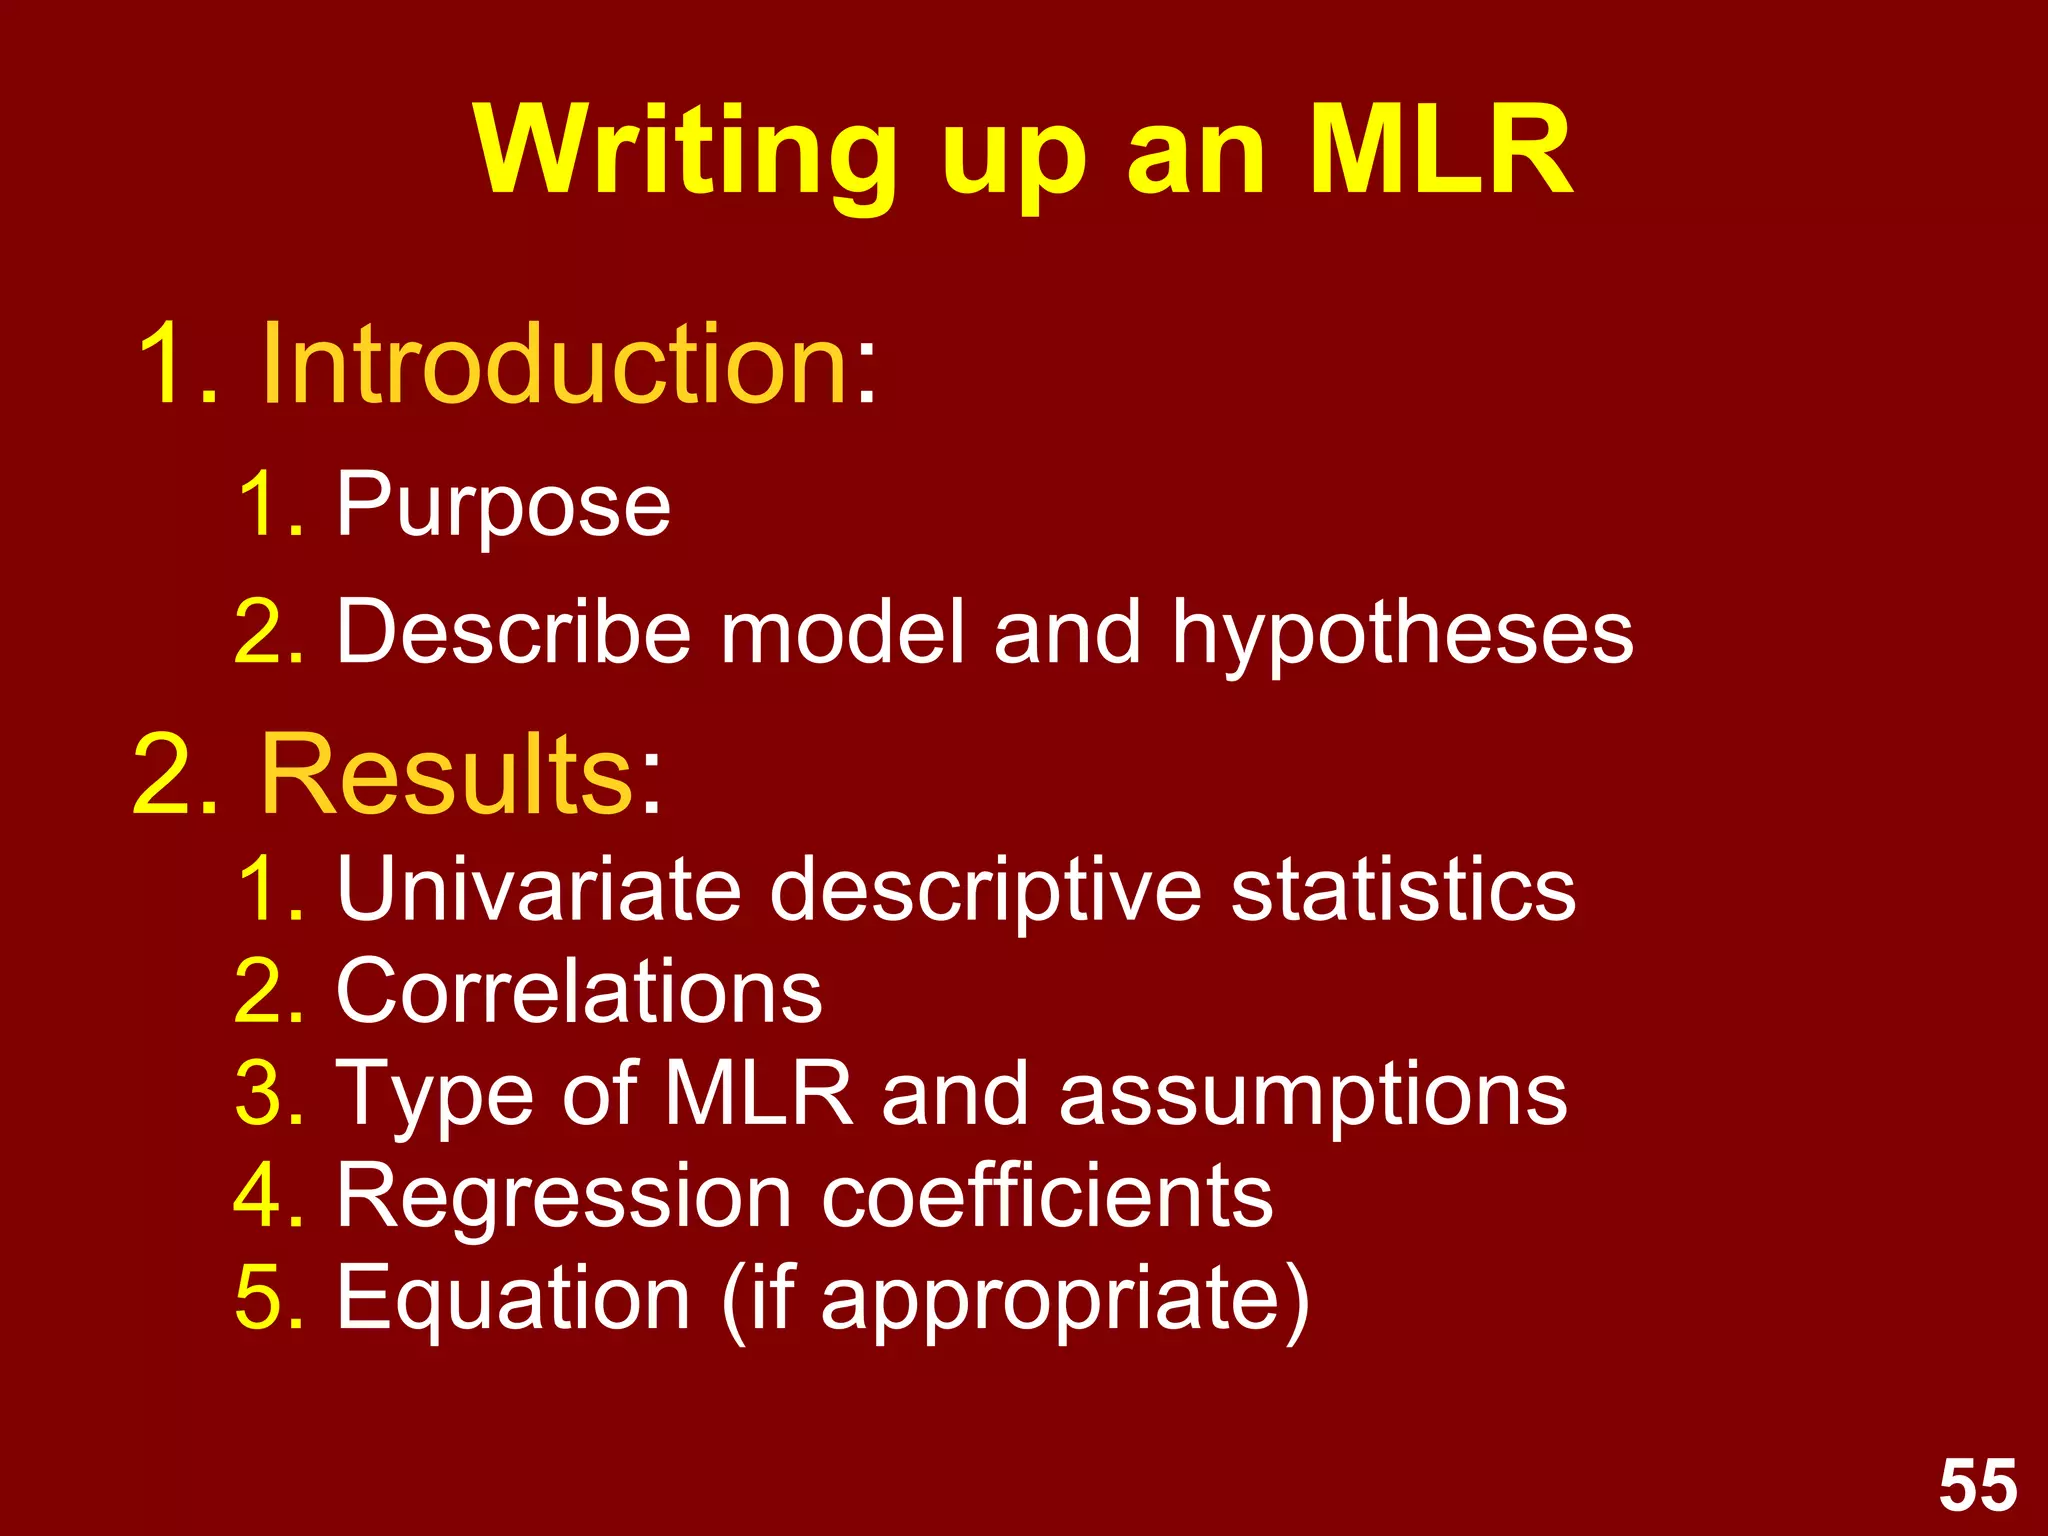
Walkthrough of MLR including model development, assumptions, linearity, and interactions.
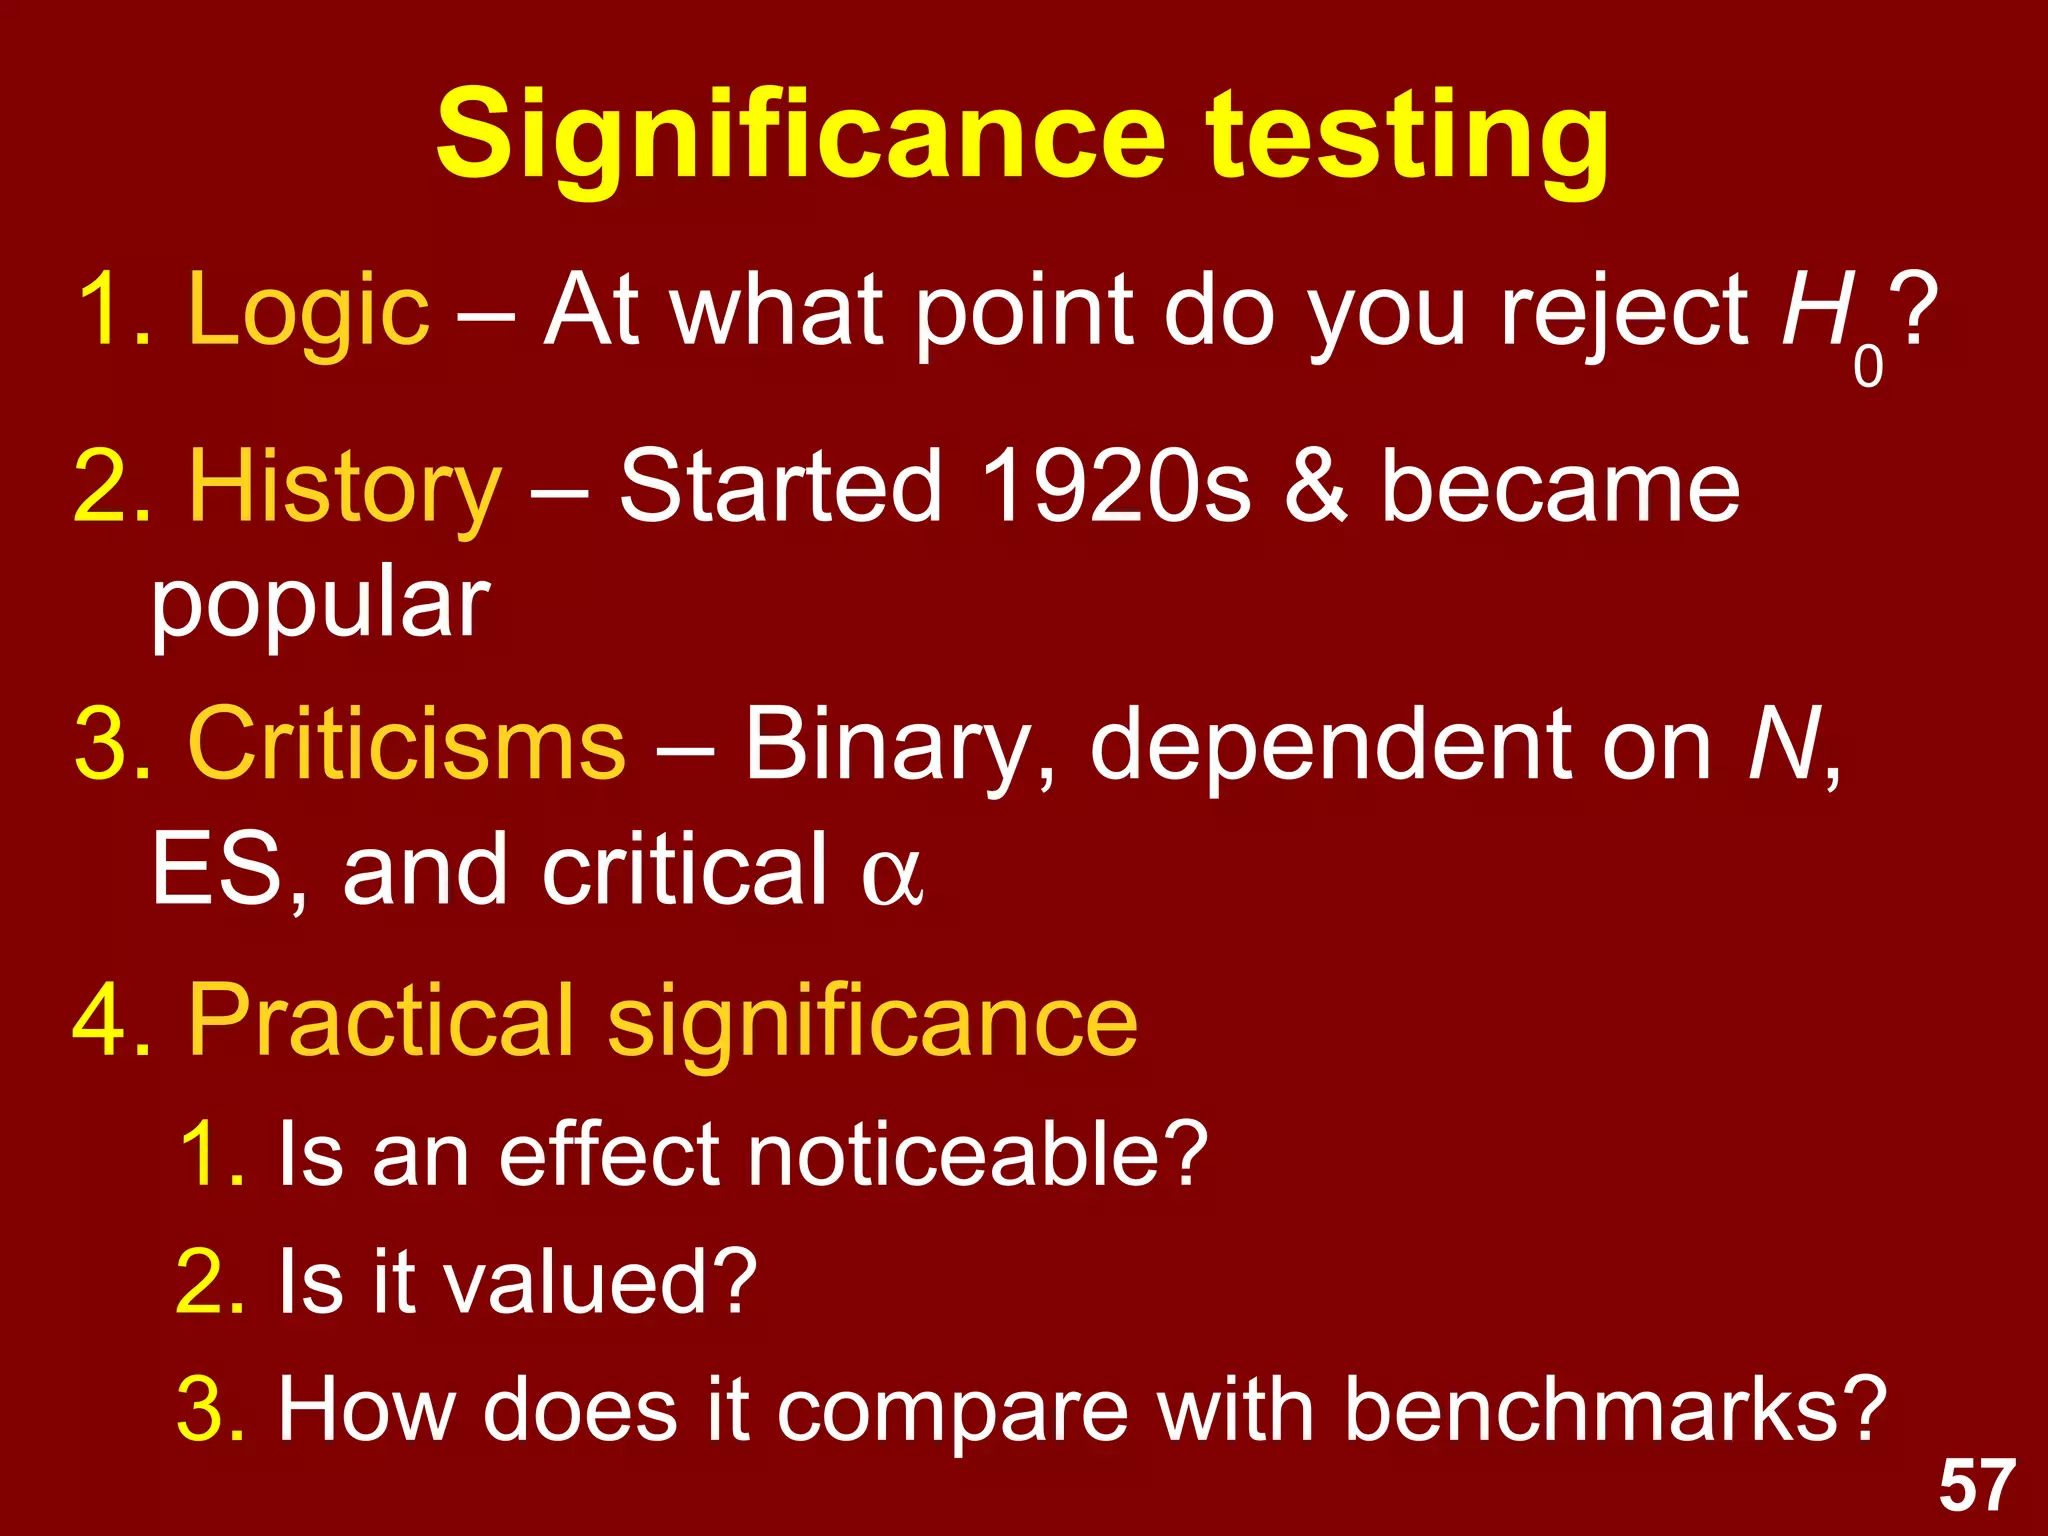
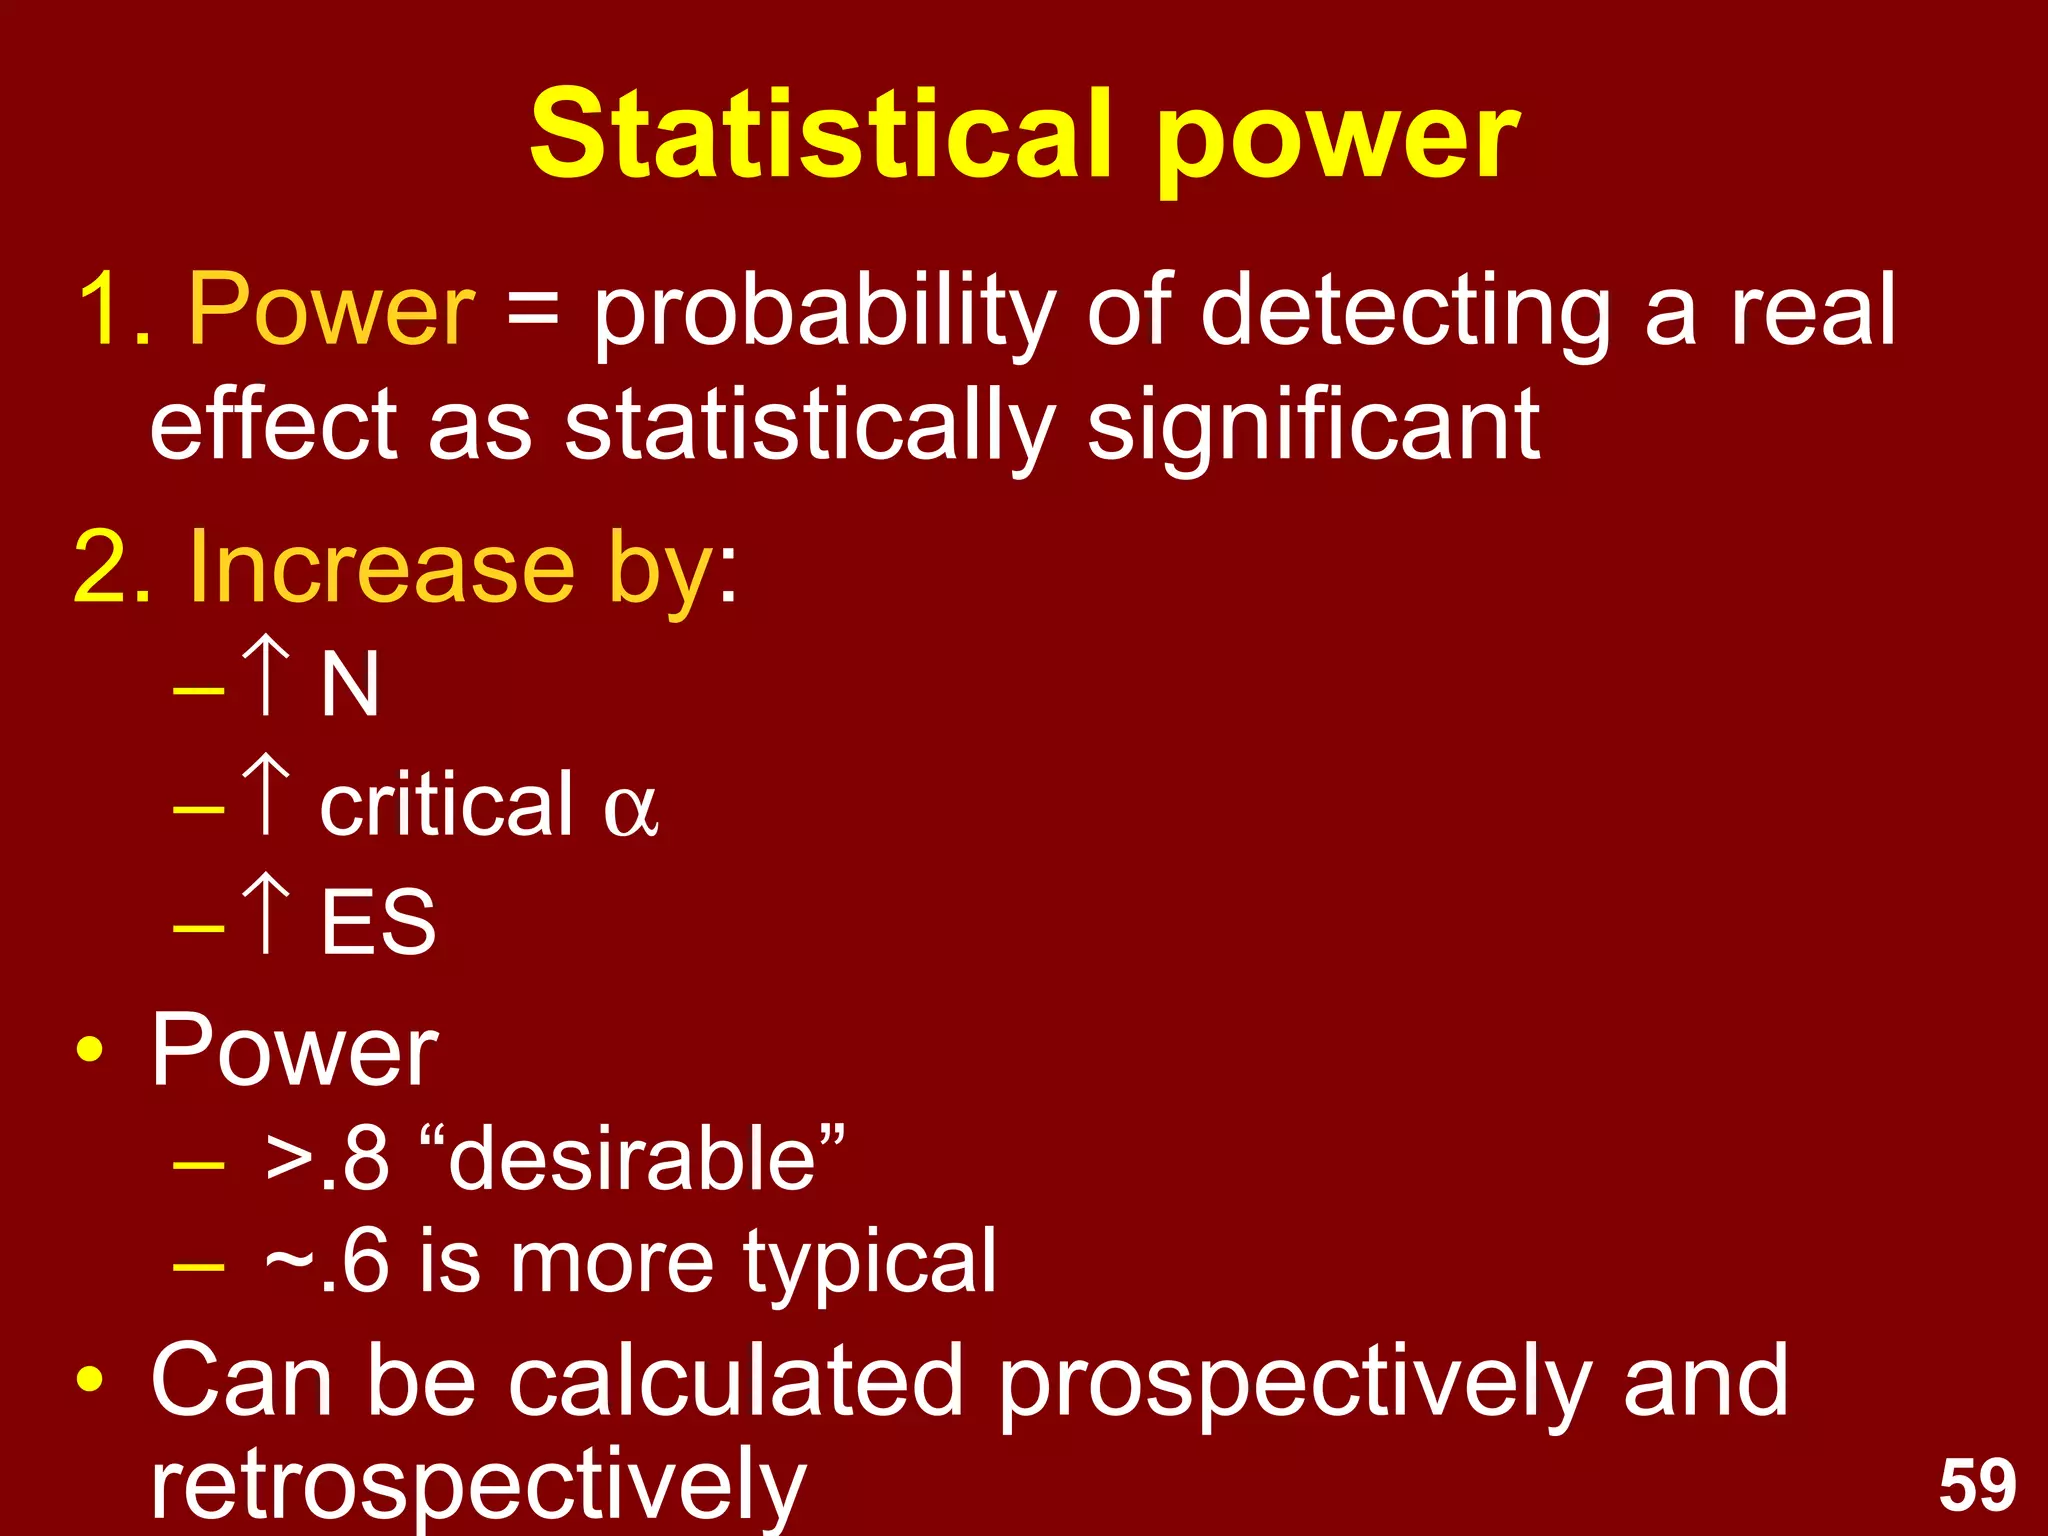
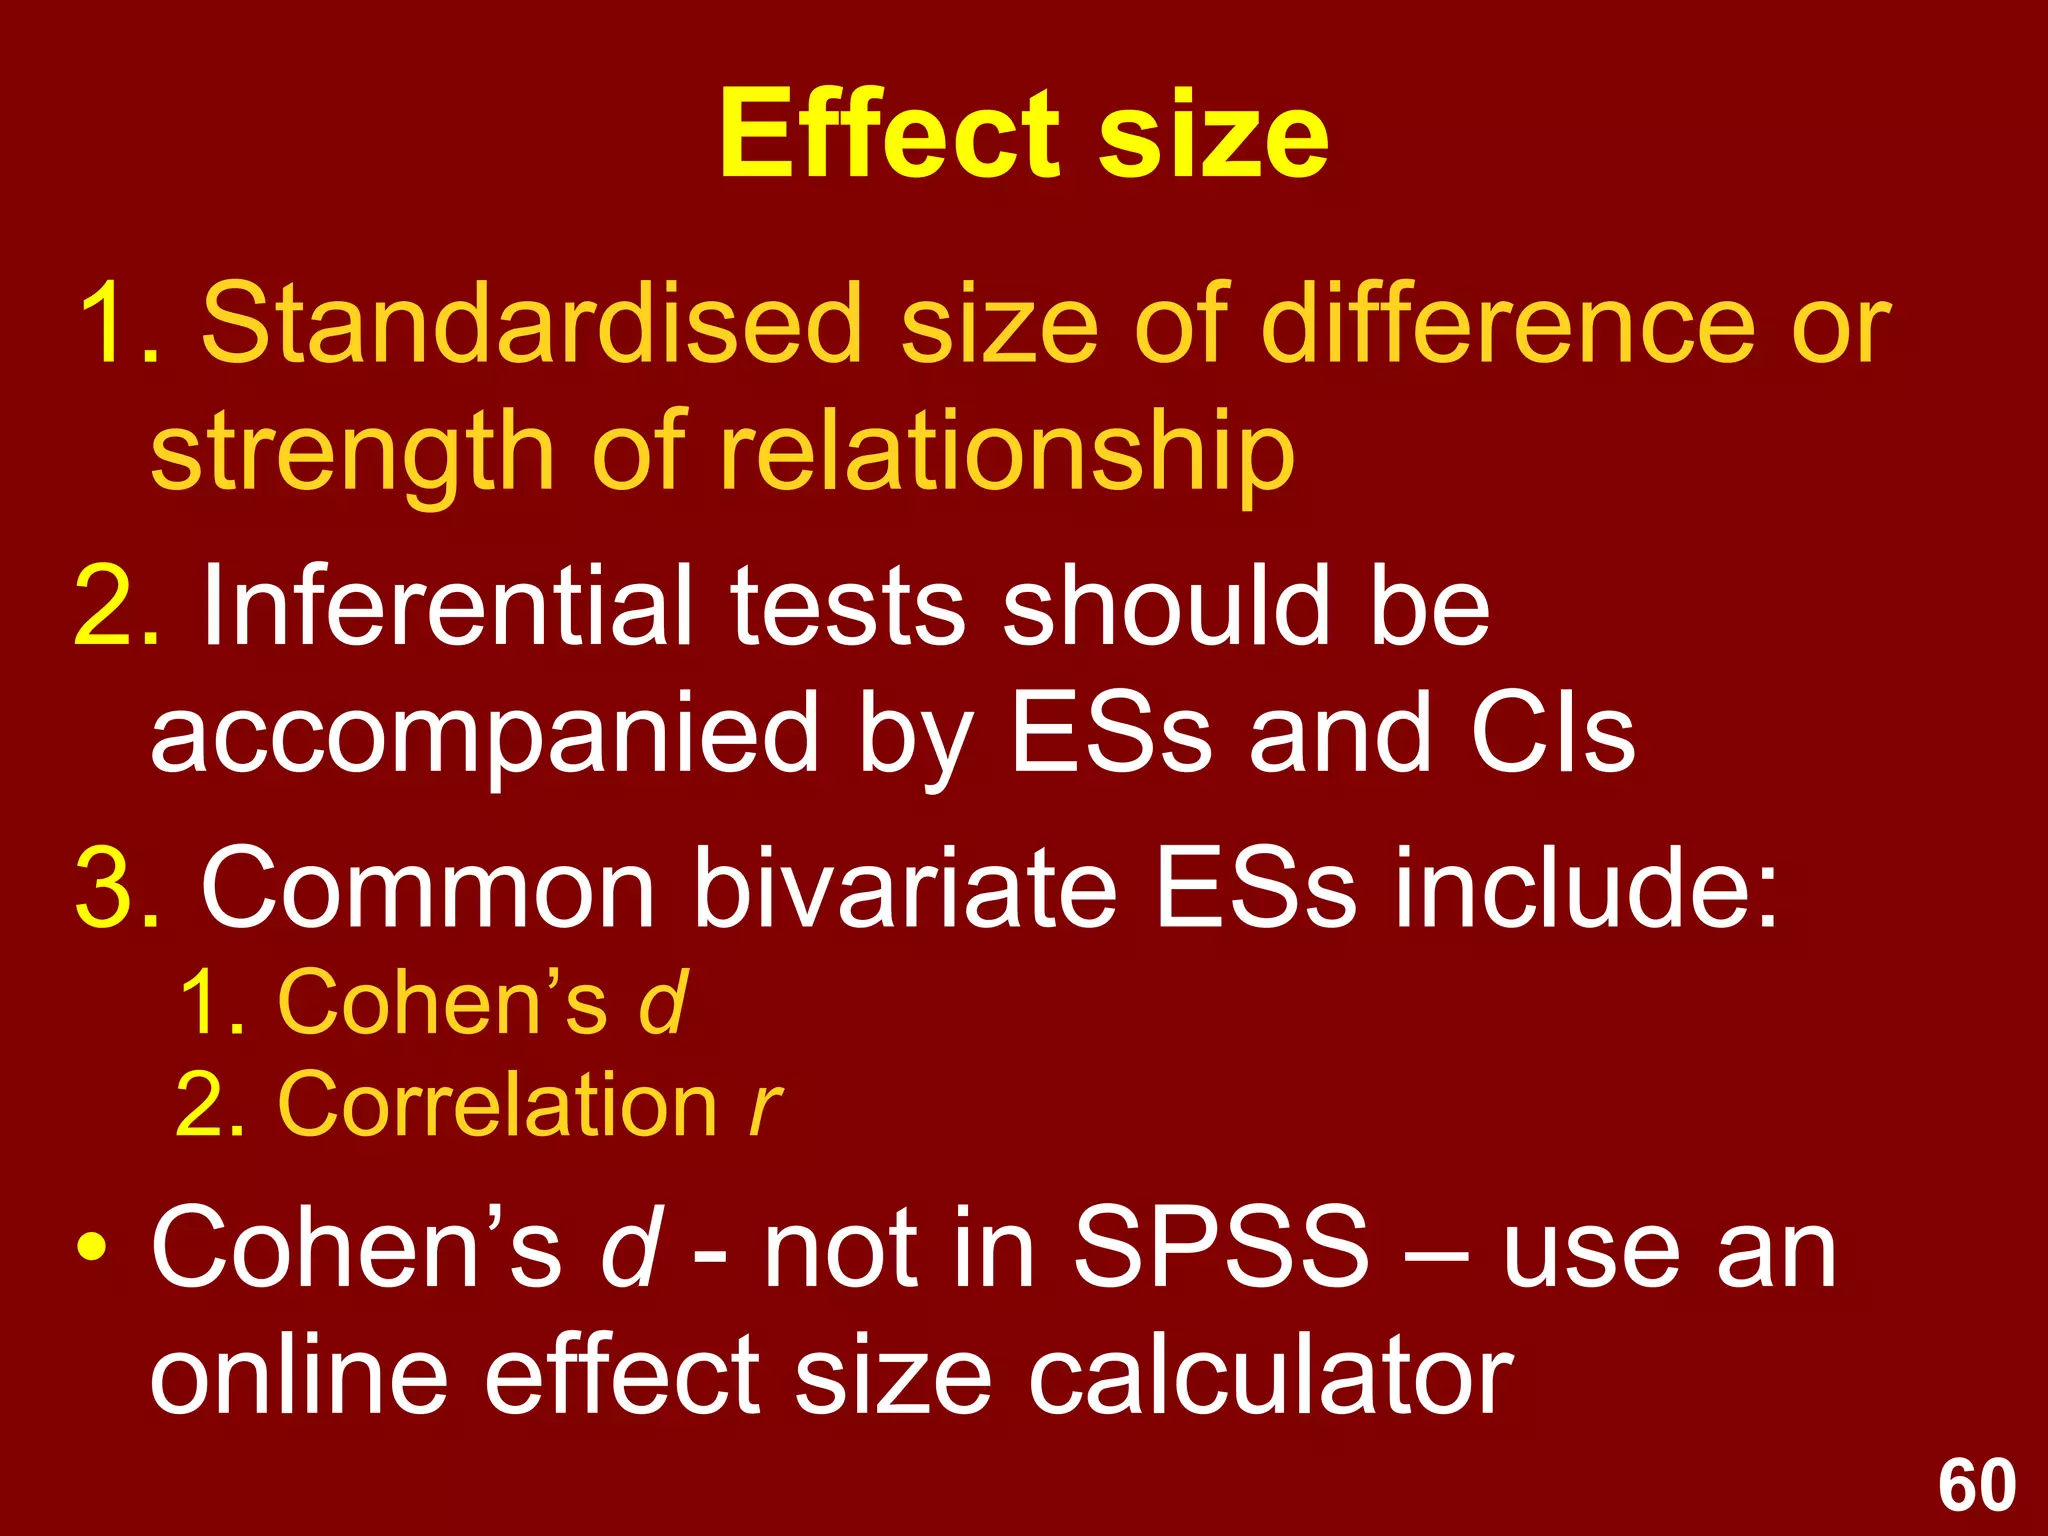
Understanding significance testing, statistical power, effect sizes, confidence intervals, and biases.
Discusses integrity in research, expected learning outcomes from survey studies, and graduate attributes.
Acknowledges the software used for creating the presentation.