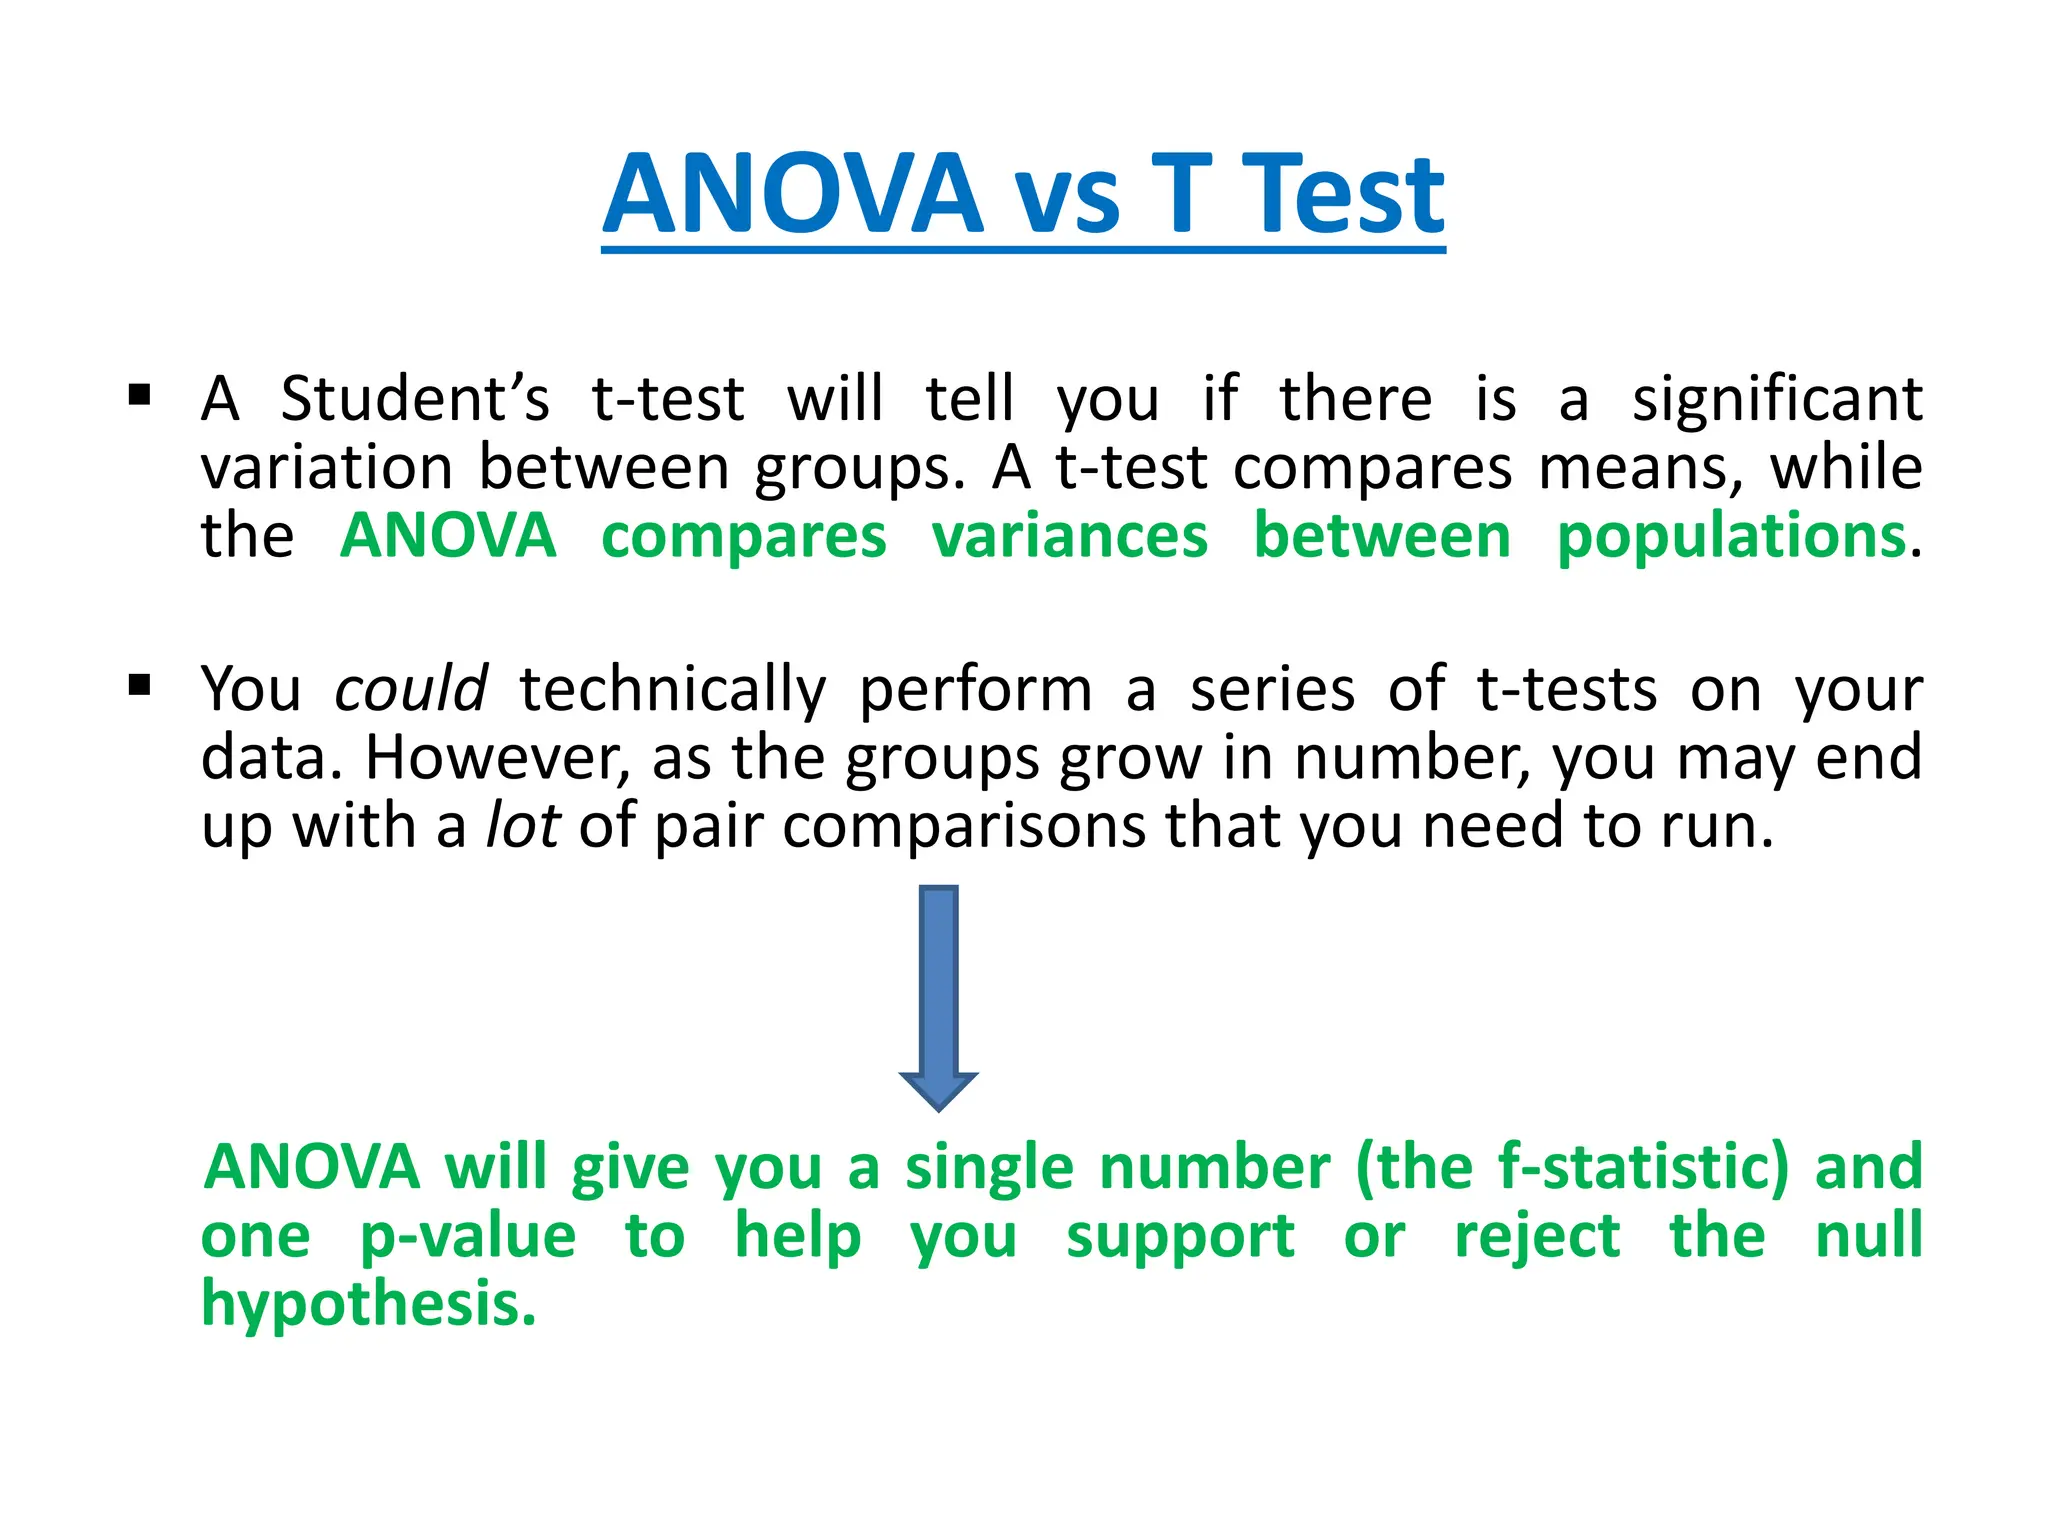
ANOVA Test
Contents:
 The ANOVA Test
 One Way ANOVA
 Two Way ANOVA
 What is MANOVA?
 What is Factorial ANOVA?
 How to run an ANOVA
 ANOVA vs T Test
 Repeated Measures ANOVA
The ANOVA Test
 Invented by R.A. Fisher
 Best applied where more than 2 populations or samples
are meant to be compared.
 An ANOVA test is a way to find out if survey or experiment
results are significant. In other words, they help you to
figure out if you need to reject the null hypothesis or
accept the alternate hypothesis.
 Basically we are testing groups to see if there’s a difference
between them.
FACTORS & LEVELS
10 MG DRUG 20 MG DRUG 30 MG DRUG
FACTOR- Dosage LEVELS- 10 MG/20 MG/30 MG
 A group of psychiatric patients are trying three
different therapies: counseling, medication
and biofeedback. We want to see if one
therapy is better than the others.
What Does “One-Way” or “Two-Way
Mean?
 One-way or two-way refers to the number
of independent variables in your Analysis of
Variance test.
 One-way has one independent variable (with
2 levels) For example : a one-way Analysis of
Variance could have one IV which is “DOSAGE”
available in 50 mg & 100 mg. and two-way has
two independent variables (can have multiple
levels).
What are “Groups” or “Levels”?
 Groups or levels are different groups in the
same independent variable.
 In the above example, your levels for “brand of
cereal” might be Lucky Charms, Raisin Bran,
Cornflakes — a total of three levels. Your levels for
“Calories” might be: sweetened, unsweetened — a
total of two levels.
What Does “Replication” Mean?
 It’s whether you are replicating your test(s) with
multiple groups.
 With a 2 way ANOVA with replication , you have two
groups and individuals within that group are doing
more than one thing (i.e. two groups of students from
two colleges taking two tests).
 If you only have one group taking two tests, you would
use ANOVA without replication.
Types of Tests
 One-way ANOVA between groups: used when you want to
test two groups to see if there’s a difference between them.
 2 way ANOVA without replication: used when you have one
group and you’re double-testing that same group. For
example, you’re testing one set of individuals before and after
they take a medication to see if it works or not.
 2way ANOVA with replication: Two groups, and the
members of those groups are doing more than one thing. For
example, two groups of patients from different hospitals
trying two different therapies.
One Way ANOVA
 A one way ANOVA is used to compare two means from two
independent (unrelated) groups
 The null hypothesis for the test is that the two means are equal.
Therefore, a significant result means that the two means are
unequal.
1) When to use a one way ANOVA :
 Situation 1: You have a group of individuals randomly split into
smaller groups and completing different tasks.
For example : You might be studying the effects of tea on weight
loss and form three groups: green tea, black tea, and no tea.
 Situation 2: The individuals are split into groups
based on an attribute they possess.
For example : you might be studying leg strength of
people according to weight. You could split
participants into weight categories (obese,
overweight and normal) and measure their leg
strength on a weight machine
2) Limitations of the One Way ANOVA :
 A one way ANOVA will tell you that at least two
groups were different from each other. But it won’t
tell you what groups were different.
Two Way ANOVA
 With a Two Way ANOVA, there are two
independent Variables. Use a two way ANOVA
when you have one measurement
variable and 2 nominal variables.
 In other words, if your experiment has a
quantitative outcome and you have two
categorical explanatory variables, a two way
ANOVA is appropriate.
 For example, you might want to find out if there
is an interaction between income and gender for
anxiety level at job interviews. The anxiety level
is the outcome, or the variable that can be
measured. Gender and Income are the
two categorical variables. These categorical
variables are also the independent variables,
which are called factors in a Two Way ANOVA.
 The factors can be split into levels.
Assumptions for Two Way ANOVA
 The population must be close to a normal
distribution.
 Samples must be independent.
 Population variances must be equal.
 Groups must have equal sample sizes.
What is MANOVA?
 MANOVA is just an ANOVA with several dependent variables. It’s
similar to many other tests and experiments in that it’s purpose is
to find out if the response variable (i.e. your dependent variable)
is changed by manipulating the independent variable.
 The test helps to answer many research questions, including:
A) Do changes to the independent variables have statistically
significant effects on dependent variables?
B) What are the interactions among dependent variables?
C) What are the interactions among independent variables?
Example : Suppose you wanted to find out if a
difference in textbooks affected students’ scores in
math and science. Improvements in math and
science means that there are 2 dependent variables, so
a MANOVA is appropriate.
Advantages of MANOVA :
 Enables you to test multiple dependent variables.
 Protect against Type I errors
Disadvantages MANOVA
 MANOVA is many times more complicated than ANOVA,
making it a challenge to see which independent variables
are affecting dependent variables.
 One degree of freedom is lost with the addition of each
new variable.
 The dependent variables should be uncorrelated as much
as possible. If they are correlated, the loss in degrees of
freedom means that there isn’t much advantages in
including more than one dependent variable on the test
What is Factorial ANOVA?
 2 or >2 factor(each of which
with atleast 2 levels) where
the levels are dependent or
independent or mixed.
DAY 1
BP
DAY 2
BP
DAY 3
BP
MEN 120/80 110/80 108/70
WOMEN 106/66 110/70 100/60
 A 2-way ANOVA has 2 factors (independent variables) and
one dependent variable. For example, time spent studying and
prior knowledge are factors that affect how well you do on a test.
 A 3-way ANOVA has 3 factors (independent variables) and one
dependent variable. For example, time spent studying, prior
knowledge, and hours of sleep are factors that affect how well
you do on a test
 Factorial ANOVA is an efficient way of conducting a test. Instead of
performing a series of experiments where you test one
independent variable against one dependent variable, you can test
all independent variables at the same time.
Assumptions of Factorial ANOVA
 Normality: the dependent variable is normally
distributed.
 Independence: Observations and groups are
independent from each other.
 Equality of Variance: the population variances
are equal across factors/levels.
Variability
 In a one-way ANOVA, variability is due to the
differences between groups and the differences
within groups. In factorial ANOVA, each level and
factor are paired up with each other (“crossed”). This
helps you to see what interactions are going on
between the levels and factors. If there is an
interaction then the differences in one factor depend
on the differences in another.
 Example : running a two-way ANOVA to test
male/female performance on a final exam. The
subjects had either had 4, 6, or 8 hours of sleep.
IV-1: SEX (Male/Female)
IV-2: SLEEP (4/6/8)
DV: Final Exam Score
 A 2-way factorial ANOVA would help you answer the following questions:
A) Is sex a main effect?
B) Is sleep a main effect?
C) Is there a significant interaction between factors? In other words, how do
hours of sleep and sex interact with regards to exam performance?
D) Can any differences in sex and exam performance be found in the different
levels of sleep?
How to run an ANOVA
• Find the mean for each of the groups.
• Find the overall mean (the mean of the groups combined).
• Find the Within Group Variation; the total deviation of
each member’s score from the Group Mean.
• Find the Between Group Variation: the deviation of each
Group Mean from the Overall Mean.
• Find the F statistic: the ratio of Between Group Variation
to Within Group Variation.
Repeated Measures ANOVA
• A repeated measures ANOVA test related groups,
not independent ones.
• It’s called Repeated Measures because the same
group of participants is being measured over
and over again. For example, you could be
studying the cholesterol levels of the same group
of patients at 1, 3, and 6 months after changing
their diet. For this example, the independent
variable is “time” and the dependent variable is
“cholesterol.”
Reasons to use Repeated Measures
ANOVA
 When you collect data from the same
participants over a period of time, individual
differences are reduced or eliminated.
 Testing is more powerful because the sample
size isn’t divided between groups.
 The test can be economical, as we are using
the same participants.
Assumptions for Repeated Measures
ANOVA
 There must be one independent variable and one
dependent variable.
 The dependent variable must be continuous, on
an interval scale or a ratio scale.
 The independent variable must be categorical,
either on the nominal scale or ordinal scale.
THE F-Distribution In ANOVA
• When doing an ANOVA , we calculate an
“F”-Statistic
 F= TREATMENT DIFFERENCES + RANDOM
DIFFERENCES
RANDOM DIFFERENCES
Click the “Add” button and then give your
dependent variable a name
 Click “Options”, then transfer your factors
from the left box to the Display Means for box
on the right.
Click the following check boxes:
 Compare main effects.
 Descriptive Statistics.
 Estimates of Effect Size.
ANOVA vs T Test
 A Student’s t-test will tell you if there is a significant
variation between groups. A t-test compares means, while
the ANOVA compares variances between populations.
 You could technically perform a series of t-tests on your
data. However, as the groups grow in number, you may end
up with a lot of pair comparisons that you need to run.
ANOVA will give you a single number (the f-statistic) and
one p-value to help you support or reject the null
hypothesis.
Sphericity
 Sphericity is used as an assumption in repeated
measures ANOVA. The assumption states that
the variances of the differences between all
possible group pairs are equal. If your data
violates this assumption, it can result in an
increase in error.
 Mauchly’s test for sphericity can be run in the
majority of statistical software
 Mauchly’s test is ideal for mid-size samples.
 If the test returns a small p-value (p ≤.05), this
is an indication that your data has violated the
assumption.
ANOVA biostat easy explaination    .pptx

ANOVA biostat easy explaination .pptx

  • 1.
  • 2.
    Contents:  The ANOVATest  One Way ANOVA  Two Way ANOVA  What is MANOVA?  What is Factorial ANOVA?  How to run an ANOVA  ANOVA vs T Test  Repeated Measures ANOVA
  • 3.
    The ANOVA Test Invented by R.A. Fisher  Best applied where more than 2 populations or samples are meant to be compared.  An ANOVA test is a way to find out if survey or experiment results are significant. In other words, they help you to figure out if you need to reject the null hypothesis or accept the alternate hypothesis.  Basically we are testing groups to see if there’s a difference between them.
  • 4.
    FACTORS & LEVELS 10MG DRUG 20 MG DRUG 30 MG DRUG FACTOR- Dosage LEVELS- 10 MG/20 MG/30 MG
  • 5.
     A groupof psychiatric patients are trying three different therapies: counseling, medication and biofeedback. We want to see if one therapy is better than the others.
  • 6.
    What Does “One-Way”or “Two-Way Mean?  One-way or two-way refers to the number of independent variables in your Analysis of Variance test.  One-way has one independent variable (with 2 levels) For example : a one-way Analysis of Variance could have one IV which is “DOSAGE” available in 50 mg & 100 mg. and two-way has two independent variables (can have multiple levels).
  • 7.
    What are “Groups”or “Levels”?  Groups or levels are different groups in the same independent variable.  In the above example, your levels for “brand of cereal” might be Lucky Charms, Raisin Bran, Cornflakes — a total of three levels. Your levels for “Calories” might be: sweetened, unsweetened — a total of two levels.
  • 8.
    What Does “Replication”Mean?  It’s whether you are replicating your test(s) with multiple groups.  With a 2 way ANOVA with replication , you have two groups and individuals within that group are doing more than one thing (i.e. two groups of students from two colleges taking two tests).  If you only have one group taking two tests, you would use ANOVA without replication.
  • 9.
    Types of Tests One-way ANOVA between groups: used when you want to test two groups to see if there’s a difference between them.  2 way ANOVA without replication: used when you have one group and you’re double-testing that same group. For example, you’re testing one set of individuals before and after they take a medication to see if it works or not.  2way ANOVA with replication: Two groups, and the members of those groups are doing more than one thing. For example, two groups of patients from different hospitals trying two different therapies.
  • 10.
    One Way ANOVA A one way ANOVA is used to compare two means from two independent (unrelated) groups  The null hypothesis for the test is that the two means are equal. Therefore, a significant result means that the two means are unequal. 1) When to use a one way ANOVA :  Situation 1: You have a group of individuals randomly split into smaller groups and completing different tasks. For example : You might be studying the effects of tea on weight loss and form three groups: green tea, black tea, and no tea.
  • 11.
     Situation 2:The individuals are split into groups based on an attribute they possess. For example : you might be studying leg strength of people according to weight. You could split participants into weight categories (obese, overweight and normal) and measure their leg strength on a weight machine
  • 12.
    2) Limitations ofthe One Way ANOVA :  A one way ANOVA will tell you that at least two groups were different from each other. But it won’t tell you what groups were different.
  • 13.
    Two Way ANOVA With a Two Way ANOVA, there are two independent Variables. Use a two way ANOVA when you have one measurement variable and 2 nominal variables.  In other words, if your experiment has a quantitative outcome and you have two categorical explanatory variables, a two way ANOVA is appropriate.
  • 14.
     For example,you might want to find out if there is an interaction between income and gender for anxiety level at job interviews. The anxiety level is the outcome, or the variable that can be measured. Gender and Income are the two categorical variables. These categorical variables are also the independent variables, which are called factors in a Two Way ANOVA.  The factors can be split into levels.
  • 15.
    Assumptions for TwoWay ANOVA  The population must be close to a normal distribution.  Samples must be independent.  Population variances must be equal.  Groups must have equal sample sizes.
  • 16.
    What is MANOVA? MANOVA is just an ANOVA with several dependent variables. It’s similar to many other tests and experiments in that it’s purpose is to find out if the response variable (i.e. your dependent variable) is changed by manipulating the independent variable.  The test helps to answer many research questions, including: A) Do changes to the independent variables have statistically significant effects on dependent variables? B) What are the interactions among dependent variables? C) What are the interactions among independent variables?
  • 17.
    Example : Supposeyou wanted to find out if a difference in textbooks affected students’ scores in math and science. Improvements in math and science means that there are 2 dependent variables, so a MANOVA is appropriate. Advantages of MANOVA :  Enables you to test multiple dependent variables.  Protect against Type I errors
  • 18.
    Disadvantages MANOVA  MANOVAis many times more complicated than ANOVA, making it a challenge to see which independent variables are affecting dependent variables.  One degree of freedom is lost with the addition of each new variable.  The dependent variables should be uncorrelated as much as possible. If they are correlated, the loss in degrees of freedom means that there isn’t much advantages in including more than one dependent variable on the test
  • 19.
    What is FactorialANOVA?  2 or >2 factor(each of which with atleast 2 levels) where the levels are dependent or independent or mixed. DAY 1 BP DAY 2 BP DAY 3 BP MEN 120/80 110/80 108/70 WOMEN 106/66 110/70 100/60
  • 20.
     A 2-wayANOVA has 2 factors (independent variables) and one dependent variable. For example, time spent studying and prior knowledge are factors that affect how well you do on a test.  A 3-way ANOVA has 3 factors (independent variables) and one dependent variable. For example, time spent studying, prior knowledge, and hours of sleep are factors that affect how well you do on a test  Factorial ANOVA is an efficient way of conducting a test. Instead of performing a series of experiments where you test one independent variable against one dependent variable, you can test all independent variables at the same time.
  • 21.
    Assumptions of FactorialANOVA  Normality: the dependent variable is normally distributed.  Independence: Observations and groups are independent from each other.  Equality of Variance: the population variances are equal across factors/levels.
  • 22.
    Variability  In aone-way ANOVA, variability is due to the differences between groups and the differences within groups. In factorial ANOVA, each level and factor are paired up with each other (“crossed”). This helps you to see what interactions are going on between the levels and factors. If there is an interaction then the differences in one factor depend on the differences in another.  Example : running a two-way ANOVA to test male/female performance on a final exam. The subjects had either had 4, 6, or 8 hours of sleep.
  • 23.
    IV-1: SEX (Male/Female) IV-2:SLEEP (4/6/8) DV: Final Exam Score  A 2-way factorial ANOVA would help you answer the following questions: A) Is sex a main effect? B) Is sleep a main effect? C) Is there a significant interaction between factors? In other words, how do hours of sleep and sex interact with regards to exam performance? D) Can any differences in sex and exam performance be found in the different levels of sleep?
  • 24.
    How to runan ANOVA • Find the mean for each of the groups. • Find the overall mean (the mean of the groups combined). • Find the Within Group Variation; the total deviation of each member’s score from the Group Mean. • Find the Between Group Variation: the deviation of each Group Mean from the Overall Mean. • Find the F statistic: the ratio of Between Group Variation to Within Group Variation.
  • 25.
    Repeated Measures ANOVA •A repeated measures ANOVA test related groups, not independent ones. • It’s called Repeated Measures because the same group of participants is being measured over and over again. For example, you could be studying the cholesterol levels of the same group of patients at 1, 3, and 6 months after changing their diet. For this example, the independent variable is “time” and the dependent variable is “cholesterol.”
  • 26.
    Reasons to useRepeated Measures ANOVA  When you collect data from the same participants over a period of time, individual differences are reduced or eliminated.  Testing is more powerful because the sample size isn’t divided between groups.  The test can be economical, as we are using the same participants.
  • 27.
    Assumptions for RepeatedMeasures ANOVA  There must be one independent variable and one dependent variable.  The dependent variable must be continuous, on an interval scale or a ratio scale.  The independent variable must be categorical, either on the nominal scale or ordinal scale.
  • 28.
    THE F-Distribution InANOVA • When doing an ANOVA , we calculate an “F”-Statistic  F= TREATMENT DIFFERENCES + RANDOM DIFFERENCES RANDOM DIFFERENCES
  • 29.
    Click the “Add”button and then give your dependent variable a name
  • 31.
     Click “Options”,then transfer your factors from the left box to the Display Means for box on the right. Click the following check boxes:  Compare main effects.  Descriptive Statistics.  Estimates of Effect Size.
  • 32.
    ANOVA vs TTest  A Student’s t-test will tell you if there is a significant variation between groups. A t-test compares means, while the ANOVA compares variances between populations.  You could technically perform a series of t-tests on your data. However, as the groups grow in number, you may end up with a lot of pair comparisons that you need to run. ANOVA will give you a single number (the f-statistic) and one p-value to help you support or reject the null hypothesis.
  • 33.
    Sphericity  Sphericity isused as an assumption in repeated measures ANOVA. The assumption states that the variances of the differences between all possible group pairs are equal. If your data violates this assumption, it can result in an increase in error.  Mauchly’s test for sphericity can be run in the majority of statistical software  Mauchly’s test is ideal for mid-size samples.
  • 34.
     If thetest returns a small p-value (p ≤.05), this is an indication that your data has violated the assumption.