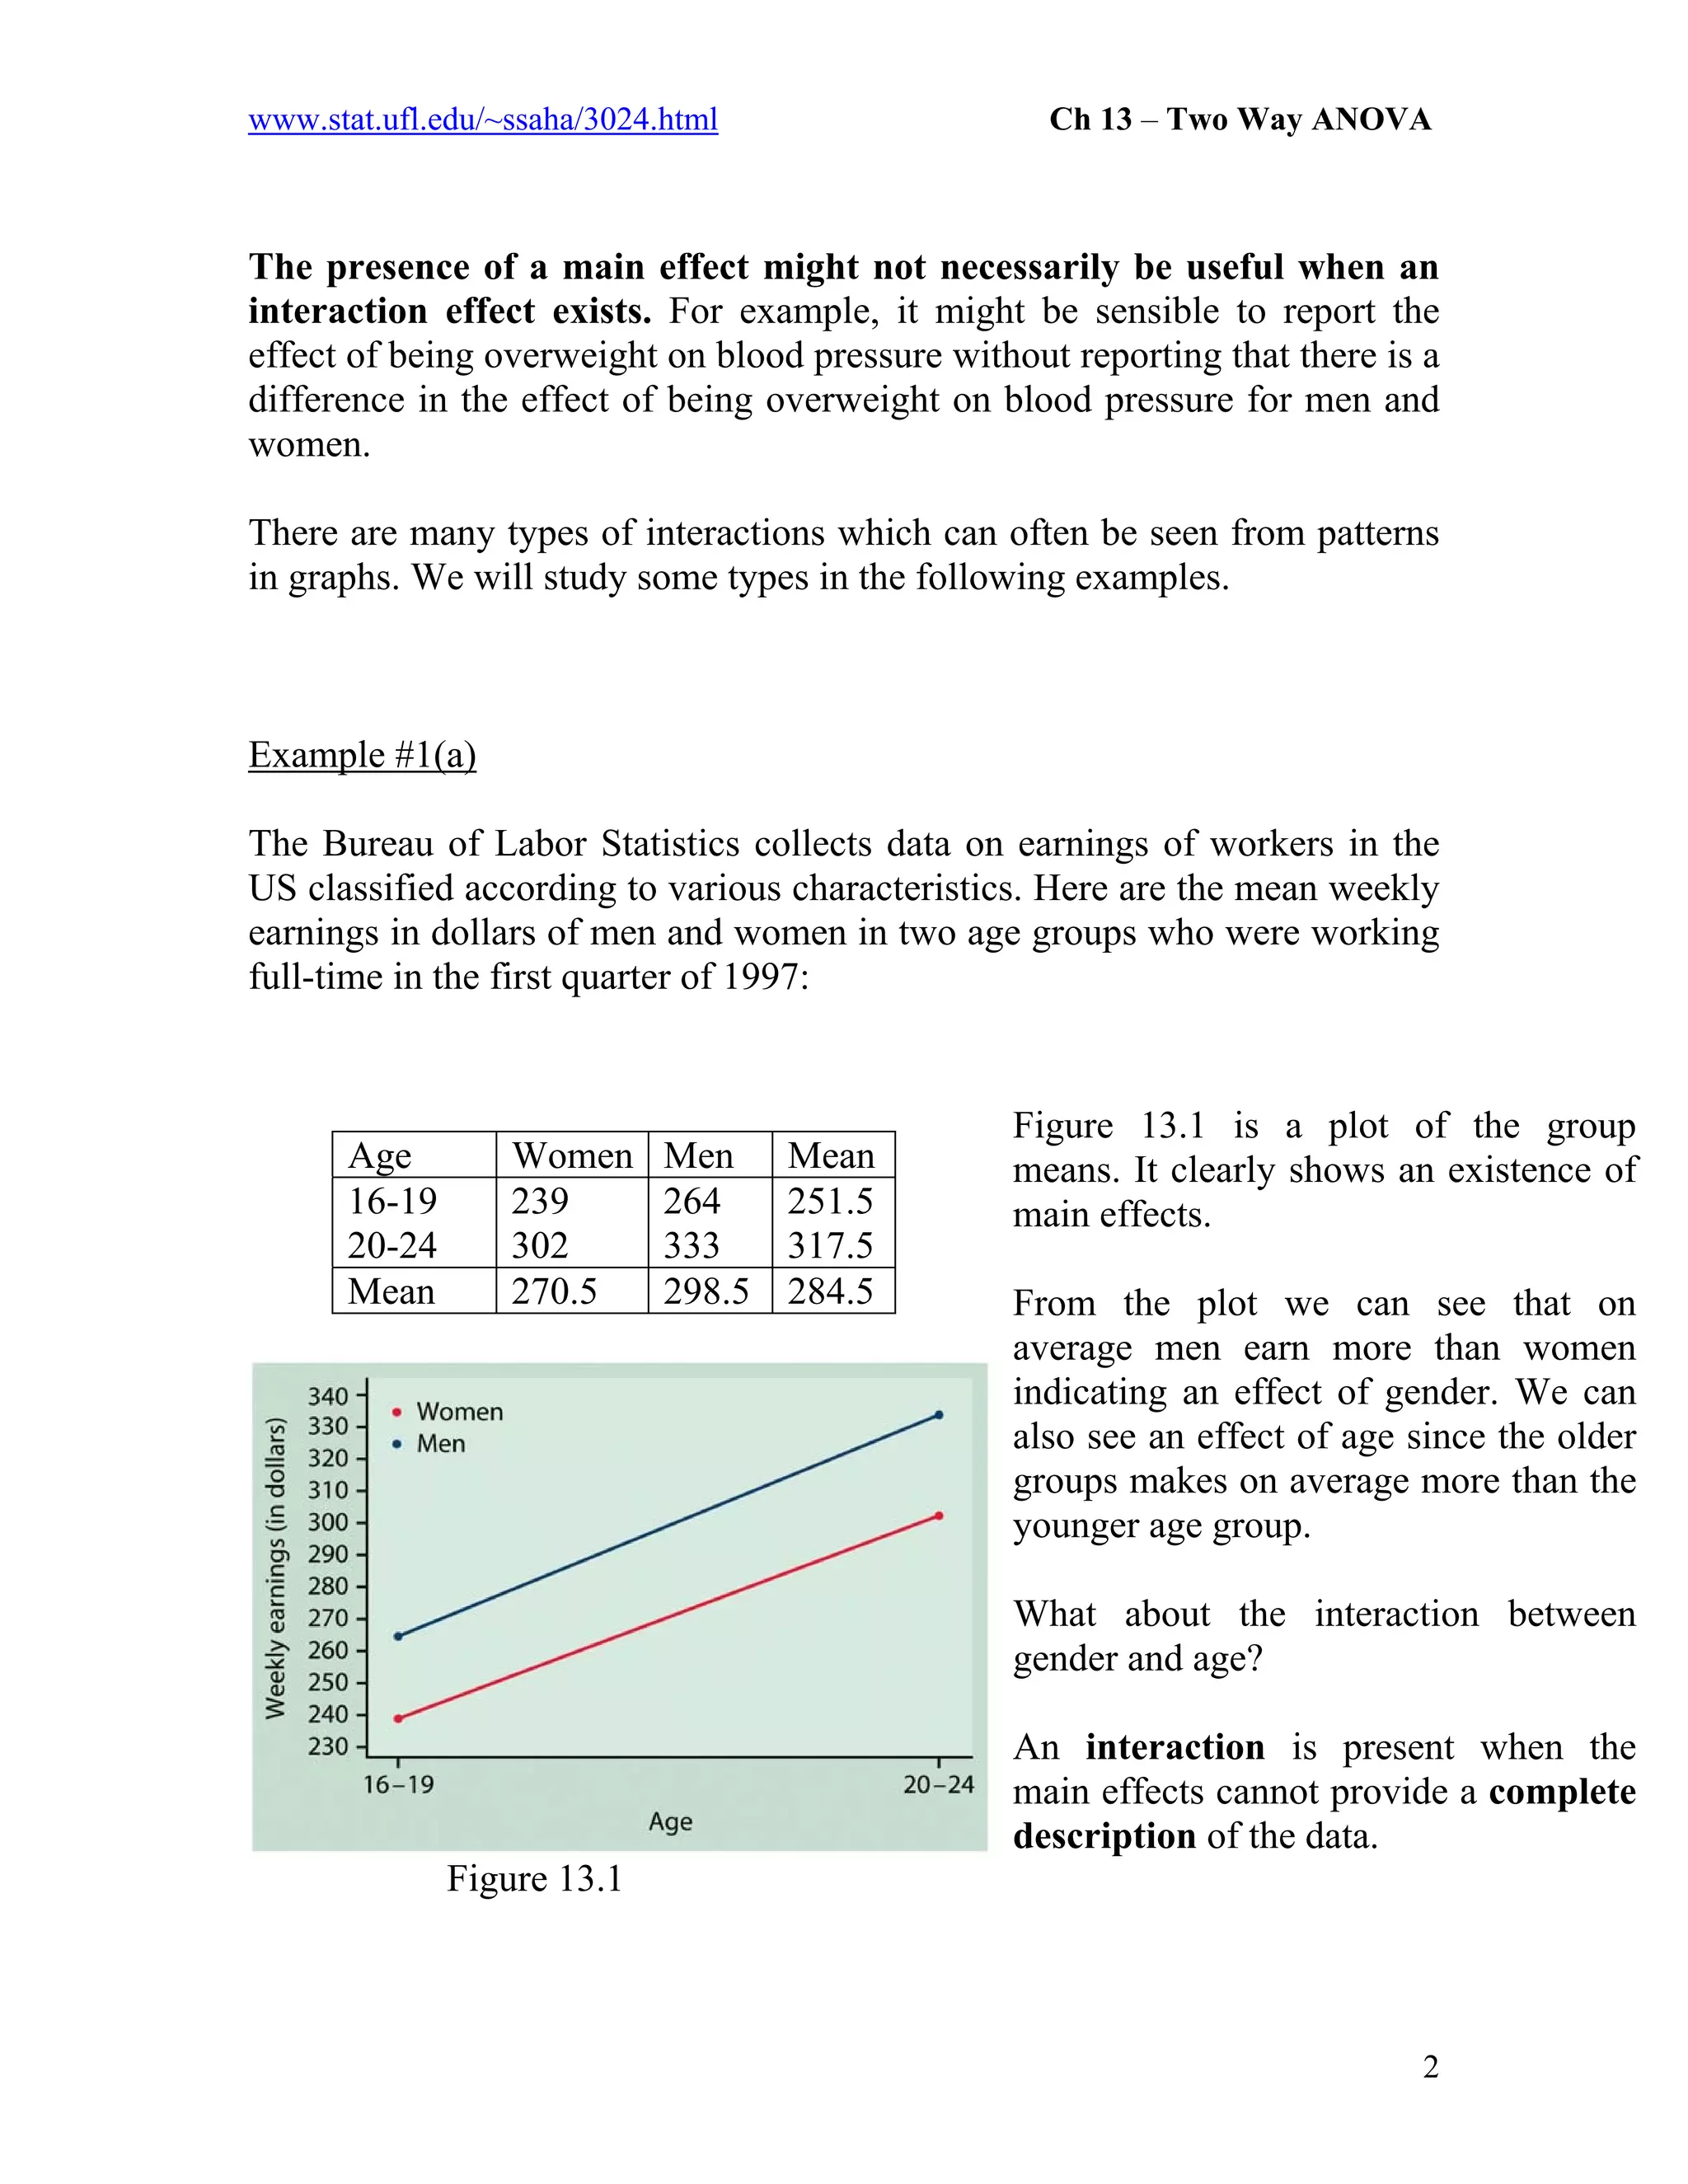
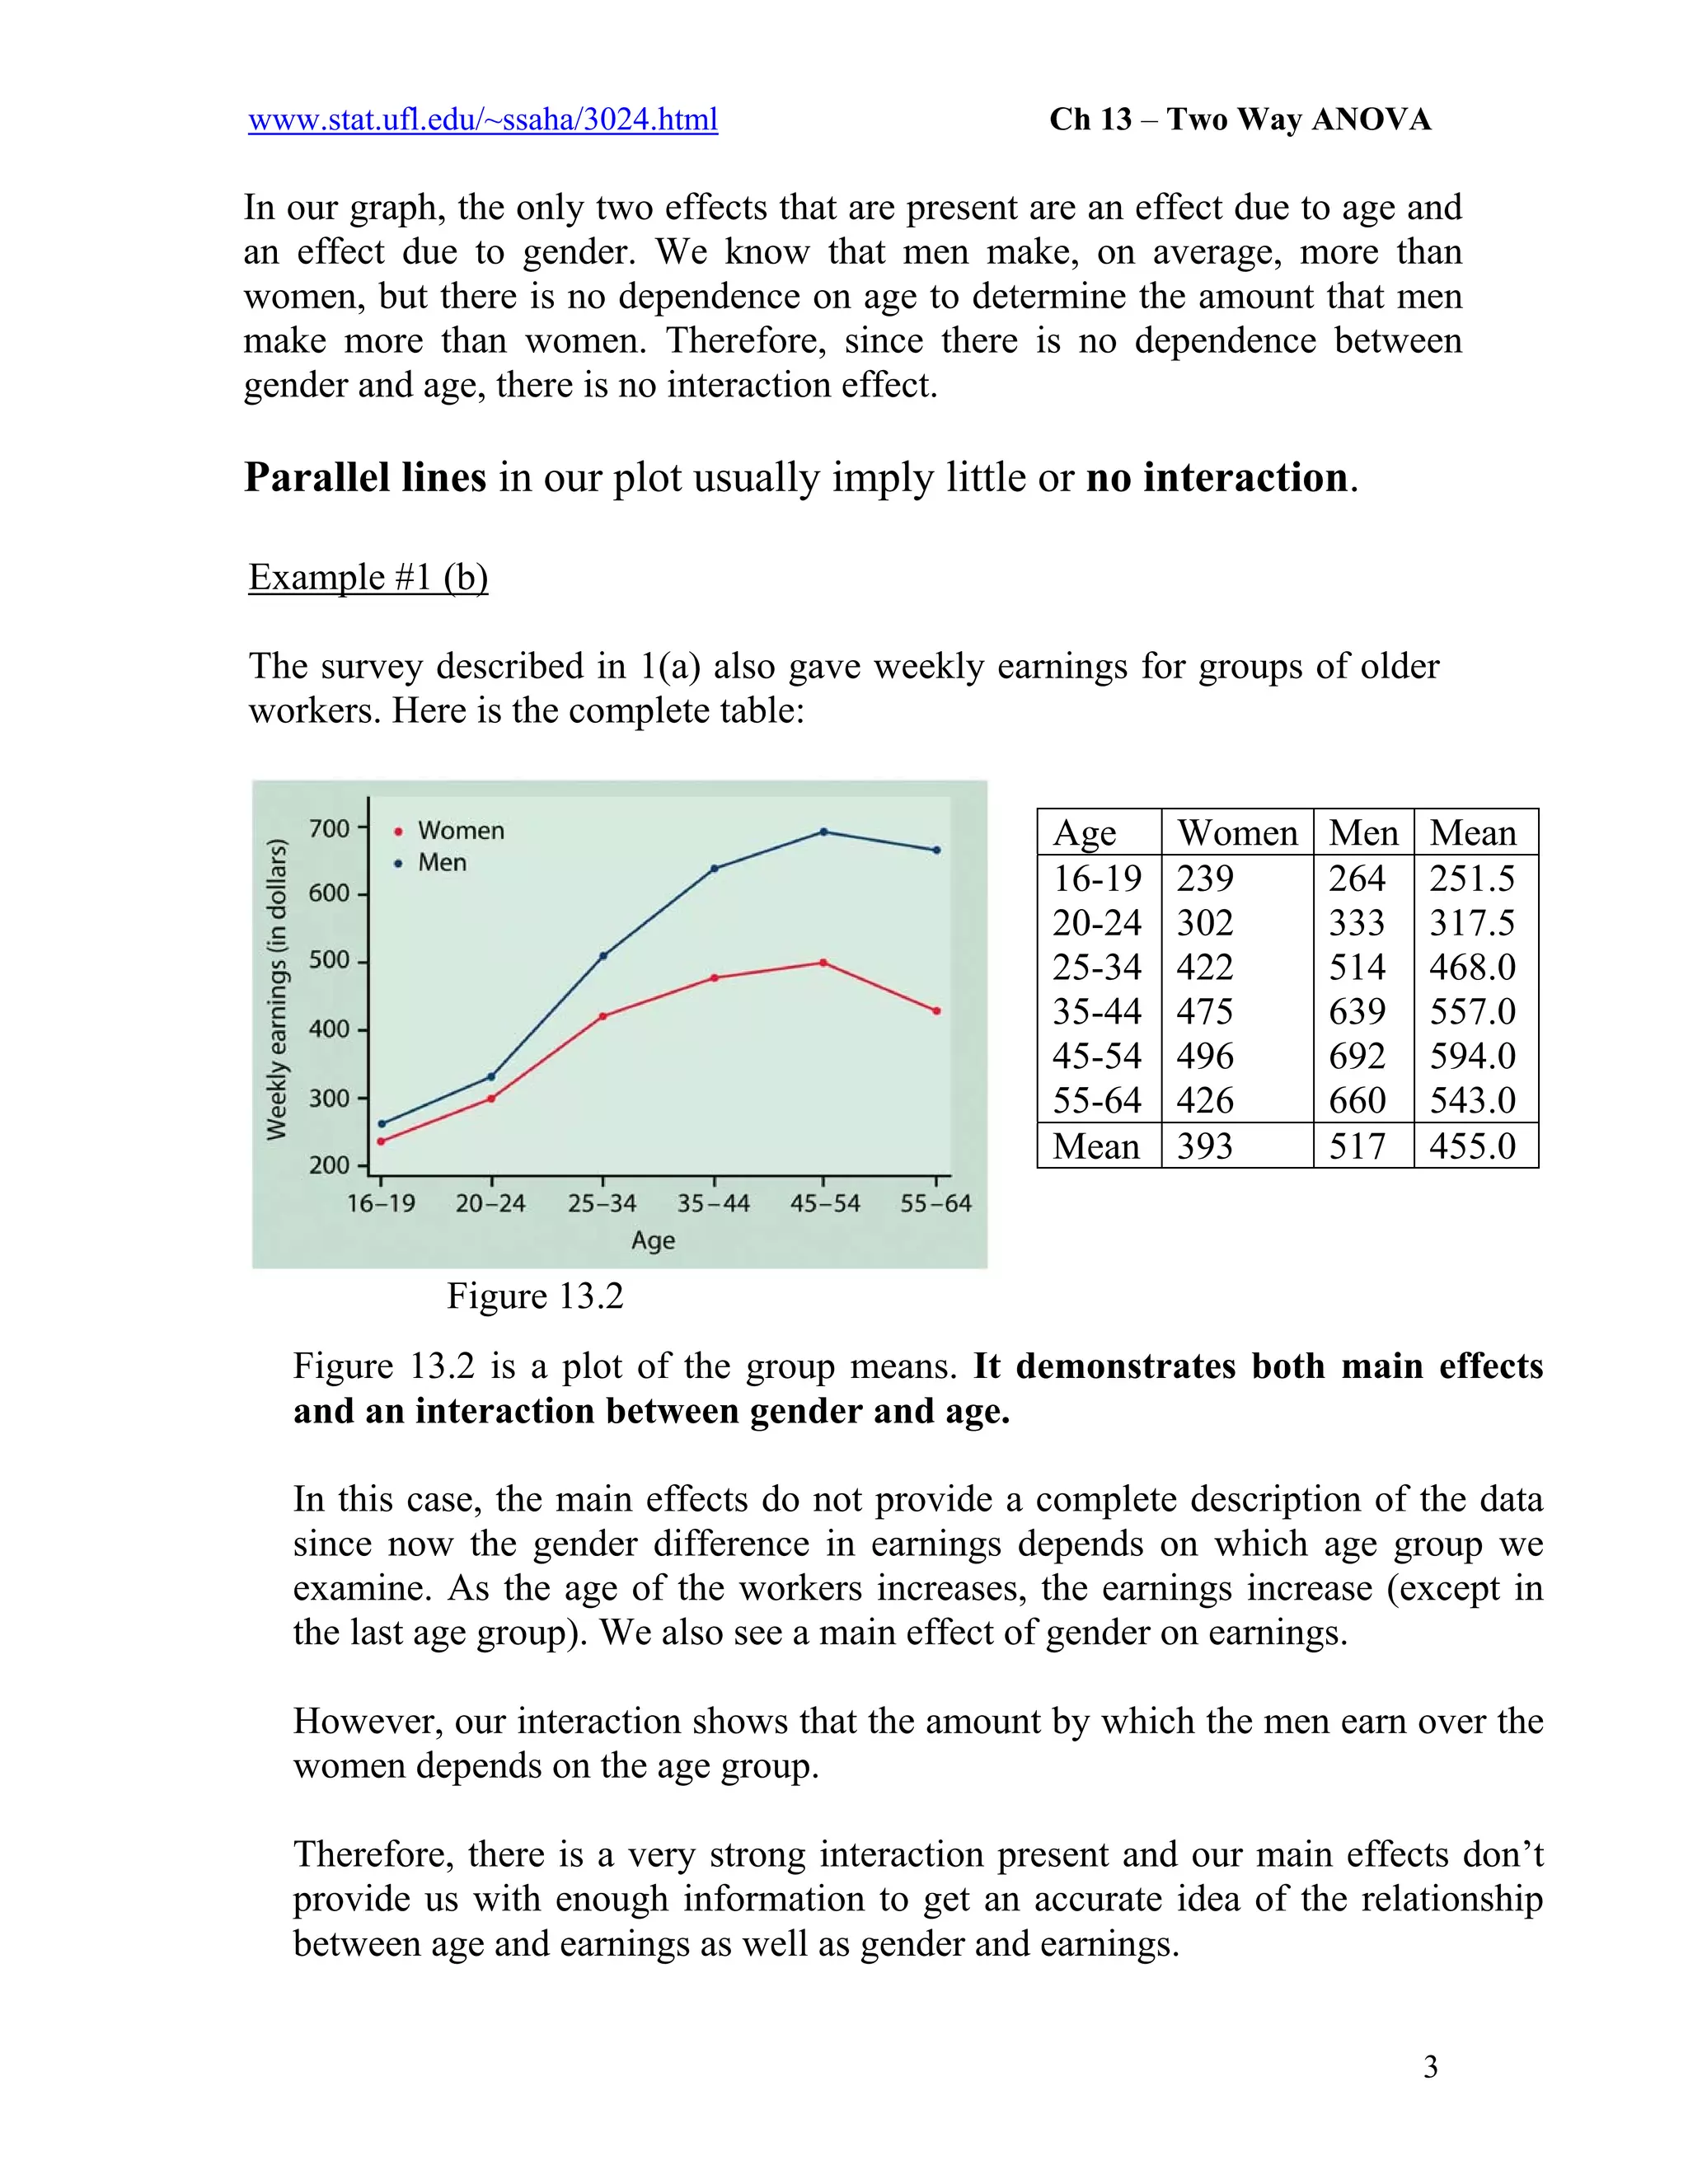
SlideShare a Scribd company logo
www.stat.ufl.edu/~ssaha/3024.html Ch 13 – Two Way ANOVA
CHAPTER 13 – TWO-WAY ANALYSIS OF VARIANCE
Two-way ANOVA has many of the same ideas as one-way ANOVA, with
the main difference being the inclusion of another factor (or explanatory
variable) in our model.
In the two-way ANOVA model, there are two factors, each with its own
number of levels. When we are interested in the effects of two factors, it is
much more advantageous to perform a two-way analysis of variance, as
opposed to two separate one-way ANOVAs.
There are three main advantages of two-way ANOVA:
- It is more efficient to study two factors simultaneously rather than
separately.
- We can reduce the residual variation in a model by including a
second factor thought to influence the response.
- We can investigate interactions between factors.
The interaction between two variables is usually the most interesting
feature of a two-way analysis of variance. When two factors interact, the
effect on the response variable of one explanatory variable depends on the
specific value or level of the other explanatory variable.
For example, the statement “being overweight caused greater increases in
blood pressure for men than for women” is a statement describing
interaction. The effect of weight (factor #1, categorical – overweight or not
overweight) on blood pressure (response) depends on gender (factor #2,
categorical – male or female).
The term main effect is used to describe the overall effect of a single
explanatory variable. For our previous example, there would be two main
effects: the effect of weight on blood pressure and the effect of gender on
blood pressure.
1
www.stat.ufl.edu/~ssaha/3024.html Ch 13 – Two Way ANOVA
The presence of a main effect might not necessarily be useful when an
interaction effect exists. For example, it might be sensible to report the
effect of being overweight on blood pressure without reporting that there is a
difference in the effect of being overweight on blood pressure for men and
women.
There are many types of interactions which can often be seen from patterns
in graphs. We will study some types in the following examples.
Example #1(a)
The Bureau of Labor Statistics collects data on earnings of workers in the
US classified according to various characteristics. Here are the mean weekly
earnings in dollars of men and women in two age groups who were working
full-time in the first quarter of 1997:
Age Women Men Mean
16-19
20-24
239
302
264
333
251.5
317.5
Mean 270.5 298.5 284.5
Figure 13.1 is a plot of the group
means. It clearly shows an existence of
main effects.
From the plot we can see that on
average men earn more than women
indicating an effect of gender. We can
also see an effect of age since the older
groups makes on average more than the
younger age group.
What about the interaction between
gender and age?
An interaction is present when the
main effects cannot provide a complete
description of the data.
Figure 13.1
2
www.stat.ufl.edu/~ssaha/3024.html Ch 13 – Two Way ANOVA
In our graph, the only two effects that are present are an effect due to age and
an effect due to gender. We know that men make, on average, more than
women, but there is no dependence on age to determine the amount that men
make more than women. Therefore, since there is no dependence between
gender and age, there is no interaction effect.
Parallel lines in our plot usually imply little or no interaction.
Example #1 (b)
The survey described in 1(a) also gave weekly earnings for groups of older
workers. Here is the complete table:
Figure 13.2
Age Women Men Mean
16-19
20-24
25-34
35-44
45-54
55-64
239
302
422
475
496
426
264
333
514
639
692
660
251.5
317.5
468.0
557.0
594.0
543.0
Mean 393 517 455.0
Figure 13.2 is a plot of the group means. It demonstrates both main effects
and an interaction between gender and age.
In this case, the main effects do not provide a complete description of the data
since now the gender difference in earnings depends on which age group we
examine. As the age of the workers increases, the earnings increase (except in
the last age group). We also see a main effect of gender on earnings.
However, our interaction shows that the amount by which the men earn over the
women depends on the age group.
Therefore, there is a very strong interaction present and our main effects don’t
provide us with enough information to get an accurate idea of the relationship
between age and earnings as well as gender and earnings.
3
www.stat.ufl.edu/~ssaha/3024.html Ch 13 – Two Way ANOVA
Example #2
A study of the energy expenditure of farmers in Burkina Faso collected data
during the wet and dry seasons. The farmers grow millet during the wet
season. In the dry season there is very little activity because the ground is
too hard to grow crops. The mean energy expended (in calories) by men
and women in Burkina Faso during the wet and dry seasons is given in the
following table:
Season Men Women Mean
Dry
Wet
2310
3460
2320
2890
2315
3175
Mean 2885 2605 2745
During the dry season both men and women
use about the same amount of energy.
However, during the wet season, both
genders burn more calories. Therefore, there
is an effect of season on the number of
calories burned.
During the wet season, since it is the custom
for men to do most of the field work, they
use more energy on average than women.
Therefore, there is an effect of gender on the
number of calories burned, but only in the
wet season.
So there is an interaction between gender
and season, as well as main effects of both
factors.
Figure 13.3
4
www.stat.ufl.edu/~ssaha/3024.html Ch 13 – Two Way ANOVA
THE TWO-WAY ANOVA MODEL
When discussing two-way ANOVA models, we will use the labels A and B
to represent our two factors. In examples, we will use the factor names so
that we can easily see the meaning of each variable.
We use I to represent the number of levels of factor A and J to represent the
number of levels of factor B. Therefore, we call the general two-way
problem an I x J ANOVA, since every level of A is combined with every
level of B, so that I x J groups are compared.
The sample size for level i of factor A and level j of factor B is nij. The total
number of observations is N = Σ nij.
Example #3
A company wants to compare three different training programs for its new
employees. Each of these programs takes 8 hours to complete. The training
can be given for 8 hours on one day or for 4 hours on two consecutive days.
The next 120 employees that the company hires will be the subjects for this
study. After the training is completed, the employees are asked to evaluate
the effectiveness of the program on a 7-point scale. Identify the response and
explanatory variables, state the number of levels for each factor (I and J) and
the total number of observations (N).
5
www.stat.ufl.edu/~ssaha/3024.html Ch 13 – Two Way ANOVA
Solution:
Explanatory variables:
1) Training program (I = 3 levels)
2) The manner in which the employee does the training (J = 2 levels: 8
hrs f or one day, 4 hrs on two consecutive days).
Response variable: the 7-point scaled effectiveness score
Total number of observations N = 120
_____________________________________________________________
For our two-way ANOVA, we assume to have independent SRSs of size nij
from each of I x J normal populations. The population means µij may differ,
but all populations must have the same standard deviation σ.
Let xijk be the kth
observation from the population having factor A at level i
and factor B at level j. Since our observations differ from their mean by a
value of εijk (xijk – µij = εijk), we can write our two-way ANOVA model in
the form: xijk = µij + εijk.
In this case, i = 1,2, …, I, j = 1,2,…, J, k = 1,2,…,nij and the deviations εijk
are normally distributed with mean 0 and standard deviation σ.
As in the previous chapters, we can describe our model by DATA = FIT +
RESIDUAL. In this case, the fit part of our model is the means µij, (since
we use each mean to describe each population) and the residual part is the
deviations εijk of the individual observations from their group means.
Our population means µij and the population standard deviations are all
unknown. Therefore, we pick simple random samples (SRSs) to learn about
the relationship between our factors and the response in our samples and
then use that to estimate the relationship in our population.
6
www.stat.ufl.edu/~ssaha/3024.html Ch 13 – Two Way ANOVA
PARAMETER ESTIMATES
The population mean for the group with level i of factor A and level j of
factor B is represented by µij. It can be estimated by
1
1 ijn
ij ijk
ij k
x x
n =
= ∑ .
Since every σ (population standard deviation) is assumed to be the same in
two-way ANOVA, we can pool all of our estimates (sample standard
deviations) to give one estimate of the population standard deviation.
2
2 ( 1)
( 1)
ij ij
p
ij
n s
s
n
−
=
−
∑
∑ and
2
p ps s=
Just like in one-way ANOVA, sp
2
= MSE, and so the numerator of sp
2
is
equal to SSE and the denominator is equal to DFE (since we have ( 1ijn )−∑ =
N - IJ, so we have N observations being compared to IJ sample means).
7
www.stat.ufl.edu/~ssaha/3024.html Ch 13 – Two Way ANOVA
Example #4
Students in a statistics class gave information on their height and weight and
also reported their perception of their weight (about right, underweight,
overweight). The body mass index, BMI, was calculated for each
combination of student gender and perception of weight category (BMI =
Weight/Height). Calculate each sample mean based on the data.
Perception of Weight
Underweight About Right Overweight
Female 20.2 20.6 18.1 21.4 22.5 23.1 20.9 24.5 26.0 22.7 24.6
Male 23.8 20.5 23.4 26.5 22.2 24.0 28.1 26.4 27.7
Solution:
Let factor A be the perception of weight and let factor B be gender. Within
factor A, let level 1 be underweight, level 2 be about right, and level 3 be
overweight. Within factor B (gender), let level 1 be female and let level 2 be
male. So µ11 corresponds to the population mean BMI of underweight
females, µ12 corresponds to the population mean BMI of underweight males,
and so on. So to estimate these population values, we use xij(bar) to estimate
µij for i=1,2,3 and j=1,2.
Now,
x11(bar) = (20.2 + 20.6 + 18.1 + 21.4) / 4 = 20.075
x12(bar) = (23.8 + 20.5) / 2 = 22.15
x21(bar) = (22.5 + 23.1 + 20.9) / 3 = 21.167
x22(bar) = (23.4 + 26.5 + 22.2 + 24.0) / 4 = 24.025
x31(bar) = (24.5 + 26 + 22.7 + 24.6) / 4 = 24.45
x32(bar) = (28.1 + 26.4 + 27.7) / 3 = 27.4
Note: (bar) just means that the x has a bar over it (indicating a mean).
8
www.stat.ufl.edu/~ssaha/3024.html Ch 13 – Two Way ANOVA
TWO-WAY ANOVA TABLE
In two-way ANOVA, there are three F statistics that are calculated and used
in significance tests: two that test for the main effects and one that tests for
an interaction.
Therefore, the sum of squares for our FIT (SSM) is made up of three parts:
SSA - sum of squares for factor A
SSB - sum of squares for factor B
SSAB - sum of squares for the interaction between factor A
and factor B
Our total sum of squares and total degrees of freedom are still the sum of the
sources of variation and degrees of freedom in our model.
SST = SSA + SSB + SSAB + SSE
DFT = DFA + DFB + DFAB + DFE
When our sample sizes are different, do not be alarmed if our sums of
squares do not add up to our given SST. When our sample sizes are
different, this can cause sums of squares which don’t add.
Since we have I levels of factor A, DFA = I – 1.
Since we have J levels of factor B, DFB = J – 1.
Since SSM = SSA + SSB + SSAB and DFM = IJ – 1,
DFAB = (IJ – 1) – (I – 1) – (J – 1) = (I – 1)( J – 1).
DFE = N – IJ (we have N observations and IJ sample means)
DFT = N – 1
9
www.stat.ufl.edu/~ssaha/3024.html Ch 13 – Two Way ANOVA
TWO-WAY ANOVA TABLE
Source
Degrees of
Freedom Sums of Squares Mean Square F
A I – 1 SSA SSA/DFA MSA/MSE
B J – 1 SSB SSB/DFB MSB/MSE
AB (I – 1)(J – 1) SSAB SSAB/DFAB MSAB/MSE
Error N – IJ SSE SSE/DFE
Total N - 1 SST
Remember that when we do a two-way ANOVA, we need to assume that
our data is normally distributed and that the population standard
deviations are equal.
Therefore, we must make sure that twice our smallest sample standard
deviation is larger than our largest standard deviation.
10
www.stat.ufl.edu/~ssaha/3024.html Ch 13 – Two Way ANOVA
HYPOTHESES FOR TWO-WAY ANOVA
To test the main effect of A:
H0: No main effect of A Ha: There exists a main effect of factor A
F = MSA Compare to F(I-1, N-IJ)
MSE
To test the main effect of B:
H0: No main effect of B Ha: There exists a main effect of factor B
F = MSB Compare to F(J-1, N-IJ)
MSE
To test the interaction of A and B:
H0: No interaction Ha: There exists an interaction between factor A and
factor B
F = MSAB Compare to F((I-1)(J-1), N-IJ)
MSE
11
www.stat.ufl.edu/~ssaha/3024.html Ch 13 – Two Way ANOVA
Example #5
When a restaurant server writes a friendly note or draws a “happy face” on
your restaurant check, is this just a friendly act or is there a financial
incentive? Psychologists conducted a randomized experiment to investigate
whether drawing a happy face on the back of a restaurant bill increased the
average tip given to the server. One female server and one male server in a
Philadelphia restaurant either did or did not draw a happy face on checks
during the experiment. In all they drew happy faces on 45 checks and did not
draw happy faces on 44 checks. The sequence of drawing the happy faces or
not was random.
a) Identify the response and explanatory variables, state the number of levels
for each factor (I and J) and the total number of observations (N).
Solution:
Response variable: tip
Explanatory variables: gender of server (2 levels), message (2 levels, yes or
no)
Total number of observations: N = 89
b) Complete the following two-way ANOVA table and then perform the
appropriate F tests for main effects and interaction and state your
conclusions.
Try to fill the table in on your own (answer is below):
Source DF SS MS F
Message 14.7
Gender 2602.0
Interaction 438.7
Error 109.8
Total 12407.9
12
www.stat.ufl.edu/~ssaha/3024.html Ch 13 – Two Way ANOVA
Solution:
Source DF SS MS F
Message 1 14.7 14.7 0.134
Gender 1 2602.0 2602.0 23.7
Interaction 1 438.7 438.7 4.0
Error 85 9333.0 109.8
Total 88 12407.9 ---
H0: No main effect of message
Ha: A main effect of message exists
Test Statistic: F0 = 14.7/109.8 = 0.134 with numerator degrees of freedom 1
and denominator degrees of freedom 85.
Decision Rule: This test statistic corresponds to a p-value of 0.7152. We do
not have any evidence to reject the null hypothesis that there is main effect
of message on the average amount a server gets tipped.
_____________________________________________________________
H0: No main effect of gender
Ha: A main effect of gender exists
Test Statistic: F0 = 2602/109.8 = 23.7 with numerator df = 1 and
denominator df = 85.
Decision Rule: This test statistic corresponds to a p-value of less than .0001.
We have very strong evidence that a main effect of gender does exist.
_____________________________________________________________
H0: No interaction effect between gender and message
Ha: An interaction effect between gender and message exists.
Test Statistic: F0 = 438.7/109.8 = 4.0 with numerator df = 1 and
denominator df = 85.
Decision Rule: This test statistic corresponds to a p-value of .0487. We
have evidence to reject the null hypothesis of no interaction at the α = 0.05
level. We have reason to believe that there is an interaction effect.
_____________________________________________________________
13

More Related Content

What's hot

Two Way ANOVA
Two Way ANOVATwo Way ANOVA
Ch6 Testing the Difference between Means, Variances
Ch6 Testing the Difference between Means, VariancesCh6 Testing the Difference between Means, Variances
Ch6 Testing the Difference between Means, Variances
Farhan Alfin
 
T test
T testT test
Analysis of variance anova
Analysis of variance anovaAnalysis of variance anova
Sign test
Sign testSign test
Sign test
sukhpal0015
 
F test and ANOVA
F test and ANOVAF test and ANOVA
F test and ANOVA
Parag Shah
 
Non Parametric Tests
Non Parametric TestsNon Parametric Tests
Non Parametric Tests
Zarrin Ansari
 
Kruskal Wallis test, Friedman test, Spearman Correlation
Kruskal Wallis test, Friedman test, Spearman CorrelationKruskal Wallis test, Friedman test, Spearman Correlation
Kruskal Wallis test, Friedman test, Spearman Correlation
Rizwan S A
 
Parametric vs Non-Parametric
Parametric vs Non-ParametricParametric vs Non-Parametric
Parametric vs Non-Parametric
Aniruddha Deshmukh
 
Introduction to t-tests (statistics)
Introduction to t-tests (statistics)Introduction to t-tests (statistics)
Introduction to t-tests (statistics)
Dr Bryan Mills
 
Non parametric-tests
Non parametric-testsNon parametric-tests
Non parametric-tests
Asmita Bhagdikar
 
Analysis of Variance (ANOVA)
Analysis of Variance (ANOVA)Analysis of Variance (ANOVA)
Analysis of Variance (ANOVA)
Avjinder (Avi) Kaler
 
Analysis of variance ppt @ bec doms
Analysis of variance ppt @ bec domsAnalysis of variance ppt @ bec doms
Analysis of variance ppt @ bec doms
Babasab Patil
 
Kruskal Wall Test
Kruskal Wall TestKruskal Wall Test
Kruskal Wall Test
Khadijah Sohail
 
Non parametric test
Non parametric testNon parametric test
Non parametric test
Neetathakur3
 
Applications of t, f and chi2 distributions
Applications of t, f and chi2 distributionsApplications of t, f and chi2 distributions
Applications of t, f and chi2 distributions
JMB
 
Analysis of variance (ANOVA) everything you need to know
Analysis of variance (ANOVA) everything you need to knowAnalysis of variance (ANOVA) everything you need to know
Analysis of variance (ANOVA) everything you need to know
Stat Analytica
 
One way anova
One way anovaOne way anova
One way anova
Kemal İnciroğlu
 
Ancova and Mancova
Ancova and MancovaAncova and Mancova
Ancova and Mancova
Prum Rotana
 
Anova in easyest way
Anova in easyest wayAnova in easyest way
Anova in easyest way
Bidyut Ghosh
 

What's hot (20)

Two Way ANOVA
Two Way ANOVATwo Way ANOVA
Two Way ANOVA
 
Ch6 Testing the Difference between Means, Variances
Ch6 Testing the Difference between Means, VariancesCh6 Testing the Difference between Means, Variances
Ch6 Testing the Difference between Means, Variances
 
T test
T testT test
T test
 
Analysis of variance anova
Analysis of variance anovaAnalysis of variance anova
Analysis of variance anova
 
Sign test
Sign testSign test
Sign test
 
F test and ANOVA
F test and ANOVAF test and ANOVA
F test and ANOVA
 
Non Parametric Tests
Non Parametric TestsNon Parametric Tests
Non Parametric Tests
 
Kruskal Wallis test, Friedman test, Spearman Correlation
Kruskal Wallis test, Friedman test, Spearman CorrelationKruskal Wallis test, Friedman test, Spearman Correlation
Kruskal Wallis test, Friedman test, Spearman Correlation
 
Parametric vs Non-Parametric
Parametric vs Non-ParametricParametric vs Non-Parametric
Parametric vs Non-Parametric
 
Introduction to t-tests (statistics)
Introduction to t-tests (statistics)Introduction to t-tests (statistics)
Introduction to t-tests (statistics)
 
Non parametric-tests
Non parametric-testsNon parametric-tests
Non parametric-tests
 
Analysis of Variance (ANOVA)
Analysis of Variance (ANOVA)Analysis of Variance (ANOVA)
Analysis of Variance (ANOVA)
 
Analysis of variance ppt @ bec doms
Analysis of variance ppt @ bec domsAnalysis of variance ppt @ bec doms
Analysis of variance ppt @ bec doms
 
Kruskal Wall Test
Kruskal Wall TestKruskal Wall Test
Kruskal Wall Test
 
Non parametric test
Non parametric testNon parametric test
Non parametric test
 
Applications of t, f and chi2 distributions
Applications of t, f and chi2 distributionsApplications of t, f and chi2 distributions
Applications of t, f and chi2 distributions
 
Analysis of variance (ANOVA) everything you need to know
Analysis of variance (ANOVA) everything you need to knowAnalysis of variance (ANOVA) everything you need to know
Analysis of variance (ANOVA) everything you need to know
 
One way anova
One way anovaOne way anova
One way anova
 
Ancova and Mancova
Ancova and MancovaAncova and Mancova
Ancova and Mancova
 
Anova in easyest way
Anova in easyest wayAnova in easyest way
Anova in easyest way
 

Similar to 2 way ANOVA(Analysis Of VAriance

Calculating Analysis of Variance (ANOVA) and Post Hoc Analyses Follo.docx
Calculating Analysis of Variance (ANOVA) and Post Hoc Analyses Follo.docxCalculating Analysis of Variance (ANOVA) and Post Hoc Analyses Follo.docx
Calculating Analysis of Variance (ANOVA) and Post Hoc Analyses Follo.docx
aman341480
 
Applied Statistics
Applied StatisticsApplied Statistics
Applied Statistics
Ishtiaq Ishaq
 
Trochim, W. M. K. (2006). Internal validity.httpwww.socialres
Trochim, W. M. K. (2006). Internal validity.httpwww.socialresTrochim, W. M. K. (2006). Internal validity.httpwww.socialres
Trochim, W. M. K. (2006). Internal validity.httpwww.socialres
curranalmeta
 
Excel Practice 2 Alexa Mancillas EC.docx
Excel Practice 2  Alexa Mancillas EC.docxExcel Practice 2  Alexa Mancillas EC.docx
Excel Practice 2 Alexa Mancillas EC.docx
cravennichole326
 
Modeling external events in the three-level analysisof multi
Modeling external events in the three-level analysisof multiModeling external events in the three-level analysisof multi
Modeling external events in the three-level analysisof multi
IlonaThornburg83
 
16 USING LINEAR REGRESSION PREDICTING THE FUTURE16 MEDIA LIBRAR.docx
16 USING LINEAR REGRESSION PREDICTING THE FUTURE16 MEDIA LIBRAR.docx16 USING LINEAR REGRESSION PREDICTING THE FUTURE16 MEDIA LIBRAR.docx
16 USING LINEAR REGRESSION PREDICTING THE FUTURE16 MEDIA LIBRAR.docx
hyacinthshackley2629
 
16 USING LINEAR REGRESSION PREDICTING THE FUTURE16 MEDIA LIBRAR.docx
16 USING LINEAR REGRESSION PREDICTING THE FUTURE16 MEDIA LIBRAR.docx16 USING LINEAR REGRESSION PREDICTING THE FUTURE16 MEDIA LIBRAR.docx
16 USING LINEAR REGRESSION PREDICTING THE FUTURE16 MEDIA LIBRAR.docx
novabroom
 
Bus 173_4.pptx
Bus 173_4.pptxBus 173_4.pptx
Bus 173_4.pptx
ssuserbea996
 
Article Write-upsTo help you connect what you’re learning in cl.docx
Article Write-upsTo help you connect what you’re learning in cl.docxArticle Write-upsTo help you connect what you’re learning in cl.docx
Article Write-upsTo help you connect what you’re learning in cl.docx
davezstarr61655
 
Consumer Spending causing unemployment analysis
Consumer Spending causing unemployment analysisConsumer Spending causing unemployment analysis
Consumer Spending causing unemployment analysis
Gaetan Lion
 
Section 1 Data File DescriptionThe fictional data represents a te.docx
Section 1 Data File DescriptionThe fictional data represents a te.docxSection 1 Data File DescriptionThe fictional data represents a te.docx
Section 1 Data File DescriptionThe fictional data represents a te.docx
bagotjesusa
 
Chi-square tests are great to show if distributions differ or i.docx
 Chi-square tests are great to show if distributions differ or i.docx Chi-square tests are great to show if distributions differ or i.docx
Chi-square tests are great to show if distributions differ or i.docx
MARRY7
 
Chapter 18 – Pricing Setting in the Business WorldThere are few .docx
Chapter 18 – Pricing Setting in the Business WorldThere are few .docxChapter 18 – Pricing Setting in the Business WorldThere are few .docx
Chapter 18 – Pricing Setting in the Business WorldThere are few .docx
robert345678
 
Correlation: Bivariate Data and Scatter Plot
Correlation: Bivariate Data and Scatter PlotCorrelation: Bivariate Data and Scatter Plot
Correlation: Bivariate Data and Scatter Plot
DenzelMontuya1
 
Correlational Study
Correlational StudyCorrelational Study
Correlational Study
Vikramjit Singh
 
MANOVA (July 2014 updated)
MANOVA (July 2014 updated)MANOVA (July 2014 updated)
MANOVA (July 2014 updated)
Michael Ling
 
Week 3 Lecture 9 Effect Size When we reject the null h.docx
Week 3 Lecture 9 Effect Size When we reject the null h.docxWeek 3 Lecture 9 Effect Size When we reject the null h.docx
Week 3 Lecture 9 Effect Size When we reject the null h.docx
cockekeshia
 
Degree exam 2019 q & a (1) (1)
Degree exam 2019 q & a (1) (1)Degree exam 2019 q & a (1) (1)
Degree exam 2019 q & a (1) (1)
OsamaKhan404075
 
Katagorisel veri analizi
Katagorisel veri analiziKatagorisel veri analizi
Katagorisel veri analizi
Burak Kocak
 
Quality Engineering material
Quality Engineering materialQuality Engineering material
Quality Engineering material
TeluguSudhakar3
 

Similar to 2 way ANOVA(Analysis Of VAriance (20)

Calculating Analysis of Variance (ANOVA) and Post Hoc Analyses Follo.docx
Calculating Analysis of Variance (ANOVA) and Post Hoc Analyses Follo.docxCalculating Analysis of Variance (ANOVA) and Post Hoc Analyses Follo.docx
Calculating Analysis of Variance (ANOVA) and Post Hoc Analyses Follo.docx
 
Applied Statistics
Applied StatisticsApplied Statistics
Applied Statistics
 
Trochim, W. M. K. (2006). Internal validity.httpwww.socialres
Trochim, W. M. K. (2006). Internal validity.httpwww.socialresTrochim, W. M. K. (2006). Internal validity.httpwww.socialres
Trochim, W. M. K. (2006). Internal validity.httpwww.socialres
 
Excel Practice 2 Alexa Mancillas EC.docx
Excel Practice 2  Alexa Mancillas EC.docxExcel Practice 2  Alexa Mancillas EC.docx
Excel Practice 2 Alexa Mancillas EC.docx
 
Modeling external events in the three-level analysisof multi
Modeling external events in the three-level analysisof multiModeling external events in the three-level analysisof multi
Modeling external events in the three-level analysisof multi
 
16 USING LINEAR REGRESSION PREDICTING THE FUTURE16 MEDIA LIBRAR.docx
16 USING LINEAR REGRESSION PREDICTING THE FUTURE16 MEDIA LIBRAR.docx16 USING LINEAR REGRESSION PREDICTING THE FUTURE16 MEDIA LIBRAR.docx
16 USING LINEAR REGRESSION PREDICTING THE FUTURE16 MEDIA LIBRAR.docx
 
16 USING LINEAR REGRESSION PREDICTING THE FUTURE16 MEDIA LIBRAR.docx
16 USING LINEAR REGRESSION PREDICTING THE FUTURE16 MEDIA LIBRAR.docx16 USING LINEAR REGRESSION PREDICTING THE FUTURE16 MEDIA LIBRAR.docx
16 USING LINEAR REGRESSION PREDICTING THE FUTURE16 MEDIA LIBRAR.docx
 
Bus 173_4.pptx
Bus 173_4.pptxBus 173_4.pptx
Bus 173_4.pptx
 
Article Write-upsTo help you connect what you’re learning in cl.docx
Article Write-upsTo help you connect what you’re learning in cl.docxArticle Write-upsTo help you connect what you’re learning in cl.docx
Article Write-upsTo help you connect what you’re learning in cl.docx
 
Consumer Spending causing unemployment analysis
Consumer Spending causing unemployment analysisConsumer Spending causing unemployment analysis
Consumer Spending causing unemployment analysis
 
Section 1 Data File DescriptionThe fictional data represents a te.docx
Section 1 Data File DescriptionThe fictional data represents a te.docxSection 1 Data File DescriptionThe fictional data represents a te.docx
Section 1 Data File DescriptionThe fictional data represents a te.docx
 
Chi-square tests are great to show if distributions differ or i.docx
 Chi-square tests are great to show if distributions differ or i.docx Chi-square tests are great to show if distributions differ or i.docx
Chi-square tests are great to show if distributions differ or i.docx
 
Chapter 18 – Pricing Setting in the Business WorldThere are few .docx
Chapter 18 – Pricing Setting in the Business WorldThere are few .docxChapter 18 – Pricing Setting in the Business WorldThere are few .docx
Chapter 18 – Pricing Setting in the Business WorldThere are few .docx
 
Correlation: Bivariate Data and Scatter Plot
Correlation: Bivariate Data and Scatter PlotCorrelation: Bivariate Data and Scatter Plot
Correlation: Bivariate Data and Scatter Plot
 
Correlational Study
Correlational StudyCorrelational Study
Correlational Study
 
MANOVA (July 2014 updated)
MANOVA (July 2014 updated)MANOVA (July 2014 updated)
MANOVA (July 2014 updated)
 
Week 3 Lecture 9 Effect Size When we reject the null h.docx
Week 3 Lecture 9 Effect Size When we reject the null h.docxWeek 3 Lecture 9 Effect Size When we reject the null h.docx
Week 3 Lecture 9 Effect Size When we reject the null h.docx
 
Degree exam 2019 q & a (1) (1)
Degree exam 2019 q & a (1) (1)Degree exam 2019 q & a (1) (1)
Degree exam 2019 q & a (1) (1)
 
Katagorisel veri analizi
Katagorisel veri analiziKatagorisel veri analizi
Katagorisel veri analizi
 
Quality Engineering material
Quality Engineering materialQuality Engineering material
Quality Engineering material
 

More from musadoto

The design of Farm cart 0011 report 1 2020
The design of Farm cart 0011  report 1 2020The design of Farm cart 0011  report 1 2020
The design of Farm cart 0011 report 1 2020
musadoto
 
IRRIGATION SYSTEMS AND DESIGN - IWRE 317 questions collection 1997 - 2018 ...
IRRIGATION SYSTEMS AND DESIGN - IWRE 317 questions collection 1997 - 2018    ...IRRIGATION SYSTEMS AND DESIGN - IWRE 317 questions collection 1997 - 2018    ...
IRRIGATION SYSTEMS AND DESIGN - IWRE 317 questions collection 1997 - 2018 ...
musadoto
 
CONSTRUCTION [soil treatment, foundation backfill, Damp Proof Membrane[DPM] a...
CONSTRUCTION [soil treatment, foundation backfill, Damp Proof Membrane[DPM] a...CONSTRUCTION [soil treatment, foundation backfill, Damp Proof Membrane[DPM] a...
CONSTRUCTION [soil treatment, foundation backfill, Damp Proof Membrane[DPM] a...
musadoto
 
Assignment thermal 2018 . ...
Assignment thermal 2018                   .                                  ...Assignment thermal 2018                   .                                  ...
Assignment thermal 2018 . ...
musadoto
 
BASICS OF COMPUTER PROGRAMMING-TAKE HOME ASSIGNMENT 2018
BASICS OF COMPUTER PROGRAMMING-TAKE HOME ASSIGNMENT 2018BASICS OF COMPUTER PROGRAMMING-TAKE HOME ASSIGNMENT 2018
BASICS OF COMPUTER PROGRAMMING-TAKE HOME ASSIGNMENT 2018
musadoto
 
ENGINEERING SYSTEM DYNAMICS-TAKE HOME ASSIGNMENT 2018
ENGINEERING SYSTEM DYNAMICS-TAKE HOME ASSIGNMENT 2018ENGINEERING SYSTEM DYNAMICS-TAKE HOME ASSIGNMENT 2018
ENGINEERING SYSTEM DYNAMICS-TAKE HOME ASSIGNMENT 2018
musadoto
 
Hardeninig of steel (Jominy test)-CoET- udsm
Hardeninig of steel (Jominy test)-CoET- udsmHardeninig of steel (Jominy test)-CoET- udsm
Hardeninig of steel (Jominy test)-CoET- udsm
musadoto
 
Ultrasonic testing report-JUNE 2018
Ultrasonic testing report-JUNE 2018Ultrasonic testing report-JUNE 2018
Ultrasonic testing report-JUNE 2018
musadoto
 
Ae 219 - BASICS OF PASCHAL PROGRAMMING-2017 test manual solution
Ae 219 - BASICS OF PASCHAL PROGRAMMING-2017 test manual solutionAe 219 - BASICS OF PASCHAL PROGRAMMING-2017 test manual solution
Ae 219 - BASICS OF PASCHAL PROGRAMMING-2017 test manual solution
musadoto
 
Fluid mechanics ...
Fluid mechanics                                                              ...Fluid mechanics                                                              ...
Fluid mechanics ...
musadoto
 
Fluid mechanics (a letter to a friend) part 1 ...
Fluid mechanics (a letter to a friend) part 1                                ...Fluid mechanics (a letter to a friend) part 1                                ...
Fluid mechanics (a letter to a friend) part 1 ...
musadoto
 
Fluids mechanics (a letter to a friend) part 1 ...
Fluids mechanics (a letter to a friend) part 1                               ...Fluids mechanics (a letter to a friend) part 1                               ...
Fluids mechanics (a letter to a friend) part 1 ...
musadoto
 
Fresh concrete -building materials for engineers
Fresh concrete -building materials  for engineersFresh concrete -building materials  for engineers
Fresh concrete -building materials for engineers
musadoto
 
surveying- lecture notes for engineers
surveying- lecture notes for engineerssurveying- lecture notes for engineers
surveying- lecture notes for engineers
musadoto
 
Fresh concrete -building materials for engineers
Fresh concrete -building materials  for engineersFresh concrete -building materials  for engineers
Fresh concrete -building materials for engineers
musadoto
 
DIESEL ENGINE POWER REPORT -AE 215 -SOURCES OF FARM POWER
DIESEL ENGINE POWER REPORT -AE 215 -SOURCES OF FARM POWERDIESEL ENGINE POWER REPORT -AE 215 -SOURCES OF FARM POWER
DIESEL ENGINE POWER REPORT -AE 215 -SOURCES OF FARM POWER
musadoto
 
Farm and human power REPORT - AE 215-SOURCES OF FARM POWER
Farm and human power  REPORT - AE 215-SOURCES OF FARM POWER Farm and human power  REPORT - AE 215-SOURCES OF FARM POWER
Farm and human power REPORT - AE 215-SOURCES OF FARM POWER
musadoto
 
ENGINE POWER PETROL REPORT-AE 215-SOURCES OF FARM POWER
ENGINE POWER PETROL REPORT-AE 215-SOURCES OF FARM POWERENGINE POWER PETROL REPORT-AE 215-SOURCES OF FARM POWER
ENGINE POWER PETROL REPORT-AE 215-SOURCES OF FARM POWER
musadoto
 
TRACTOR POWER REPORT -AE 215 SOURCES OF FARM POWER 2018
TRACTOR POWER REPORT -AE 215  SOURCES OF FARM POWER 2018TRACTOR POWER REPORT -AE 215  SOURCES OF FARM POWER 2018
TRACTOR POWER REPORT -AE 215 SOURCES OF FARM POWER 2018
musadoto
 
WIND ENERGY REPORT AE 215- 2018 SOURCES OF FARM POWER
WIND ENERGY REPORT AE 215- 2018 SOURCES OF FARM POWERWIND ENERGY REPORT AE 215- 2018 SOURCES OF FARM POWER
WIND ENERGY REPORT AE 215- 2018 SOURCES OF FARM POWER
musadoto
 

More from musadoto (20)

The design of Farm cart 0011 report 1 2020
The design of Farm cart 0011  report 1 2020The design of Farm cart 0011  report 1 2020
The design of Farm cart 0011 report 1 2020
 
IRRIGATION SYSTEMS AND DESIGN - IWRE 317 questions collection 1997 - 2018 ...
IRRIGATION SYSTEMS AND DESIGN - IWRE 317 questions collection 1997 - 2018    ...IRRIGATION SYSTEMS AND DESIGN - IWRE 317 questions collection 1997 - 2018    ...
IRRIGATION SYSTEMS AND DESIGN - IWRE 317 questions collection 1997 - 2018 ...
 
CONSTRUCTION [soil treatment, foundation backfill, Damp Proof Membrane[DPM] a...
CONSTRUCTION [soil treatment, foundation backfill, Damp Proof Membrane[DPM] a...CONSTRUCTION [soil treatment, foundation backfill, Damp Proof Membrane[DPM] a...
CONSTRUCTION [soil treatment, foundation backfill, Damp Proof Membrane[DPM] a...
 
Assignment thermal 2018 . ...
Assignment thermal 2018                   .                                  ...Assignment thermal 2018                   .                                  ...
Assignment thermal 2018 . ...
 
BASICS OF COMPUTER PROGRAMMING-TAKE HOME ASSIGNMENT 2018
BASICS OF COMPUTER PROGRAMMING-TAKE HOME ASSIGNMENT 2018BASICS OF COMPUTER PROGRAMMING-TAKE HOME ASSIGNMENT 2018
BASICS OF COMPUTER PROGRAMMING-TAKE HOME ASSIGNMENT 2018
 
ENGINEERING SYSTEM DYNAMICS-TAKE HOME ASSIGNMENT 2018
ENGINEERING SYSTEM DYNAMICS-TAKE HOME ASSIGNMENT 2018ENGINEERING SYSTEM DYNAMICS-TAKE HOME ASSIGNMENT 2018
ENGINEERING SYSTEM DYNAMICS-TAKE HOME ASSIGNMENT 2018
 
Hardeninig of steel (Jominy test)-CoET- udsm
Hardeninig of steel (Jominy test)-CoET- udsmHardeninig of steel (Jominy test)-CoET- udsm
Hardeninig of steel (Jominy test)-CoET- udsm
 
Ultrasonic testing report-JUNE 2018
Ultrasonic testing report-JUNE 2018Ultrasonic testing report-JUNE 2018
Ultrasonic testing report-JUNE 2018
 
Ae 219 - BASICS OF PASCHAL PROGRAMMING-2017 test manual solution
Ae 219 - BASICS OF PASCHAL PROGRAMMING-2017 test manual solutionAe 219 - BASICS OF PASCHAL PROGRAMMING-2017 test manual solution
Ae 219 - BASICS OF PASCHAL PROGRAMMING-2017 test manual solution
 
Fluid mechanics ...
Fluid mechanics                                                              ...Fluid mechanics                                                              ...
Fluid mechanics ...
 
Fluid mechanics (a letter to a friend) part 1 ...
Fluid mechanics (a letter to a friend) part 1                                ...Fluid mechanics (a letter to a friend) part 1                                ...
Fluid mechanics (a letter to a friend) part 1 ...
 
Fluids mechanics (a letter to a friend) part 1 ...
Fluids mechanics (a letter to a friend) part 1                               ...Fluids mechanics (a letter to a friend) part 1                               ...
Fluids mechanics (a letter to a friend) part 1 ...
 
Fresh concrete -building materials for engineers
Fresh concrete -building materials  for engineersFresh concrete -building materials  for engineers
Fresh concrete -building materials for engineers
 
surveying- lecture notes for engineers
surveying- lecture notes for engineerssurveying- lecture notes for engineers
surveying- lecture notes for engineers
 
Fresh concrete -building materials for engineers
Fresh concrete -building materials  for engineersFresh concrete -building materials  for engineers
Fresh concrete -building materials for engineers
 
DIESEL ENGINE POWER REPORT -AE 215 -SOURCES OF FARM POWER
DIESEL ENGINE POWER REPORT -AE 215 -SOURCES OF FARM POWERDIESEL ENGINE POWER REPORT -AE 215 -SOURCES OF FARM POWER
DIESEL ENGINE POWER REPORT -AE 215 -SOURCES OF FARM POWER
 
Farm and human power REPORT - AE 215-SOURCES OF FARM POWER
Farm and human power  REPORT - AE 215-SOURCES OF FARM POWER Farm and human power  REPORT - AE 215-SOURCES OF FARM POWER
Farm and human power REPORT - AE 215-SOURCES OF FARM POWER
 
ENGINE POWER PETROL REPORT-AE 215-SOURCES OF FARM POWER
ENGINE POWER PETROL REPORT-AE 215-SOURCES OF FARM POWERENGINE POWER PETROL REPORT-AE 215-SOURCES OF FARM POWER
ENGINE POWER PETROL REPORT-AE 215-SOURCES OF FARM POWER
 
TRACTOR POWER REPORT -AE 215 SOURCES OF FARM POWER 2018
TRACTOR POWER REPORT -AE 215  SOURCES OF FARM POWER 2018TRACTOR POWER REPORT -AE 215  SOURCES OF FARM POWER 2018
TRACTOR POWER REPORT -AE 215 SOURCES OF FARM POWER 2018
 
WIND ENERGY REPORT AE 215- 2018 SOURCES OF FARM POWER
WIND ENERGY REPORT AE 215- 2018 SOURCES OF FARM POWERWIND ENERGY REPORT AE 215- 2018 SOURCES OF FARM POWER
WIND ENERGY REPORT AE 215- 2018 SOURCES OF FARM POWER
 

Recently uploaded

Bossa N’ Roll Records by Ismael Vazquez.
Bossa N’ Roll Records by Ismael Vazquez.Bossa N’ Roll Records by Ismael Vazquez.
Bossa N’ Roll Records by Ismael Vazquez.
IsmaelVazquez38
 
Oliver Asks for More by Charles Dickens (9)
Oliver Asks for More by Charles Dickens (9)Oliver Asks for More by Charles Dickens (9)
Oliver Asks for More by Charles Dickens (9)
nitinpv4ai
 
HYPERTENSION - SLIDE SHARE PRESENTATION.
HYPERTENSION - SLIDE SHARE PRESENTATION.HYPERTENSION - SLIDE SHARE PRESENTATION.
HYPERTENSION - SLIDE SHARE PRESENTATION.
deepaannamalai16
 
Traditional Musical Instruments of Arunachal Pradesh and Uttar Pradesh - RAYH...
Traditional Musical Instruments of Arunachal Pradesh and Uttar Pradesh - RAYH...Traditional Musical Instruments of Arunachal Pradesh and Uttar Pradesh - RAYH...
Traditional Musical Instruments of Arunachal Pradesh and Uttar Pradesh - RAYH...
imrankhan141184
 
Jemison, MacLaughlin, and Majumder "Broadening Pathways for Editors and Authors"
Jemison, MacLaughlin, and Majumder "Broadening Pathways for Editors and Authors"Jemison, MacLaughlin, and Majumder "Broadening Pathways for Editors and Authors"
Jemison, MacLaughlin, and Majumder "Broadening Pathways for Editors and Authors"
National Information Standards Organization (NISO)
 
Gender and Mental Health - Counselling and Family Therapy Applications and In...
Gender and Mental Health - Counselling and Family Therapy Applications and In...Gender and Mental Health - Counselling and Family Therapy Applications and In...
Gender and Mental Health - Counselling and Family Therapy Applications and In...
PsychoTech Services
 
NEWSPAPERS - QUESTION 1 - REVISION POWERPOINT.pptx
NEWSPAPERS - QUESTION 1 - REVISION POWERPOINT.pptxNEWSPAPERS - QUESTION 1 - REVISION POWERPOINT.pptx
NEWSPAPERS - QUESTION 1 - REVISION POWERPOINT.pptx
iammrhaywood
 
Level 3 NCEA - NZ: A Nation In the Making 1872 - 1900 SML.ppt
Level 3 NCEA - NZ: A  Nation In the Making 1872 - 1900 SML.pptLevel 3 NCEA - NZ: A  Nation In the Making 1872 - 1900 SML.ppt
Level 3 NCEA - NZ: A Nation In the Making 1872 - 1900 SML.ppt
Henry Hollis
 
Data Structure using C by Dr. K Adisesha .ppsx
Data Structure using C by Dr. K Adisesha .ppsxData Structure using C by Dr. K Adisesha .ppsx
Data Structure using C by Dr. K Adisesha .ppsx
Prof. Dr. K. Adisesha
 
Temple of Asclepius in Thrace. Excavation results
Temple of Asclepius in Thrace. Excavation resultsTemple of Asclepius in Thrace. Excavation results
Temple of Asclepius in Thrace. Excavation results
Krassimira Luka
 
skeleton System.pdf (skeleton system wow)
skeleton System.pdf (skeleton system wow)skeleton System.pdf (skeleton system wow)
skeleton System.pdf (skeleton system wow)
Mohammad Al-Dhahabi
 
Chapter wise All Notes of First year Basic Civil Engineering.pptx
Chapter wise All Notes of First year Basic Civil Engineering.pptxChapter wise All Notes of First year Basic Civil Engineering.pptx
Chapter wise All Notes of First year Basic Civil Engineering.pptx
Denish Jangid
 
How Barcodes Can Be Leveraged Within Odoo 17
How Barcodes Can Be Leveraged Within Odoo 17How Barcodes Can Be Leveraged Within Odoo 17
How Barcodes Can Be Leveraged Within Odoo 17
Celine George
 
THE SACRIFICE HOW PRO-PALESTINE PROTESTS STUDENTS ARE SACRIFICING TO CHANGE T...
THE SACRIFICE HOW PRO-PALESTINE PROTESTS STUDENTS ARE SACRIFICING TO CHANGE T...THE SACRIFICE HOW PRO-PALESTINE PROTESTS STUDENTS ARE SACRIFICING TO CHANGE T...
THE SACRIFICE HOW PRO-PALESTINE PROTESTS STUDENTS ARE SACRIFICING TO CHANGE T...
indexPub
 
How to Predict Vendor Bill Product in Odoo 17
How to Predict Vendor Bill Product in Odoo 17How to Predict Vendor Bill Product in Odoo 17
How to Predict Vendor Bill Product in Odoo 17
Celine George
 
RESULTS OF THE EVALUATION QUESTIONNAIRE.pptx
RESULTS OF THE EVALUATION QUESTIONNAIRE.pptxRESULTS OF THE EVALUATION QUESTIONNAIRE.pptx
RESULTS OF THE EVALUATION QUESTIONNAIRE.pptx
zuzanka
 
Geography as a Discipline Chapter 1 __ Class 11 Geography NCERT _ Class Notes...
Geography as a Discipline Chapter 1 __ Class 11 Geography NCERT _ Class Notes...Geography as a Discipline Chapter 1 __ Class 11 Geography NCERT _ Class Notes...
Geography as a Discipline Chapter 1 __ Class 11 Geography NCERT _ Class Notes...
ImMuslim
 
Benner "Expanding Pathways to Publishing Careers"
Benner "Expanding Pathways to Publishing Careers"Benner "Expanding Pathways to Publishing Careers"
Benner "Expanding Pathways to Publishing Careers"
National Information Standards Organization (NISO)
 
How to deliver Powerpoint Presentations.pptx
How to deliver Powerpoint  Presentations.pptxHow to deliver Powerpoint  Presentations.pptx
How to deliver Powerpoint Presentations.pptx
HajraNaeem15
 
The basics of sentences session 7pptx.pptx
The basics of sentences session 7pptx.pptxThe basics of sentences session 7pptx.pptx
The basics of sentences session 7pptx.pptx
heathfieldcps1
 

Recently uploaded (20)

Bossa N’ Roll Records by Ismael Vazquez.
Bossa N’ Roll Records by Ismael Vazquez.Bossa N’ Roll Records by Ismael Vazquez.
Bossa N’ Roll Records by Ismael Vazquez.
 
Oliver Asks for More by Charles Dickens (9)
Oliver Asks for More by Charles Dickens (9)Oliver Asks for More by Charles Dickens (9)
Oliver Asks for More by Charles Dickens (9)
 
HYPERTENSION - SLIDE SHARE PRESENTATION.
HYPERTENSION - SLIDE SHARE PRESENTATION.HYPERTENSION - SLIDE SHARE PRESENTATION.
HYPERTENSION - SLIDE SHARE PRESENTATION.
 
Traditional Musical Instruments of Arunachal Pradesh and Uttar Pradesh - RAYH...
Traditional Musical Instruments of Arunachal Pradesh and Uttar Pradesh - RAYH...Traditional Musical Instruments of Arunachal Pradesh and Uttar Pradesh - RAYH...
Traditional Musical Instruments of Arunachal Pradesh and Uttar Pradesh - RAYH...
 
Jemison, MacLaughlin, and Majumder "Broadening Pathways for Editors and Authors"
Jemison, MacLaughlin, and Majumder "Broadening Pathways for Editors and Authors"Jemison, MacLaughlin, and Majumder "Broadening Pathways for Editors and Authors"
Jemison, MacLaughlin, and Majumder "Broadening Pathways for Editors and Authors"
 
Gender and Mental Health - Counselling and Family Therapy Applications and In...
Gender and Mental Health - Counselling and Family Therapy Applications and In...Gender and Mental Health - Counselling and Family Therapy Applications and In...
Gender and Mental Health - Counselling and Family Therapy Applications and In...
 
NEWSPAPERS - QUESTION 1 - REVISION POWERPOINT.pptx
NEWSPAPERS - QUESTION 1 - REVISION POWERPOINT.pptxNEWSPAPERS - QUESTION 1 - REVISION POWERPOINT.pptx
NEWSPAPERS - QUESTION 1 - REVISION POWERPOINT.pptx
 
Level 3 NCEA - NZ: A Nation In the Making 1872 - 1900 SML.ppt
Level 3 NCEA - NZ: A  Nation In the Making 1872 - 1900 SML.pptLevel 3 NCEA - NZ: A  Nation In the Making 1872 - 1900 SML.ppt
Level 3 NCEA - NZ: A Nation In the Making 1872 - 1900 SML.ppt
 
Data Structure using C by Dr. K Adisesha .ppsx
Data Structure using C by Dr. K Adisesha .ppsxData Structure using C by Dr. K Adisesha .ppsx
Data Structure using C by Dr. K Adisesha .ppsx
 
Temple of Asclepius in Thrace. Excavation results
Temple of Asclepius in Thrace. Excavation resultsTemple of Asclepius in Thrace. Excavation results
Temple of Asclepius in Thrace. Excavation results
 
skeleton System.pdf (skeleton system wow)
skeleton System.pdf (skeleton system wow)skeleton System.pdf (skeleton system wow)
skeleton System.pdf (skeleton system wow)
 
Chapter wise All Notes of First year Basic Civil Engineering.pptx
Chapter wise All Notes of First year Basic Civil Engineering.pptxChapter wise All Notes of First year Basic Civil Engineering.pptx
Chapter wise All Notes of First year Basic Civil Engineering.pptx
 
How Barcodes Can Be Leveraged Within Odoo 17
How Barcodes Can Be Leveraged Within Odoo 17How Barcodes Can Be Leveraged Within Odoo 17
How Barcodes Can Be Leveraged Within Odoo 17
 
THE SACRIFICE HOW PRO-PALESTINE PROTESTS STUDENTS ARE SACRIFICING TO CHANGE T...
THE SACRIFICE HOW PRO-PALESTINE PROTESTS STUDENTS ARE SACRIFICING TO CHANGE T...THE SACRIFICE HOW PRO-PALESTINE PROTESTS STUDENTS ARE SACRIFICING TO CHANGE T...
THE SACRIFICE HOW PRO-PALESTINE PROTESTS STUDENTS ARE SACRIFICING TO CHANGE T...
 
How to Predict Vendor Bill Product in Odoo 17
How to Predict Vendor Bill Product in Odoo 17How to Predict Vendor Bill Product in Odoo 17
How to Predict Vendor Bill Product in Odoo 17
 
RESULTS OF THE EVALUATION QUESTIONNAIRE.pptx
RESULTS OF THE EVALUATION QUESTIONNAIRE.pptxRESULTS OF THE EVALUATION QUESTIONNAIRE.pptx
RESULTS OF THE EVALUATION QUESTIONNAIRE.pptx
 
Geography as a Discipline Chapter 1 __ Class 11 Geography NCERT _ Class Notes...
Geography as a Discipline Chapter 1 __ Class 11 Geography NCERT _ Class Notes...Geography as a Discipline Chapter 1 __ Class 11 Geography NCERT _ Class Notes...
Geography as a Discipline Chapter 1 __ Class 11 Geography NCERT _ Class Notes...
 
Benner "Expanding Pathways to Publishing Careers"
Benner "Expanding Pathways to Publishing Careers"Benner "Expanding Pathways to Publishing Careers"
Benner "Expanding Pathways to Publishing Careers"
 
How to deliver Powerpoint Presentations.pptx
How to deliver Powerpoint  Presentations.pptxHow to deliver Powerpoint  Presentations.pptx
How to deliver Powerpoint Presentations.pptx
 
The basics of sentences session 7pptx.pptx
The basics of sentences session 7pptx.pptxThe basics of sentences session 7pptx.pptx
The basics of sentences session 7pptx.pptx
 

2 way ANOVA(Analysis Of VAriance

  • 1. www.stat.ufl.edu/~ssaha/3024.html Ch 13 – Two Way ANOVA CHAPTER 13 – TWO-WAY ANALYSIS OF VARIANCE Two-way ANOVA has many of the same ideas as one-way ANOVA, with the main difference being the inclusion of another factor (or explanatory variable) in our model. In the two-way ANOVA model, there are two factors, each with its own number of levels. When we are interested in the effects of two factors, it is much more advantageous to perform a two-way analysis of variance, as opposed to two separate one-way ANOVAs. There are three main advantages of two-way ANOVA: - It is more efficient to study two factors simultaneously rather than separately. - We can reduce the residual variation in a model by including a second factor thought to influence the response. - We can investigate interactions between factors. The interaction between two variables is usually the most interesting feature of a two-way analysis of variance. When two factors interact, the effect on the response variable of one explanatory variable depends on the specific value or level of the other explanatory variable. For example, the statement “being overweight caused greater increases in blood pressure for men than for women” is a statement describing interaction. The effect of weight (factor #1, categorical – overweight or not overweight) on blood pressure (response) depends on gender (factor #2, categorical – male or female). The term main effect is used to describe the overall effect of a single explanatory variable. For our previous example, there would be two main effects: the effect of weight on blood pressure and the effect of gender on blood pressure. 1
  • 2. www.stat.ufl.edu/~ssaha/3024.html Ch 13 – Two Way ANOVA The presence of a main effect might not necessarily be useful when an interaction effect exists. For example, it might be sensible to report the effect of being overweight on blood pressure without reporting that there is a difference in the effect of being overweight on blood pressure for men and women. There are many types of interactions which can often be seen from patterns in graphs. We will study some types in the following examples. Example #1(a) The Bureau of Labor Statistics collects data on earnings of workers in the US classified according to various characteristics. Here are the mean weekly earnings in dollars of men and women in two age groups who were working full-time in the first quarter of 1997: Age Women Men Mean 16-19 20-24 239 302 264 333 251.5 317.5 Mean 270.5 298.5 284.5 Figure 13.1 is a plot of the group means. It clearly shows an existence of main effects. From the plot we can see that on average men earn more than women indicating an effect of gender. We can also see an effect of age since the older groups makes on average more than the younger age group. What about the interaction between gender and age? An interaction is present when the main effects cannot provide a complete description of the data. Figure 13.1 2
  • 3. www.stat.ufl.edu/~ssaha/3024.html Ch 13 – Two Way ANOVA In our graph, the only two effects that are present are an effect due to age and an effect due to gender. We know that men make, on average, more than women, but there is no dependence on age to determine the amount that men make more than women. Therefore, since there is no dependence between gender and age, there is no interaction effect. Parallel lines in our plot usually imply little or no interaction. Example #1 (b) The survey described in 1(a) also gave weekly earnings for groups of older workers. Here is the complete table: Figure 13.2 Age Women Men Mean 16-19 20-24 25-34 35-44 45-54 55-64 239 302 422 475 496 426 264 333 514 639 692 660 251.5 317.5 468.0 557.0 594.0 543.0 Mean 393 517 455.0 Figure 13.2 is a plot of the group means. It demonstrates both main effects and an interaction between gender and age. In this case, the main effects do not provide a complete description of the data since now the gender difference in earnings depends on which age group we examine. As the age of the workers increases, the earnings increase (except in the last age group). We also see a main effect of gender on earnings. However, our interaction shows that the amount by which the men earn over the women depends on the age group. Therefore, there is a very strong interaction present and our main effects don’t provide us with enough information to get an accurate idea of the relationship between age and earnings as well as gender and earnings. 3
  • 4. www.stat.ufl.edu/~ssaha/3024.html Ch 13 – Two Way ANOVA Example #2 A study of the energy expenditure of farmers in Burkina Faso collected data during the wet and dry seasons. The farmers grow millet during the wet season. In the dry season there is very little activity because the ground is too hard to grow crops. The mean energy expended (in calories) by men and women in Burkina Faso during the wet and dry seasons is given in the following table: Season Men Women Mean Dry Wet 2310 3460 2320 2890 2315 3175 Mean 2885 2605 2745 During the dry season both men and women use about the same amount of energy. However, during the wet season, both genders burn more calories. Therefore, there is an effect of season on the number of calories burned. During the wet season, since it is the custom for men to do most of the field work, they use more energy on average than women. Therefore, there is an effect of gender on the number of calories burned, but only in the wet season. So there is an interaction between gender and season, as well as main effects of both factors. Figure 13.3 4
  • 5. www.stat.ufl.edu/~ssaha/3024.html Ch 13 – Two Way ANOVA THE TWO-WAY ANOVA MODEL When discussing two-way ANOVA models, we will use the labels A and B to represent our two factors. In examples, we will use the factor names so that we can easily see the meaning of each variable. We use I to represent the number of levels of factor A and J to represent the number of levels of factor B. Therefore, we call the general two-way problem an I x J ANOVA, since every level of A is combined with every level of B, so that I x J groups are compared. The sample size for level i of factor A and level j of factor B is nij. The total number of observations is N = Σ nij. Example #3 A company wants to compare three different training programs for its new employees. Each of these programs takes 8 hours to complete. The training can be given for 8 hours on one day or for 4 hours on two consecutive days. The next 120 employees that the company hires will be the subjects for this study. After the training is completed, the employees are asked to evaluate the effectiveness of the program on a 7-point scale. Identify the response and explanatory variables, state the number of levels for each factor (I and J) and the total number of observations (N). 5
  • 6. www.stat.ufl.edu/~ssaha/3024.html Ch 13 – Two Way ANOVA Solution: Explanatory variables: 1) Training program (I = 3 levels) 2) The manner in which the employee does the training (J = 2 levels: 8 hrs f or one day, 4 hrs on two consecutive days). Response variable: the 7-point scaled effectiveness score Total number of observations N = 120 _____________________________________________________________ For our two-way ANOVA, we assume to have independent SRSs of size nij from each of I x J normal populations. The population means µij may differ, but all populations must have the same standard deviation σ. Let xijk be the kth observation from the population having factor A at level i and factor B at level j. Since our observations differ from their mean by a value of εijk (xijk – µij = εijk), we can write our two-way ANOVA model in the form: xijk = µij + εijk. In this case, i = 1,2, …, I, j = 1,2,…, J, k = 1,2,…,nij and the deviations εijk are normally distributed with mean 0 and standard deviation σ. As in the previous chapters, we can describe our model by DATA = FIT + RESIDUAL. In this case, the fit part of our model is the means µij, (since we use each mean to describe each population) and the residual part is the deviations εijk of the individual observations from their group means. Our population means µij and the population standard deviations are all unknown. Therefore, we pick simple random samples (SRSs) to learn about the relationship between our factors and the response in our samples and then use that to estimate the relationship in our population. 6
  • 7. www.stat.ufl.edu/~ssaha/3024.html Ch 13 – Two Way ANOVA PARAMETER ESTIMATES The population mean for the group with level i of factor A and level j of factor B is represented by µij. It can be estimated by 1 1 ijn ij ijk ij k x x n = = ∑ . Since every σ (population standard deviation) is assumed to be the same in two-way ANOVA, we can pool all of our estimates (sample standard deviations) to give one estimate of the population standard deviation. 2 2 ( 1) ( 1) ij ij p ij n s s n − = − ∑ ∑ and 2 p ps s= Just like in one-way ANOVA, sp 2 = MSE, and so the numerator of sp 2 is equal to SSE and the denominator is equal to DFE (since we have ( 1ijn )−∑ = N - IJ, so we have N observations being compared to IJ sample means). 7
  • 8. www.stat.ufl.edu/~ssaha/3024.html Ch 13 – Two Way ANOVA Example #4 Students in a statistics class gave information on their height and weight and also reported their perception of their weight (about right, underweight, overweight). The body mass index, BMI, was calculated for each combination of student gender and perception of weight category (BMI = Weight/Height). Calculate each sample mean based on the data. Perception of Weight Underweight About Right Overweight Female 20.2 20.6 18.1 21.4 22.5 23.1 20.9 24.5 26.0 22.7 24.6 Male 23.8 20.5 23.4 26.5 22.2 24.0 28.1 26.4 27.7 Solution: Let factor A be the perception of weight and let factor B be gender. Within factor A, let level 1 be underweight, level 2 be about right, and level 3 be overweight. Within factor B (gender), let level 1 be female and let level 2 be male. So µ11 corresponds to the population mean BMI of underweight females, µ12 corresponds to the population mean BMI of underweight males, and so on. So to estimate these population values, we use xij(bar) to estimate µij for i=1,2,3 and j=1,2. Now, x11(bar) = (20.2 + 20.6 + 18.1 + 21.4) / 4 = 20.075 x12(bar) = (23.8 + 20.5) / 2 = 22.15 x21(bar) = (22.5 + 23.1 + 20.9) / 3 = 21.167 x22(bar) = (23.4 + 26.5 + 22.2 + 24.0) / 4 = 24.025 x31(bar) = (24.5 + 26 + 22.7 + 24.6) / 4 = 24.45 x32(bar) = (28.1 + 26.4 + 27.7) / 3 = 27.4 Note: (bar) just means that the x has a bar over it (indicating a mean). 8
  • 9. www.stat.ufl.edu/~ssaha/3024.html Ch 13 – Two Way ANOVA TWO-WAY ANOVA TABLE In two-way ANOVA, there are three F statistics that are calculated and used in significance tests: two that test for the main effects and one that tests for an interaction. Therefore, the sum of squares for our FIT (SSM) is made up of three parts: SSA - sum of squares for factor A SSB - sum of squares for factor B SSAB - sum of squares for the interaction between factor A and factor B Our total sum of squares and total degrees of freedom are still the sum of the sources of variation and degrees of freedom in our model. SST = SSA + SSB + SSAB + SSE DFT = DFA + DFB + DFAB + DFE When our sample sizes are different, do not be alarmed if our sums of squares do not add up to our given SST. When our sample sizes are different, this can cause sums of squares which don’t add. Since we have I levels of factor A, DFA = I – 1. Since we have J levels of factor B, DFB = J – 1. Since SSM = SSA + SSB + SSAB and DFM = IJ – 1, DFAB = (IJ – 1) – (I – 1) – (J – 1) = (I – 1)( J – 1). DFE = N – IJ (we have N observations and IJ sample means) DFT = N – 1 9
  • 10. www.stat.ufl.edu/~ssaha/3024.html Ch 13 – Two Way ANOVA TWO-WAY ANOVA TABLE Source Degrees of Freedom Sums of Squares Mean Square F A I – 1 SSA SSA/DFA MSA/MSE B J – 1 SSB SSB/DFB MSB/MSE AB (I – 1)(J – 1) SSAB SSAB/DFAB MSAB/MSE Error N – IJ SSE SSE/DFE Total N - 1 SST Remember that when we do a two-way ANOVA, we need to assume that our data is normally distributed and that the population standard deviations are equal. Therefore, we must make sure that twice our smallest sample standard deviation is larger than our largest standard deviation. 10
  • 11. www.stat.ufl.edu/~ssaha/3024.html Ch 13 – Two Way ANOVA HYPOTHESES FOR TWO-WAY ANOVA To test the main effect of A: H0: No main effect of A Ha: There exists a main effect of factor A F = MSA Compare to F(I-1, N-IJ) MSE To test the main effect of B: H0: No main effect of B Ha: There exists a main effect of factor B F = MSB Compare to F(J-1, N-IJ) MSE To test the interaction of A and B: H0: No interaction Ha: There exists an interaction between factor A and factor B F = MSAB Compare to F((I-1)(J-1), N-IJ) MSE 11
  • 12. www.stat.ufl.edu/~ssaha/3024.html Ch 13 – Two Way ANOVA Example #5 When a restaurant server writes a friendly note or draws a “happy face” on your restaurant check, is this just a friendly act or is there a financial incentive? Psychologists conducted a randomized experiment to investigate whether drawing a happy face on the back of a restaurant bill increased the average tip given to the server. One female server and one male server in a Philadelphia restaurant either did or did not draw a happy face on checks during the experiment. In all they drew happy faces on 45 checks and did not draw happy faces on 44 checks. The sequence of drawing the happy faces or not was random. a) Identify the response and explanatory variables, state the number of levels for each factor (I and J) and the total number of observations (N). Solution: Response variable: tip Explanatory variables: gender of server (2 levels), message (2 levels, yes or no) Total number of observations: N = 89 b) Complete the following two-way ANOVA table and then perform the appropriate F tests for main effects and interaction and state your conclusions. Try to fill the table in on your own (answer is below): Source DF SS MS F Message 14.7 Gender 2602.0 Interaction 438.7 Error 109.8 Total 12407.9 12
  • 13. www.stat.ufl.edu/~ssaha/3024.html Ch 13 – Two Way ANOVA Solution: Source DF SS MS F Message 1 14.7 14.7 0.134 Gender 1 2602.0 2602.0 23.7 Interaction 1 438.7 438.7 4.0 Error 85 9333.0 109.8 Total 88 12407.9 --- H0: No main effect of message Ha: A main effect of message exists Test Statistic: F0 = 14.7/109.8 = 0.134 with numerator degrees of freedom 1 and denominator degrees of freedom 85. Decision Rule: This test statistic corresponds to a p-value of 0.7152. We do not have any evidence to reject the null hypothesis that there is main effect of message on the average amount a server gets tipped. _____________________________________________________________ H0: No main effect of gender Ha: A main effect of gender exists Test Statistic: F0 = 2602/109.8 = 23.7 with numerator df = 1 and denominator df = 85. Decision Rule: This test statistic corresponds to a p-value of less than .0001. We have very strong evidence that a main effect of gender does exist. _____________________________________________________________ H0: No interaction effect between gender and message Ha: An interaction effect between gender and message exists. Test Statistic: F0 = 438.7/109.8 = 4.0 with numerator df = 1 and denominator df = 85. Decision Rule: This test statistic corresponds to a p-value of .0487. We have evidence to reject the null hypothesis of no interaction at the α = 0.05 level. We have reason to believe that there is an interaction effect. _____________________________________________________________ 13