Download to read offline

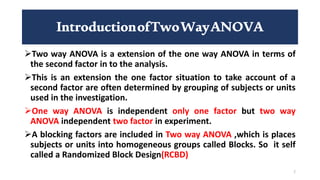


The document discusses the methodology and calculations involved in two-way ANOVA, which extends one-way ANOVA by incorporating a second factor in experimental analysis. It presents a case study involving a farmer applying different fertilizers on crop yield, outlining how to calculate degrees of freedom, sum of squares, and F-ratios. The results indicate that neither factor led to a significant difference at a 5% significance level, meaning the null hypotheses were not rejected.