
Recommended
More Related Content
What's hot
What's hot (20)
Similar to Aaj ka trend 21.10.16
Similar to Aaj ka trend 21.10.16 (19)
Recently uploaded
Recently uploaded (20)
Aaj ka trend 21.10.16
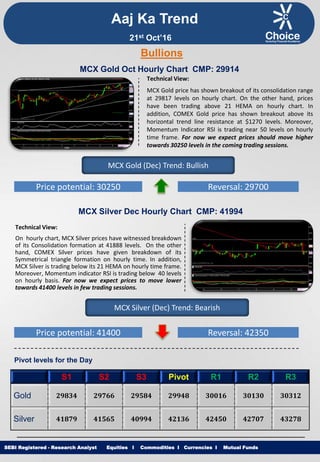
- 1. Equities I Commodities I Currencies I Mutual Funds Aaj Ka Trend Technical View: MCX Gold price has shown breakout of its consolidation range at 29817 levels on hourly chart. On the other hand, prices have been trading above 21 HEMA on hourly chart. In addition, COMEX Gold price has shown breakout above its horizontal trend line resistance at $1270 levels. Moreover, Momentum Indicator RSI is trading near 50 levels on hourly time frame. For now we expect prices should move higher towards 30250 levels in the coming trading sessions. SEBI Registered - Research Analyst Equities I Commodities I Currencies I Mutual Funds Bullions MCX Gold Oct Hourly Chart CMP: 29914 MCX Gold (Dec) Trend: Bullish Price potential: 30250 Reversal: 29700 MCX Silver Dec Hourly Chart CMP: 41994 Technical View: On hourly chart, MCX Silver prices have witnessed breakdown of its Consolidation formation at 41888 levels. On the other hand, COMEX Silver prices have given breakdown of its Symmetrical triangle formation on hourly time. In addition, MCX Silver is trading below its 21 HEMA on hourly time frame. Moreover, Momentum indicator RSI is trading below 40 levels on hourly basis. For now we expect prices to move lower towards 41400 levels in few trading sessions. MCX Silver (Dec) Trend: Bearish Price potential: 41400 Reversal: 42350 Pivot levels for the Day S1 S2 S3 Pivot R1 R2 R3 Gold 29834 29766 29584 29948 30016 30130 30312 Silver 41879 41565 40994 42136 42450 42707 43278 21st Oct’16
- 2. Equities I Commodities I Currencies I Mutual Funds Technical View: On hourly chart MCX Copper has given breakdown of its Rectangle pattern at 312.60 levels & is trading below its trend line resistance. In addition, prices have been trading below its 50 DEMA, which suggest medium term remains weak. Furthermore, Three Black Crow bearish candlestick pattern is visible on daily time frame. Moreover, momentum indicator RSI has been trading below 50 levels on hourly time frame. For now we expect prices to move lower towards 305 levels in coming trading sessions. SEBI Registered - Research Analyst Equities I Commodities I Currencies I Mutual Funds MCX Copper Nov hourly Chart CMP: 311.55 MCX Copper (Nov) Trend: Bearish Price potential: 305 Reversal: 316.50 MCX Crude Oil Oct. Hourly Chart CMP: 3396 Technical View: MCX Crude Oil prices after witnessing breakout of its Symmetrical triangle formation at 3386 levels has retested its trend line support on hourly chart. In addition, Counter is trading above its 50 HEMA on hourly chart. Moreover, Momentum indicator RSI is trading above 50 levels on hourly chart. Furthermore, momentum indicator MACD is trading above its signal line on hourly chart. For now we expect prices to move higher towards 3485 levels in coming trading sessions. MCX Crude Oil (Oct) Trend: Bullish Price potential: 3485 Reversal: 3360 Pivot levels for the Day S1 S2 S3 Pivot R1 R2 R3 Copper 310.3 308.6 305.3 311.8 313.6 315.1 318.3 Crude 3424 3375 3307 3443 3492 3511 3579 Base Metal Energy Aaj Ka Trend 21st Oct’16
- 3. Equities I Commodities I Currencies I Mutual FundsSEBI Registered - Research Analyst Equities I Commodities I Currencies I Mutual Funds Other Base Metals & Energy S1 S2 S3 Pivot R1 R2 R3 Trend Copper 310.3 308.6 305.3 311.8 313.6 315.1 318.3 Aluminum 109.8 108.5 106.3 110.7 112.0 112.9 115.1 Lead 131.8 130.7 128.6 132.8 133.9 134.9 137.0 Nickel 677.9 669.9 656.9 682.9 690.9 695.9 708.9 Zinc 149.3 148.1 146.0 150.3 151.5 152.4 154.6 Natural Gas 234.7 217.7 211.1 224.3 241.3 230.9 237.5 Fundamental News: Gold drifted higher on Thursday in Asia in cautious trade as investors looked ahead to the final of three U.S. presidential debates that may throw up some insights on economic policy plans by contenders Donald Trump and Hillary Clinton. Gold prices eased on Thursday, but remained supported near two-week highs as speculation over the future path of U.S. monetary policy continued. Gold prices were trading close to two-week highs on Thursday after the European Central Bank indicated that it would wait until December to discuss tapering its asset purchase program, or the possible horizon at which stimulus might end. Crude oil prices eased in Asia on Thursday with investors taking profits following drops in U.S. inventories with the focus now on end of the week U.S. rig count data. Oil prices fell on Thursday as traders locked in profits following a rally in the previous session when the U.S. Energy Information Administration reported an unexpectedly large U.S. oil inventory drawdown last week. Oil was lower Thursday on profit-taking after a big drawdown in U.S. crude stocks. Oil prices fell on Thursday on profit-taking, after markets rallied the previous day on another unseasonal draw in U.S. crude oil stocks helping bullish sentiment from an expectation of an OPEC-led cut in production. Oil prices fell on Thursday as traders took profits following a rally in the previous session fueled by an unexpectedly large U.S. oil inventory drawdown last week and hopes for an output cut by major producers. Aaj Ka Trend 21st Oct’16
- 4. Equities I Commodities I Currencies I Mutual FundsSEBI Registered - Research Analyst Equities I Commodities I Currencies I Mutual Funds International Market Commodity Closing Price Gold 1263.5 Silver 17.43 Crude Oil 50.39 Brent Crude Oil 51.17 Natural Gas 3.10 COMEX/NYMEX/ICE ( Precious Metals & Energy) Currency & Commodity Index Currency (Spot) Current Price USD / INR 66.88 Dollar Index 98.50 EUR / USD 1.09 CRB Index* 188.70 Closing as on 20.10.16 *Closing as on 20.10.16 LME (Base Metals) ( $ per tones) Commodity Closing Price Copper 4632 Aluminum 1623 Zinc 2281 Lead 2011 Nickel 10081 SHFE (Base Metals) (Yuan per tones) Commodity Closing Price Copper 37060 Aluminum 12520 Zinc 17680 Lead 15220 Closing as on 20.10.16 Closing as on 20.10.16 LME INVENTORY DATA Aaj Ka Trend 14-Oct-16 17-Oct-16 18-Oct-16 19-Oct-16 20-Oct-16 Aluminium -10000 -6226 2548 24751 36802 Copper 2925 -3274 2201 2621 -2049 Lead 0 -151 601 601 -677 Nickel 612 1768 -1195 -8 1549 Zinc -375 -248 102 -277 -374 21st Oct’16
- 5. Equities I Commodities I Currencies I Mutual Funds This is solely for information of clients of Choice Broking and does not construe to be an investment advice. It is also not intended as an offer or solicitation for the purchase and sale of any financial instruments. Any action taken by you on the basis of the information contained herein is your responsibility alone and Choice Broking its subsidiaries or its employees or associates will not be liable in any manner for the consequences of such action taken by you. We have exercised due diligence in checking the correctness and authenticity of the information contained in this recommendation, but Choice Broking or any of its subsidiaries or associates or employees shall not be in any way responsible for any loss or damage that may arise to any person from any inadvertent error in the information contained in this recommendation or any action taken on basis of this information. Technical analysis studies market psychology, price patterns and volume levels. It is used to forecast future price and market movements. Technical analysis is complementary to fundamental analysis and news sources. The recommendations issued herewith might be contrary to recommendations issued by Choice Broking in the company research undertaken as the recommendations stated in this report is derived purely from technical analysis. Choice Broking has based this document on information obtained from sources it believes to be reliable but which it has not independently verified; Choice Broking makes no guarantee, representation or warranty and accepts no responsibility or liability as to its accuracy or completeness. The opinions contained within the report are based upon publicly available information at the time of publication and are subject to change without notice. The information and any disclosures provided herein are in summary form and have been prepared for informational purposes. The recommendations and suggested price levels are intended purely for trading purposes. The recommendations are valid for the day of the report however trading trends and volumes might vary substantially on an intraday basis and the recommendations may be subject to change. The information and any disclosures provided herein may be considered confidential. Any use, distribution, modification, copying, forwarding or disclosure by any person is strictly prohibited. The information and any disclosures provided herein do not constitute a solicitation or offer to purchase or sell any security or other financial product or instrument. The current performance may be unaudited. Past performance does not guarantee future returns. There can be no assurance that investments will achieve any targeted rates of return, and there is no guarantee against the loss of your entire investment. POTENTIAL CONFLICT OF INTEREST DISCLOSURE (as on date of report) Disclosure of interest statement – • Analyst interest of the stock /Instrument(s): - No. • Firm interest of the stock / Instrument (s): - No. Disclaimer Contact Us Amit Pathania Research Associate amit.pathania@choiceindia.com Rohan Patil Research Associate rohan.patil@choiceindia.com www.choicebroking.incustomercare@choiceindia.com SEBI Registered - Research Analyst Equities I Commodities I Currencies I Mutual Funds Aaj Ka Trend 21st Oct’16 Neeraj Yadav Research Advisor neeraj.yadav@choiceindia.com Anish Vyas Senior Research Associate anish.vyas@choiceindia.com Amit Pathania Digitally signed by Amit Pathania DN: cn=Amit Pathania, o=Choice Equity Broking Pvt. ltd, ou=Research Department, email=amit.pathania@choiceindia.com, c=IN Date: 2016.10.21 08:27:31 +05'30'