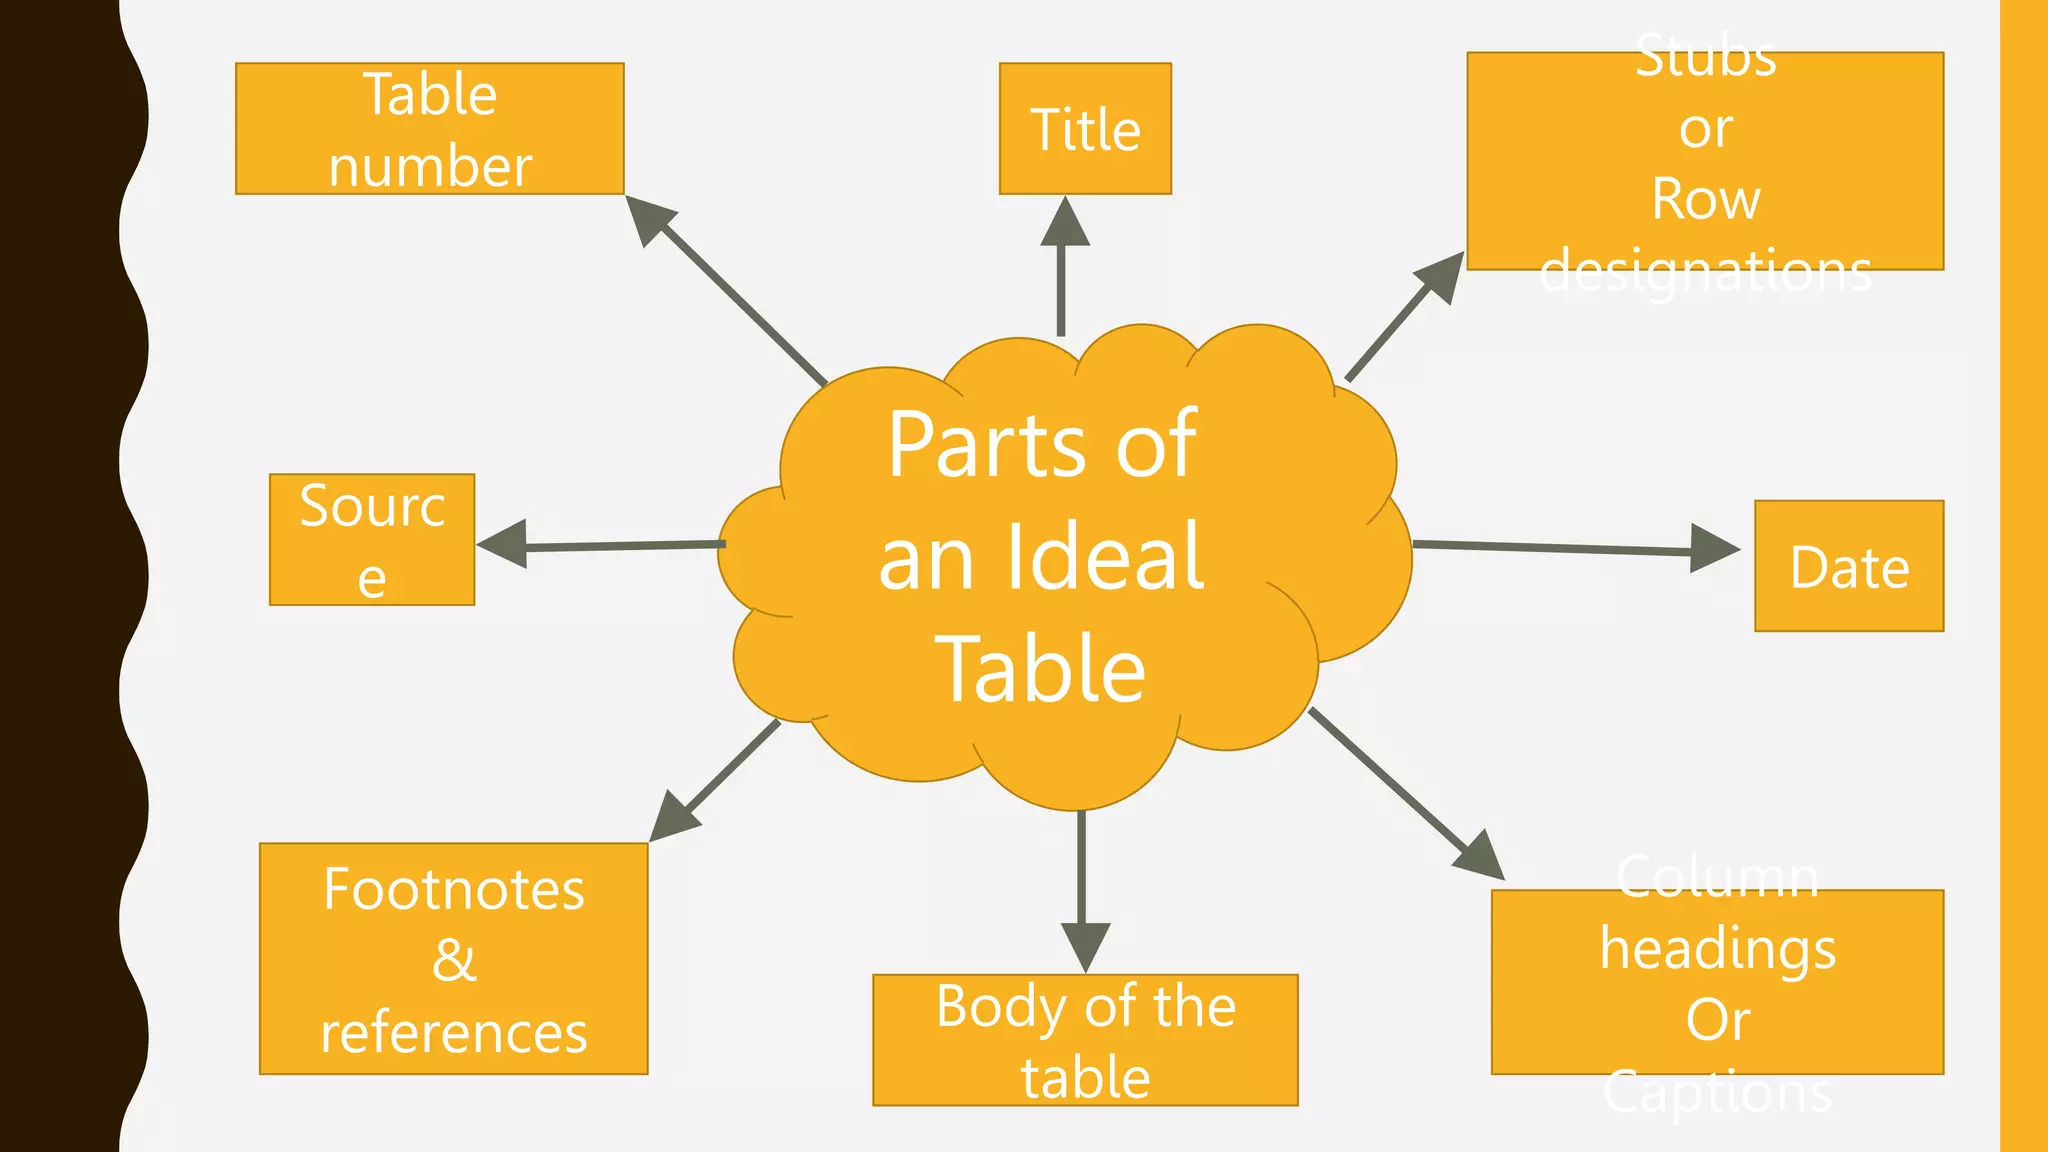
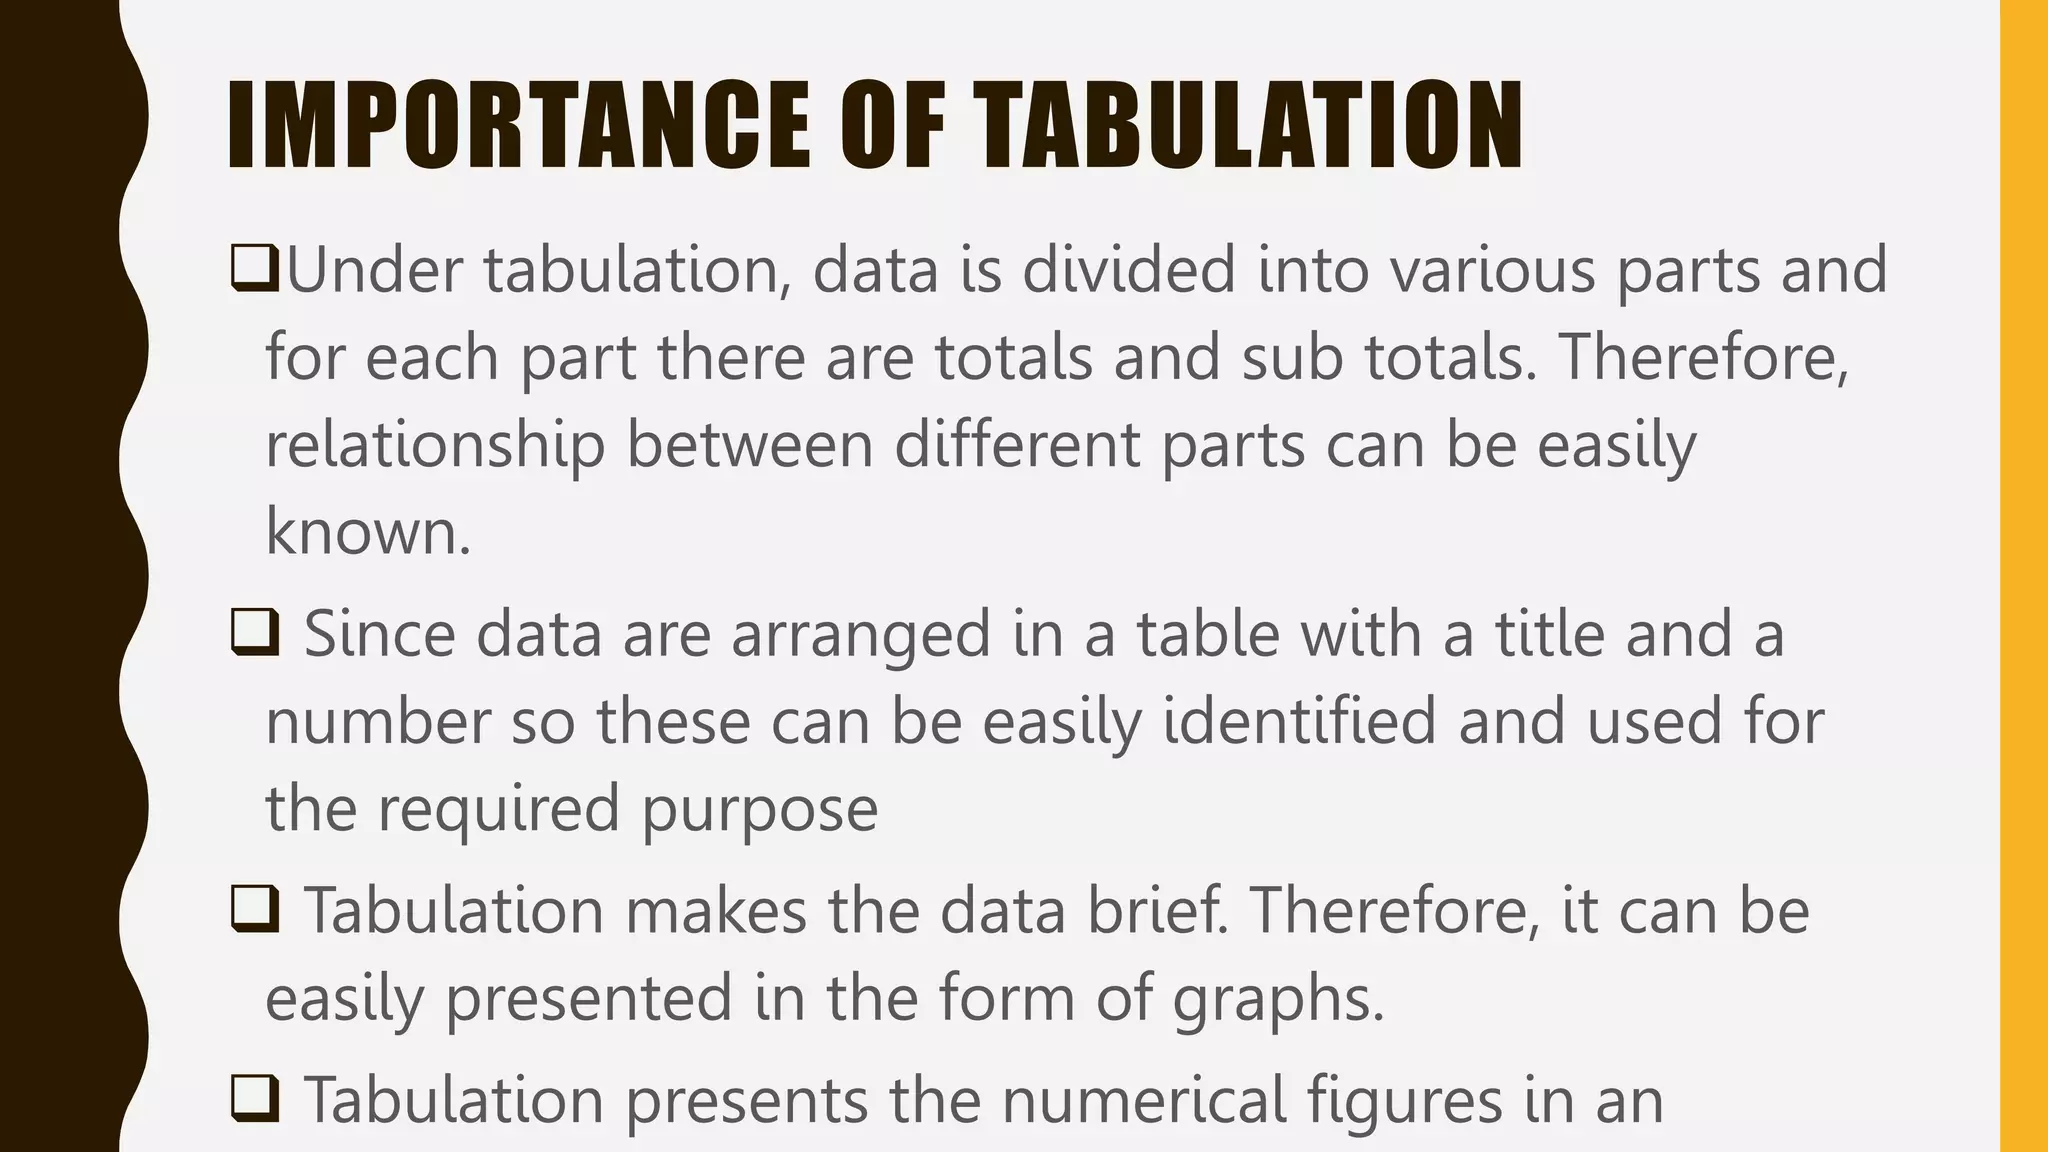
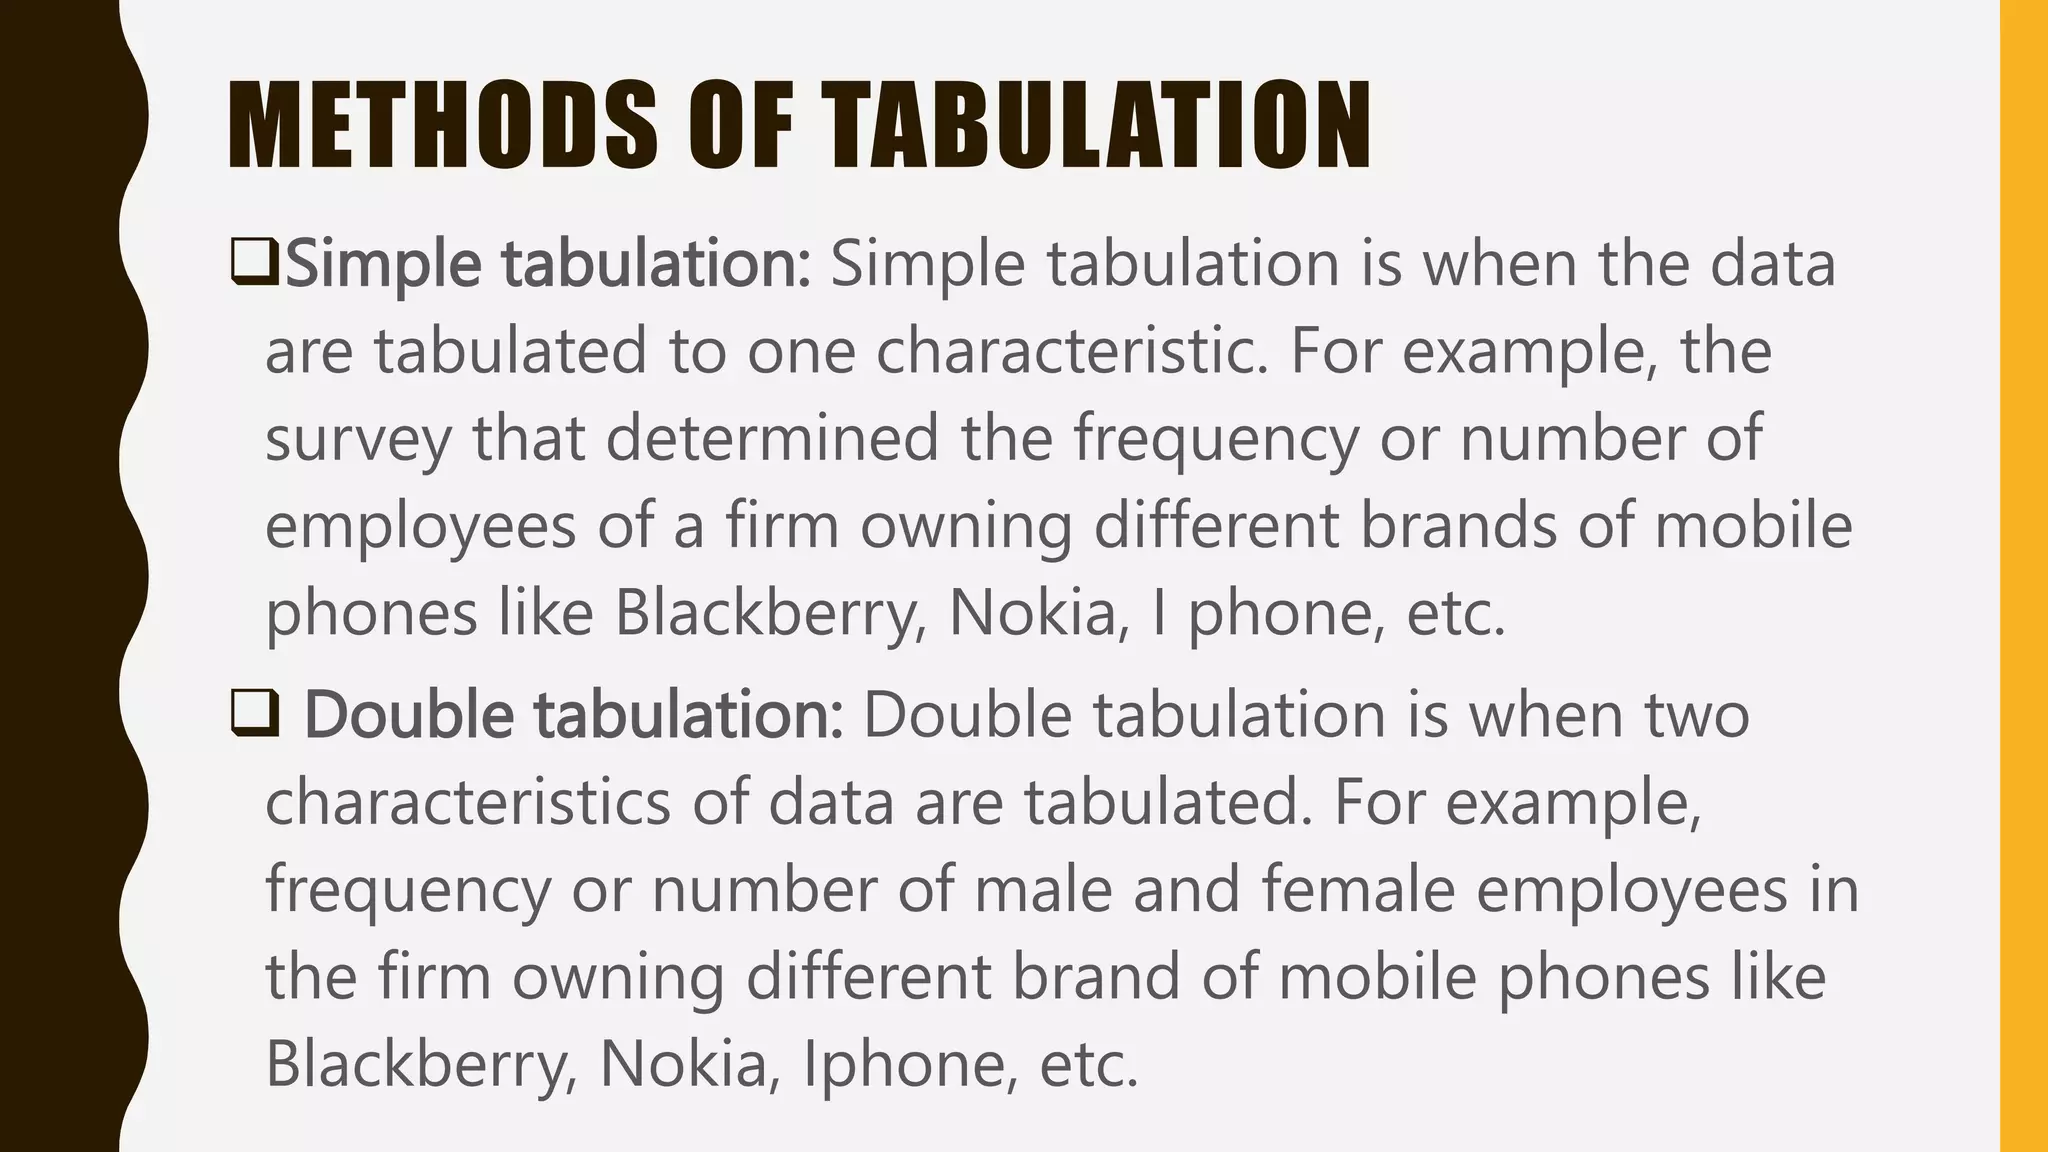
SlideShare a Scribd company logo
ORGANIZATION AND
PRESENTATION OF
DATA
INTRODUCTION
The classification of data leads to the problem of
presentation of data. The presentation of data means exhibition
of the data in such a clear and attractive manner that these are
easily understood and analyzed. There many forms of
presentation of data of which the following three are well
known:
(i). Textual Presentation,
(ii). Tabular Presentation,
(iii). Diagrammatic Presentation.
Here, we discuses in detail Tabular method of data
WHAT IS A TABLE:
A table is a symmetric arrangement of statistical data
in rows and columns.
A table presents data in a concise, systematic manner
from masses of statistical data. Tabulation is the first
step before data is used for further statistical analysis
and interpretation.
DEFINITIONS
“Table involves the orderly and systematic presentation
of numerical data in a form designed to elucidate the
problem under consideration.”
---According Prof.
L.R.Connor,”
“Table in its broadest sense is an orderly arrangement
of data in column and rows. “
---According to Prof. M.M.
MEANING
In the light of above mentioned definitions
we can say in brief, “Table is systematic
organization and presentation of data in the
form of rows and columns. Whereas rows are
horizontal arrangements and columns are
vertical arrangements.
OBJECTIVES OF DATA TABULATION
To carry out investigations
 To do comparisons
 To locate omissions and errors in the data
 To use space economically
 To study the trends
 To simplify data
 To use it as future references
RULES OF TABULATION
There are no hard and fast rules for the tabulation of data but for
constructing good table, following general rules should be observed
while tabulating statistical data.
The table should suit the size of the paper and, therefore, the width of
the column should be decided before hand.
 Number of columns and rows should neither be too large nor too
small.
 As far as possible figures should be approximated before tabulation.
This would reduce unnecessary details.
 Items should be arranged either in alphabetical, chronological or
geographical order or according to size.
The sub-total and total of the items of the table must be
written.
 Percentages are given in the tables if necessary.
 Ditto marks should not be used in a table because
sometimes it create confusion.
 Table should be simple and attractive.
 A table should be logical, well-balanced in length and
breadth and the comparable columns should be placed side
by side.
 Light/heavy/thick or double rulings may be used to
distinguish sub columns, main columns and totals.
 For large data more than one table may be used.
FEATURES OF A GOOD TABLE
Title as compatible with the objective of the study
 To facilitate comparison.
 Ideal Size
 Heading
Abbreviation
 Footnote
 Total
 Source of data
 Size of Columns
 Simple, Economical and Attractive
Parts of
an Ideal
Table
Title
Stubs
or
Row
designations
Date
Column
headings
Or
Captions
Body of the
table
Footnotes
&
references
Sourc
e
Table
number
PARTS OF AN IDEAL TABLE
Table number: A number must be allotted to the
table for identification, particularly when there are
many tables in a study.
Title: The title should explain what is contained in the
table. It should be clear, brief and set in bold type on
top of the table. It should also indicate the time and
place to which the data refer.
Date: The date of preparation of the table should be
given.
 Stubs or Row designations: Each row of the table
should be given a brief heading. Such designations of
rows are called “stubs”, or, “stub items” and the entire
column is called “stub column”.
 Column headings or Captions: Column designation is
designation is given on top of each column to explain
to what the figures in the column refer. It should be
clear and precise. This is called a “caption”, or,
“heading”. columns should be numbered if there are
Body of the table: The data should be arranged in
such a way that any figure can be located easily.
Various types of numerical variables should be
arranged in an ascending order, i.e., from left to right
in rows and from top to bottom in columns. Column
and row totals should be given.
Source: At the bottom of the table a note should be
added indicating the primary and secondary sources
from which data have been collected.
 Footnotes and references: If any item has not been
explained properly, a separate explanatory note
should be added at the bottom of the table.
IMPORTANCE OF TABULATION
Under tabulation, data is divided into various parts and
for each part there are totals and sub totals. Therefore,
relationship between different parts can be easily
known.
 Since data are arranged in a table with a title and a
number so these can be easily identified and used for
the required purpose
 Tabulation makes the data brief. Therefore, it can be
easily presented in the form of graphs.
 Tabulation presents the numerical figures in an
Tabulation makes complex data simple and as a result
of this, it becomes easy to understand the data.
This form of the presentation of data is helpful in
finding mistakes.
 Tabulation is useful in condensing the collected data.
 Tabulation makes it easy to analyze the data from
tables.
 Tabulation is a very cheap mode to present the data. It
saves time as well as space.
 Tabulation is a device to summaries the large scattered
data. So, the maximum information may be collected
METHODS OF TABULATION
Simple tabulation: Simple tabulation is when the data
are tabulated to one characteristic. For example, the
survey that determined the frequency or number of
employees of a firm owning different brands of mobile
phones like Blackberry, Nokia, I phone, etc.
 Double tabulation: Double tabulation is when two
characteristics of data are tabulated. For example,
frequency or number of male and female employees in
the firm owning different brand of mobile phones like
Blackberry, Nokia, Iphone, etc.
Complex tabulation: Complex tabulation of data that
includes more than two characteristics. For example,
frequency or number of male, female and the total
employees owning different brand of mobile phones
like Blackberry, Nokia, I phone, etc. Cross tabulations,
is also a sub-type of complex tabulation that includes
cross-classifying factors to build a contingency table
of counts or frequencies at each combination of factor
levels. A contingency table is a display format used to
analyze and record the possible relationship between
two or more categorical variables
TYPES OF TABLES
There are three basis of classifying tables.
I. Purpose of a table
II. Originality of a table
III. Construction of a table.
Kinds of Tables
General
Purpose
Table
According
to
Constructio
n
According
to
Originality
Accordin
g to
Purpose
Drived
table
Original
table
Specific
Purpose
Table
Complex
table
Simple
or one
way
table
Manifold
table
Treble
table
Double
or two
way
table
I. ACCORDING TO PURPOSE
General Purpose Table: General purpose table is that
table which is of general use. It is does not serve any
specific purpose or specific problem under
consideration.
 Special Purpose Table: Special Purpose table is that
table which is prepared with some specific purpose in
mind.
II. ACCORDING TO ORIGINALITY
Original Table: An original table is that in which data
are presented in the same form and manner in which
they are collected.
 Derived Table: A derived table is that in which data
are not presented in the form or manner in which
these are collected. Instead the data are first
converted into ratios or percentage and then
presented.
III. ACCORDING TO CONSTRUCTION
Simple Table
Complex Tables
 Double or Two-Way Table
Three-Way Table
Manifold (or Higher Order) Table
SIMPLE TABLE
• In a simple table (also known as one-way table), data
are presented based on only one characteristic. Table
1.1 illustrates the concept.
Faculties Number of Users
Science 50
Commerce 70
Arts 90
Total 210
Table 1.1 Faculty-wise Library Users
COMPLEX TABLES
In a complex table (also known as a manifold
table) data are presented according to two or more
characteristics simultaneously. The complex tables are
two-way or three-way tables according to whether two
or three characteristics are presented simultaneously.
Double or Two-Way Table
Three-Way Table
Manifold (or Higher Order) Table
DOUBLE OR TWO-WAY TABLE
• In such a table, the variable under study is further
subdivided into two groups according to two inter-
related characteristics. The two-way table is shown in
Table 1.2.
Faculties Numbers of User Total
Girls Girls
science 20 30 50
Commerce 30 40 70
Arts 35 55 90
total 85 125 210
Table 1.2 Faculty-wise Library Users
THREE-WAY TABLE
• In such a table, the variable under study is divided
according to three interrelated characteristics.
Faculties Number of users Total
(1)+(2)
Girls Boys
I Sem II Sem Total (1) I Sem II Sem Total (2)
Science 15 20 35 20 30 50 85
Commerc
e
35 30 65 45 40 85 150
Art 25 35 60 35 55 90 150
Total 75 85 160 100 125 225 385
Table 1.3 Faculty-wise Library Users
MANIFOLD (OR HIGHER ORDER) TABLE
• Such tables provide information about a large no of
interrelated characteristics in the data set.
Faculties Number of users Total
(1)+(2)
Girls Boys
I
Sem
II
Se
m
I
Sem
II
Sem
Total (1) I
Sem
II
Sem
I
Se
m
II
Sem
Total (2)
Science 15 34 20 54 123 20 45 30 27 122 245
Commerce 35 23 30 122 122 45 37 40 29 151 273
Art 25 56 35 22 138 35 34 55 36 160 298
Table 1.4 Faculty-wise Library Users

More Related Content

What's hot

A seminar on quantitave data analysis
A seminar on quantitave data analysisA seminar on quantitave data analysis
A seminar on quantitave data analysis
Bimel Kottarathil
 
Diagrammatic presentation of data
Diagrammatic presentation of dataDiagrammatic presentation of data
Diagrammatic presentation of data
Ajita Gupta
 
Sample and sampling techniques
Sample and sampling techniquesSample and sampling techniques
Sample and sampling techniques
Nursing Path
 
Horticulture - Identification of fruits crops.
Horticulture - Identification of fruits crops. Horticulture - Identification of fruits crops.
Horticulture - Identification of fruits crops.
DivyAdityaJoshi
 
DIAGRAMMATIC REPRESENTATION.pptx
DIAGRAMMATIC REPRESENTATION.pptxDIAGRAMMATIC REPRESENTATION.pptx
DIAGRAMMATIC REPRESENTATION.pptx
JEEVARATHINAM ANTONY
 
Tabulation
TabulationTabulation
Tabulation
Dodiya Nikunj
 
Data presentation Lecture
Data presentation Lecture Data presentation Lecture
Data presentation Lecture
AB Rajar
 
Basic Statistical Concepts and Methods
Basic Statistical Concepts and MethodsBasic Statistical Concepts and Methods
Basic Statistical Concepts and Methods
Ahmed-Refat Refat
 
Maturity indecs of minor fruits and vegetables
Maturity indecs of minor fruits and vegetablesMaturity indecs of minor fruits and vegetables
Maturity indecs of minor fruits and vegetables
DebashisSatapathy2
 
Unit 4 methods of data collection
Unit 4 methods of data collectionUnit 4 methods of data collection
Unit 4 methods of data collection
Eko Priyanto
 
presentation of data
presentation of datapresentation of data
presentation of data
Chie Pegollo
 
Maize
MaizeMaize
Data presentation
Data presentationData presentation
Data presentation
MaiBabes17
 
Tabulation
Tabulation Tabulation
Tabulation
Pranav Krishna
 
Types of Chart
Types of ChartTypes of Chart
Types of Chart
chartblocks
 
General Statistics boa
General Statistics boaGeneral Statistics boa
General Statistics boa
raileeanne
 
Chapter 2
Chapter 2Chapter 2
Chapter 2
Lem Lem
 
Graphical Representation of Statistical data
Graphical Representation of Statistical dataGraphical Representation of Statistical data
Graphical Representation of Statistical data
MD SAMSER
 
Data Present
Data PresentData Present
Data Present
guestc43c63
 
Data presentation 2
Data presentation 2Data presentation 2
Data presentation 2
Rawalpindi Medical College
 

What's hot (20)

A seminar on quantitave data analysis
A seminar on quantitave data analysisA seminar on quantitave data analysis
A seminar on quantitave data analysis
 
Diagrammatic presentation of data
Diagrammatic presentation of dataDiagrammatic presentation of data
Diagrammatic presentation of data
 
Sample and sampling techniques
Sample and sampling techniquesSample and sampling techniques
Sample and sampling techniques
 
Horticulture - Identification of fruits crops.
Horticulture - Identification of fruits crops. Horticulture - Identification of fruits crops.
Horticulture - Identification of fruits crops.
 
DIAGRAMMATIC REPRESENTATION.pptx
DIAGRAMMATIC REPRESENTATION.pptxDIAGRAMMATIC REPRESENTATION.pptx
DIAGRAMMATIC REPRESENTATION.pptx
 
Tabulation
TabulationTabulation
Tabulation
 
Data presentation Lecture
Data presentation Lecture Data presentation Lecture
Data presentation Lecture
 
Basic Statistical Concepts and Methods
Basic Statistical Concepts and MethodsBasic Statistical Concepts and Methods
Basic Statistical Concepts and Methods
 
Maturity indecs of minor fruits and vegetables
Maturity indecs of minor fruits and vegetablesMaturity indecs of minor fruits and vegetables
Maturity indecs of minor fruits and vegetables
 
Unit 4 methods of data collection
Unit 4 methods of data collectionUnit 4 methods of data collection
Unit 4 methods of data collection
 
presentation of data
presentation of datapresentation of data
presentation of data
 
Maize
MaizeMaize
Maize
 
Data presentation
Data presentationData presentation
Data presentation
 
Tabulation
Tabulation Tabulation
Tabulation
 
Types of Chart
Types of ChartTypes of Chart
Types of Chart
 
General Statistics boa
General Statistics boaGeneral Statistics boa
General Statistics boa
 
Chapter 2
Chapter 2Chapter 2
Chapter 2
 
Graphical Representation of Statistical data
Graphical Representation of Statistical dataGraphical Representation of Statistical data
Graphical Representation of Statistical data
 
Data Present
Data PresentData Present
Data Present
 
Data presentation 2
Data presentation 2Data presentation 2
Data presentation 2
 

Similar to 3. Tabulation of data.pptx

tabulation and cross tabulation: data processsing
tabulation and cross tabulation: data processsingtabulation and cross tabulation: data processsing
tabulation and cross tabulation: data processsing
ssuserb9efd7
 
Tabulation of data-Development of Research Instrument/ Tool and Analysis
Tabulation of data-Development of Research Instrument/ Tool and Analysis Tabulation of data-Development of Research Instrument/ Tool and Analysis
Tabulation of data-Development of Research Instrument/ Tool and Analysis
ShaharyarShoukatShou
 
research methodology presentation-6.pptx
research methodology presentation-6.pptxresearch methodology presentation-6.pptx
research methodology presentation-6.pptx
vidyasagarsharma0001
 
Presentation of data
Presentation of dataPresentation of data
Presentation of data
Deepak Kushwaha
 
Tabulation
TabulationTabulation
Tabulation
freelancer
 
VIPIN SINGH PRESENTATION
VIPIN SINGH PRESENTATIONVIPIN SINGH PRESENTATION
VIPIN SINGH PRESENTATION
 
presentation of data-1.ppt MODIFIED PATEY MASTECTOMY: More commonly used. • T...
presentation of data-1.ppt MODIFIED PATEY MASTECTOMY: More commonly used. • T...presentation of data-1.ppt MODIFIED PATEY MASTECTOMY: More commonly used. • T...
presentation of data-1.ppt MODIFIED PATEY MASTECTOMY: More commonly used. • T...
ssuser28ecf81
 
Presentation of Data using various techniques -reserach.pptx
Presentation of Data using various techniques -reserach.pptxPresentation of Data using various techniques -reserach.pptx
Presentation of Data using various techniques -reserach.pptx
Ar.Vrushali Dhamne
 
Chapter 4
Chapter 4Chapter 4
Chapter 4
Pauline Velarde
 
Data-Presentation-and-Interpretation-in-Tabular-Graphical.pptx
Data-Presentation-and-Interpretation-in-Tabular-Graphical.pptxData-Presentation-and-Interpretation-in-Tabular-Graphical.pptx
Data-Presentation-and-Interpretation-in-Tabular-Graphical.pptx
shyrahipolitoe
 
The uses of Tables & graphs
The uses of Tables & graphsThe uses of Tables & graphs
The uses of Tables & graphs
Franco Jesús
 
08 Tabulation
08 Tabulation08 Tabulation
08 Tabulation
Noushad Feroke
 
Numerical & graphical presentation of data
Numerical & graphical presentation of dataNumerical & graphical presentation of data
Numerical & graphical presentation of data
Sarfraz Ahmad
 
Data presenattaion we can read this document..pptx
Data presenattaion  we can read this document..pptxData presenattaion  we can read this document..pptx
Data presenattaion we can read this document..pptx
Sajjadali639348
 
Biostatistics Tabulation of data
Biostatistics Tabulation of dataBiostatistics Tabulation of data
Biostatistics Tabulation of data
HARINATHA REDDY ASWARTHA
 
Use-of-ICT-in-presentation.pdf
Use-of-ICT-in-presentation.pdfUse-of-ICT-in-presentation.pdf
Use-of-ICT-in-presentation.pdf
Pratibha Sagar
 
DATA-PROCESSING.pptx
DATA-PROCESSING.pptxDATA-PROCESSING.pptx
DATA-PROCESSING.pptx
MeetHooda
 
Apa manual chapter 5
Apa manual chapter 5Apa manual chapter 5
Apa manual chapter 5
Tamannagupta19
 
Exel
ExelExel
PRESENTATION OF DATA.pptx
PRESENTATION OF DATA.pptxPRESENTATION OF DATA.pptx
PRESENTATION OF DATA.pptx
LadeneDenila
 

Similar to 3. Tabulation of data.pptx (20)

tabulation and cross tabulation: data processsing
tabulation and cross tabulation: data processsingtabulation and cross tabulation: data processsing
tabulation and cross tabulation: data processsing
 
Tabulation of data-Development of Research Instrument/ Tool and Analysis
Tabulation of data-Development of Research Instrument/ Tool and Analysis Tabulation of data-Development of Research Instrument/ Tool and Analysis
Tabulation of data-Development of Research Instrument/ Tool and Analysis
 
research methodology presentation-6.pptx
research methodology presentation-6.pptxresearch methodology presentation-6.pptx
research methodology presentation-6.pptx
 
Presentation of data
Presentation of dataPresentation of data
Presentation of data
 
Tabulation
TabulationTabulation
Tabulation
 
VIPIN SINGH PRESENTATION
VIPIN SINGH PRESENTATIONVIPIN SINGH PRESENTATION
VIPIN SINGH PRESENTATION
 
presentation of data-1.ppt MODIFIED PATEY MASTECTOMY: More commonly used. • T...
presentation of data-1.ppt MODIFIED PATEY MASTECTOMY: More commonly used. • T...presentation of data-1.ppt MODIFIED PATEY MASTECTOMY: More commonly used. • T...
presentation of data-1.ppt MODIFIED PATEY MASTECTOMY: More commonly used. • T...
 
Presentation of Data using various techniques -reserach.pptx
Presentation of Data using various techniques -reserach.pptxPresentation of Data using various techniques -reserach.pptx
Presentation of Data using various techniques -reserach.pptx
 
Chapter 4
Chapter 4Chapter 4
Chapter 4
 
Data-Presentation-and-Interpretation-in-Tabular-Graphical.pptx
Data-Presentation-and-Interpretation-in-Tabular-Graphical.pptxData-Presentation-and-Interpretation-in-Tabular-Graphical.pptx
Data-Presentation-and-Interpretation-in-Tabular-Graphical.pptx
 
The uses of Tables & graphs
The uses of Tables & graphsThe uses of Tables & graphs
The uses of Tables & graphs
 
08 Tabulation
08 Tabulation08 Tabulation
08 Tabulation
 
Numerical & graphical presentation of data
Numerical & graphical presentation of dataNumerical & graphical presentation of data
Numerical & graphical presentation of data
 
Data presenattaion we can read this document..pptx
Data presenattaion  we can read this document..pptxData presenattaion  we can read this document..pptx
Data presenattaion we can read this document..pptx
 
Biostatistics Tabulation of data
Biostatistics Tabulation of dataBiostatistics Tabulation of data
Biostatistics Tabulation of data
 
Use-of-ICT-in-presentation.pdf
Use-of-ICT-in-presentation.pdfUse-of-ICT-in-presentation.pdf
Use-of-ICT-in-presentation.pdf
 
DATA-PROCESSING.pptx
DATA-PROCESSING.pptxDATA-PROCESSING.pptx
DATA-PROCESSING.pptx
 
Apa manual chapter 5
Apa manual chapter 5Apa manual chapter 5
Apa manual chapter 5
 
Exel
ExelExel
Exel
 
PRESENTATION OF DATA.pptx
PRESENTATION OF DATA.pptxPRESENTATION OF DATA.pptx
PRESENTATION OF DATA.pptx
 

More from SGRRIMHS

thefetalcirculation-140802065924-phpapp02 (1).pdf
thefetalcirculation-140802065924-phpapp02 (1).pdfthefetalcirculation-140802065924-phpapp02 (1).pdf
thefetalcirculation-140802065924-phpapp02 (1).pdf
SGRRIMHS
 
8. Aids in children.pptx
8. Aids in children.pptx8. Aids in children.pptx
8. Aids in children.pptx
SGRRIMHS
 
Historical evolution of research in nursing_compressed (1).pdf
Historical evolution of research in nursing_compressed (1).pdfHistorical evolution of research in nursing_compressed (1).pdf
Historical evolution of research in nursing_compressed (1).pdf
SGRRIMHS
 
Job Discription.pptx
Job Discription.pptxJob Discription.pptx
Job Discription.pptx
SGRRIMHS
 
Growth and development.pptx
Growth and development.pptxGrowth and development.pptx
Growth and development.pptx
SGRRIMHS
 
G and D from Infant toAdolescence.pptx
G and D from Infant toAdolescence.pptxG and D from Infant toAdolescence.pptx
G and D from Infant toAdolescence.pptx
SGRRIMHS
 
infectionpreventionandsafetymeasures-170805051042 (1).pptx
infectionpreventionandsafetymeasures-170805051042 (1).pptxinfectionpreventionandsafetymeasures-170805051042 (1).pptx
infectionpreventionandsafetymeasures-170805051042 (1).pptx
SGRRIMHS
 
Trends in development of Nursing education in india.pptx
Trends in development of Nursing education in india.pptxTrends in development of Nursing education in india.pptx
Trends in development of Nursing education in india.pptx
SGRRIMHS
 
7. Accident prevention in children-.pptx
7. Accident prevention in children-.pptx7. Accident prevention in children-.pptx
7. Accident prevention in children-.pptx
SGRRIMHS
 
1. Methods of acquiring knowledge in Nursing.pptx
1. Methods of acquiring knowledge in Nursing.pptx1. Methods of acquiring knowledge in Nursing.pptx
1. Methods of acquiring knowledge in Nursing.pptx
SGRRIMHS
 
Performance Apprasial.pptx
Performance Apprasial.pptxPerformance Apprasial.pptx
Performance Apprasial.pptx
SGRRIMHS
 
Evaluation.pptx
Evaluation.pptxEvaluation.pptx
Evaluation.pptx
SGRRIMHS
 
Nursing Process Approach.pptx
Nursing Process Approach.pptxNursing Process Approach.pptx
Nursing Process Approach.pptx
SGRRIMHS
 

More from SGRRIMHS (13)

thefetalcirculation-140802065924-phpapp02 (1).pdf
thefetalcirculation-140802065924-phpapp02 (1).pdfthefetalcirculation-140802065924-phpapp02 (1).pdf
thefetalcirculation-140802065924-phpapp02 (1).pdf
 
8. Aids in children.pptx
8. Aids in children.pptx8. Aids in children.pptx
8. Aids in children.pptx
 
Historical evolution of research in nursing_compressed (1).pdf
Historical evolution of research in nursing_compressed (1).pdfHistorical evolution of research in nursing_compressed (1).pdf
Historical evolution of research in nursing_compressed (1).pdf
 
Job Discription.pptx
Job Discription.pptxJob Discription.pptx
Job Discription.pptx
 
Growth and development.pptx
Growth and development.pptxGrowth and development.pptx
Growth and development.pptx
 
G and D from Infant toAdolescence.pptx
G and D from Infant toAdolescence.pptxG and D from Infant toAdolescence.pptx
G and D from Infant toAdolescence.pptx
 
infectionpreventionandsafetymeasures-170805051042 (1).pptx
infectionpreventionandsafetymeasures-170805051042 (1).pptxinfectionpreventionandsafetymeasures-170805051042 (1).pptx
infectionpreventionandsafetymeasures-170805051042 (1).pptx
 
Trends in development of Nursing education in india.pptx
Trends in development of Nursing education in india.pptxTrends in development of Nursing education in india.pptx
Trends in development of Nursing education in india.pptx
 
7. Accident prevention in children-.pptx
7. Accident prevention in children-.pptx7. Accident prevention in children-.pptx
7. Accident prevention in children-.pptx
 
1. Methods of acquiring knowledge in Nursing.pptx
1. Methods of acquiring knowledge in Nursing.pptx1. Methods of acquiring knowledge in Nursing.pptx
1. Methods of acquiring knowledge in Nursing.pptx
 
Performance Apprasial.pptx
Performance Apprasial.pptxPerformance Apprasial.pptx
Performance Apprasial.pptx
 
Evaluation.pptx
Evaluation.pptxEvaluation.pptx
Evaluation.pptx
 
Nursing Process Approach.pptx
Nursing Process Approach.pptxNursing Process Approach.pptx
Nursing Process Approach.pptx
 

Recently uploaded

Part II - Body Grief: Losing parts of ourselves and our identity before, duri...
Part II - Body Grief: Losing parts of ourselves and our identity before, duri...Part II - Body Grief: Losing parts of ourselves and our identity before, duri...
Part II - Body Grief: Losing parts of ourselves and our identity before, duri...
bkling
 
REGULATION FOR COMBINATION PRODUCTS AND MEDICAL DEVICES.pptx
REGULATION FOR COMBINATION PRODUCTS AND MEDICAL DEVICES.pptxREGULATION FOR COMBINATION PRODUCTS AND MEDICAL DEVICES.pptx
REGULATION FOR COMBINATION PRODUCTS AND MEDICAL DEVICES.pptx
LaniyaNasrink
 
Ketone bodies and metabolism-biochemistry
Ketone bodies and metabolism-biochemistryKetone bodies and metabolism-biochemistry
Ketone bodies and metabolism-biochemistry
Dhayanithi C
 
Chapter 11 Nutrition and Chronic Diseases.pptx
Chapter 11 Nutrition and Chronic Diseases.pptxChapter 11 Nutrition and Chronic Diseases.pptx
Chapter 11 Nutrition and Chronic Diseases.pptx
Earlene McNair
 
CHEMOTHERAPY_RDP_CHAPTER 4_ANTI VIRAL DRUGS.pdf
CHEMOTHERAPY_RDP_CHAPTER 4_ANTI VIRAL DRUGS.pdfCHEMOTHERAPY_RDP_CHAPTER 4_ANTI VIRAL DRUGS.pdf
CHEMOTHERAPY_RDP_CHAPTER 4_ANTI VIRAL DRUGS.pdf
rishi2789
 
A Classical Text Review on Basavarajeeyam
A Classical Text Review on BasavarajeeyamA Classical Text Review on Basavarajeeyam
A Classical Text Review on Basavarajeeyam
Dr. Jyothirmai Paindla
 
Promoting Wellbeing - Applied Social Psychology - Psychology SuperNotes
Promoting Wellbeing - Applied Social Psychology - Psychology SuperNotesPromoting Wellbeing - Applied Social Psychology - Psychology SuperNotes
Promoting Wellbeing - Applied Social Psychology - Psychology SuperNotes
PsychoTech Services
 
CBL Seminar 2024_Preliminary Program.pdf
CBL Seminar 2024_Preliminary Program.pdfCBL Seminar 2024_Preliminary Program.pdf
CBL Seminar 2024_Preliminary Program.pdf
suvadeepdas911
 
Post-Menstrual Smell- When to Suspect Vaginitis.pptx
Post-Menstrual Smell- When to Suspect Vaginitis.pptxPost-Menstrual Smell- When to Suspect Vaginitis.pptx
Post-Menstrual Smell- When to Suspect Vaginitis.pptx
FFragrant
 
8 Surprising Reasons To Meditate 40 Minutes A Day That Can Change Your Life.pptx
8 Surprising Reasons To Meditate 40 Minutes A Day That Can Change Your Life.pptx8 Surprising Reasons To Meditate 40 Minutes A Day That Can Change Your Life.pptx
8 Surprising Reasons To Meditate 40 Minutes A Day That Can Change Your Life.pptx
Holistified Wellness
 
Best Ayurvedic medicine for Gas and Indigestion
Best Ayurvedic medicine for Gas and IndigestionBest Ayurvedic medicine for Gas and Indigestion
Best Ayurvedic medicine for Gas and Indigestion
Swastik Ayurveda
 
Aortic Association CBL Pilot April 19 – 20 Bern
Aortic Association CBL Pilot April 19 – 20 BernAortic Association CBL Pilot April 19 – 20 Bern
Aortic Association CBL Pilot April 19 – 20 Bern
suvadeepdas911
 
Netter's Atlas of Human Anatomy 7.ed.pdf
Netter's Atlas of Human Anatomy 7.ed.pdfNetter's Atlas of Human Anatomy 7.ed.pdf
Netter's Atlas of Human Anatomy 7.ed.pdf
BrissaOrtiz3
 
CHEMOTHERAPY_RDP_CHAPTER 1_ANTI TB DRUGS.pdf
CHEMOTHERAPY_RDP_CHAPTER 1_ANTI TB DRUGS.pdfCHEMOTHERAPY_RDP_CHAPTER 1_ANTI TB DRUGS.pdf
CHEMOTHERAPY_RDP_CHAPTER 1_ANTI TB DRUGS.pdf
rishi2789
 
Muscles of Mastication by Dr. Rabia Inam Gandapore.pptx
Muscles of Mastication by Dr. Rabia Inam Gandapore.pptxMuscles of Mastication by Dr. Rabia Inam Gandapore.pptx
Muscles of Mastication by Dr. Rabia Inam Gandapore.pptx
Dr. Rabia Inam Gandapore
 
CHEMOTHERAPY_RDP_CHAPTER 6_Anti Malarial Drugs.pdf
CHEMOTHERAPY_RDP_CHAPTER 6_Anti Malarial Drugs.pdfCHEMOTHERAPY_RDP_CHAPTER 6_Anti Malarial Drugs.pdf
CHEMOTHERAPY_RDP_CHAPTER 6_Anti Malarial Drugs.pdf
rishi2789
 
Integrating Ayurveda into Parkinson’s Management: A Holistic Approach
Integrating Ayurveda into Parkinson’s Management: A Holistic ApproachIntegrating Ayurveda into Parkinson’s Management: A Holistic Approach
Integrating Ayurveda into Parkinson’s Management: A Holistic Approach
Ayurveda ForAll
 
Role of Mukta Pishti in the Management of Hyperthyroidism
Role of Mukta Pishti in the Management of HyperthyroidismRole of Mukta Pishti in the Management of Hyperthyroidism
Role of Mukta Pishti in the Management of Hyperthyroidism
Dr. Jyothirmai Paindla
 
Clinic ^%[+27633867063*Abortion Pills For Sale In Tembisa Central
Clinic ^%[+27633867063*Abortion Pills For Sale In Tembisa CentralClinic ^%[+27633867063*Abortion Pills For Sale In Tembisa Central
Clinic ^%[+27633867063*Abortion Pills For Sale In Tembisa Central
19various
 
Diabetic nephropathy diagnosis treatment
Diabetic nephropathy diagnosis treatmentDiabetic nephropathy diagnosis treatment
Diabetic nephropathy diagnosis treatment
arahmanzai5
 

Recently uploaded (20)

Part II - Body Grief: Losing parts of ourselves and our identity before, duri...
Part II - Body Grief: Losing parts of ourselves and our identity before, duri...Part II - Body Grief: Losing parts of ourselves and our identity before, duri...
Part II - Body Grief: Losing parts of ourselves and our identity before, duri...
 
REGULATION FOR COMBINATION PRODUCTS AND MEDICAL DEVICES.pptx
REGULATION FOR COMBINATION PRODUCTS AND MEDICAL DEVICES.pptxREGULATION FOR COMBINATION PRODUCTS AND MEDICAL DEVICES.pptx
REGULATION FOR COMBINATION PRODUCTS AND MEDICAL DEVICES.pptx
 
Ketone bodies and metabolism-biochemistry
Ketone bodies and metabolism-biochemistryKetone bodies and metabolism-biochemistry
Ketone bodies and metabolism-biochemistry
 
Chapter 11 Nutrition and Chronic Diseases.pptx
Chapter 11 Nutrition and Chronic Diseases.pptxChapter 11 Nutrition and Chronic Diseases.pptx
Chapter 11 Nutrition and Chronic Diseases.pptx
 
CHEMOTHERAPY_RDP_CHAPTER 4_ANTI VIRAL DRUGS.pdf
CHEMOTHERAPY_RDP_CHAPTER 4_ANTI VIRAL DRUGS.pdfCHEMOTHERAPY_RDP_CHAPTER 4_ANTI VIRAL DRUGS.pdf
CHEMOTHERAPY_RDP_CHAPTER 4_ANTI VIRAL DRUGS.pdf
 
A Classical Text Review on Basavarajeeyam
A Classical Text Review on BasavarajeeyamA Classical Text Review on Basavarajeeyam
A Classical Text Review on Basavarajeeyam
 
Promoting Wellbeing - Applied Social Psychology - Psychology SuperNotes
Promoting Wellbeing - Applied Social Psychology - Psychology SuperNotesPromoting Wellbeing - Applied Social Psychology - Psychology SuperNotes
Promoting Wellbeing - Applied Social Psychology - Psychology SuperNotes
 
CBL Seminar 2024_Preliminary Program.pdf
CBL Seminar 2024_Preliminary Program.pdfCBL Seminar 2024_Preliminary Program.pdf
CBL Seminar 2024_Preliminary Program.pdf
 
Post-Menstrual Smell- When to Suspect Vaginitis.pptx
Post-Menstrual Smell- When to Suspect Vaginitis.pptxPost-Menstrual Smell- When to Suspect Vaginitis.pptx
Post-Menstrual Smell- When to Suspect Vaginitis.pptx
 
8 Surprising Reasons To Meditate 40 Minutes A Day That Can Change Your Life.pptx
8 Surprising Reasons To Meditate 40 Minutes A Day That Can Change Your Life.pptx8 Surprising Reasons To Meditate 40 Minutes A Day That Can Change Your Life.pptx
8 Surprising Reasons To Meditate 40 Minutes A Day That Can Change Your Life.pptx
 
Best Ayurvedic medicine for Gas and Indigestion
Best Ayurvedic medicine for Gas and IndigestionBest Ayurvedic medicine for Gas and Indigestion
Best Ayurvedic medicine for Gas and Indigestion
 
Aortic Association CBL Pilot April 19 – 20 Bern
Aortic Association CBL Pilot April 19 – 20 BernAortic Association CBL Pilot April 19 – 20 Bern
Aortic Association CBL Pilot April 19 – 20 Bern
 
Netter's Atlas of Human Anatomy 7.ed.pdf
Netter's Atlas of Human Anatomy 7.ed.pdfNetter's Atlas of Human Anatomy 7.ed.pdf
Netter's Atlas of Human Anatomy 7.ed.pdf
 
CHEMOTHERAPY_RDP_CHAPTER 1_ANTI TB DRUGS.pdf
CHEMOTHERAPY_RDP_CHAPTER 1_ANTI TB DRUGS.pdfCHEMOTHERAPY_RDP_CHAPTER 1_ANTI TB DRUGS.pdf
CHEMOTHERAPY_RDP_CHAPTER 1_ANTI TB DRUGS.pdf
 
Muscles of Mastication by Dr. Rabia Inam Gandapore.pptx
Muscles of Mastication by Dr. Rabia Inam Gandapore.pptxMuscles of Mastication by Dr. Rabia Inam Gandapore.pptx
Muscles of Mastication by Dr. Rabia Inam Gandapore.pptx
 
CHEMOTHERAPY_RDP_CHAPTER 6_Anti Malarial Drugs.pdf
CHEMOTHERAPY_RDP_CHAPTER 6_Anti Malarial Drugs.pdfCHEMOTHERAPY_RDP_CHAPTER 6_Anti Malarial Drugs.pdf
CHEMOTHERAPY_RDP_CHAPTER 6_Anti Malarial Drugs.pdf
 
Integrating Ayurveda into Parkinson’s Management: A Holistic Approach
Integrating Ayurveda into Parkinson’s Management: A Holistic ApproachIntegrating Ayurveda into Parkinson’s Management: A Holistic Approach
Integrating Ayurveda into Parkinson’s Management: A Holistic Approach
 
Role of Mukta Pishti in the Management of Hyperthyroidism
Role of Mukta Pishti in the Management of HyperthyroidismRole of Mukta Pishti in the Management of Hyperthyroidism
Role of Mukta Pishti in the Management of Hyperthyroidism
 
Clinic ^%[+27633867063*Abortion Pills For Sale In Tembisa Central
Clinic ^%[+27633867063*Abortion Pills For Sale In Tembisa CentralClinic ^%[+27633867063*Abortion Pills For Sale In Tembisa Central
Clinic ^%[+27633867063*Abortion Pills For Sale In Tembisa Central
 
Diabetic nephropathy diagnosis treatment
Diabetic nephropathy diagnosis treatmentDiabetic nephropathy diagnosis treatment
Diabetic nephropathy diagnosis treatment
 

3. Tabulation of data.pptx

  • 2. INTRODUCTION The classification of data leads to the problem of presentation of data. The presentation of data means exhibition of the data in such a clear and attractive manner that these are easily understood and analyzed. There many forms of presentation of data of which the following three are well known: (i). Textual Presentation, (ii). Tabular Presentation, (iii). Diagrammatic Presentation. Here, we discuses in detail Tabular method of data
  • 3. WHAT IS A TABLE: A table is a symmetric arrangement of statistical data in rows and columns. A table presents data in a concise, systematic manner from masses of statistical data. Tabulation is the first step before data is used for further statistical analysis and interpretation.
  • 4. DEFINITIONS “Table involves the orderly and systematic presentation of numerical data in a form designed to elucidate the problem under consideration.” ---According Prof. L.R.Connor,” “Table in its broadest sense is an orderly arrangement of data in column and rows. “ ---According to Prof. M.M.
  • 5. MEANING In the light of above mentioned definitions we can say in brief, “Table is systematic organization and presentation of data in the form of rows and columns. Whereas rows are horizontal arrangements and columns are vertical arrangements.
  • 6. OBJECTIVES OF DATA TABULATION To carry out investigations  To do comparisons  To locate omissions and errors in the data  To use space economically  To study the trends  To simplify data  To use it as future references
  • 7. RULES OF TABULATION There are no hard and fast rules for the tabulation of data but for constructing good table, following general rules should be observed while tabulating statistical data. The table should suit the size of the paper and, therefore, the width of the column should be decided before hand.  Number of columns and rows should neither be too large nor too small.  As far as possible figures should be approximated before tabulation. This would reduce unnecessary details.  Items should be arranged either in alphabetical, chronological or geographical order or according to size.
  • 8. The sub-total and total of the items of the table must be written.  Percentages are given in the tables if necessary.  Ditto marks should not be used in a table because sometimes it create confusion.  Table should be simple and attractive.  A table should be logical, well-balanced in length and breadth and the comparable columns should be placed side by side.  Light/heavy/thick or double rulings may be used to distinguish sub columns, main columns and totals.  For large data more than one table may be used.
  • 9. FEATURES OF A GOOD TABLE Title as compatible with the objective of the study  To facilitate comparison.  Ideal Size  Heading Abbreviation  Footnote  Total  Source of data  Size of Columns  Simple, Economical and Attractive
  • 11. PARTS OF AN IDEAL TABLE Table number: A number must be allotted to the table for identification, particularly when there are many tables in a study. Title: The title should explain what is contained in the table. It should be clear, brief and set in bold type on top of the table. It should also indicate the time and place to which the data refer.
  • 12. Date: The date of preparation of the table should be given.  Stubs or Row designations: Each row of the table should be given a brief heading. Such designations of rows are called “stubs”, or, “stub items” and the entire column is called “stub column”.  Column headings or Captions: Column designation is designation is given on top of each column to explain to what the figures in the column refer. It should be clear and precise. This is called a “caption”, or, “heading”. columns should be numbered if there are
  • 13. Body of the table: The data should be arranged in such a way that any figure can be located easily. Various types of numerical variables should be arranged in an ascending order, i.e., from left to right in rows and from top to bottom in columns. Column and row totals should be given. Source: At the bottom of the table a note should be added indicating the primary and secondary sources from which data have been collected.  Footnotes and references: If any item has not been explained properly, a separate explanatory note should be added at the bottom of the table.
  • 14. IMPORTANCE OF TABULATION Under tabulation, data is divided into various parts and for each part there are totals and sub totals. Therefore, relationship between different parts can be easily known.  Since data are arranged in a table with a title and a number so these can be easily identified and used for the required purpose  Tabulation makes the data brief. Therefore, it can be easily presented in the form of graphs.  Tabulation presents the numerical figures in an
  • 15. Tabulation makes complex data simple and as a result of this, it becomes easy to understand the data. This form of the presentation of data is helpful in finding mistakes.  Tabulation is useful in condensing the collected data.  Tabulation makes it easy to analyze the data from tables.  Tabulation is a very cheap mode to present the data. It saves time as well as space.  Tabulation is a device to summaries the large scattered data. So, the maximum information may be collected
  • 16. METHODS OF TABULATION Simple tabulation: Simple tabulation is when the data are tabulated to one characteristic. For example, the survey that determined the frequency or number of employees of a firm owning different brands of mobile phones like Blackberry, Nokia, I phone, etc.  Double tabulation: Double tabulation is when two characteristics of data are tabulated. For example, frequency or number of male and female employees in the firm owning different brand of mobile phones like Blackberry, Nokia, Iphone, etc.
  • 17. Complex tabulation: Complex tabulation of data that includes more than two characteristics. For example, frequency or number of male, female and the total employees owning different brand of mobile phones like Blackberry, Nokia, I phone, etc. Cross tabulations, is also a sub-type of complex tabulation that includes cross-classifying factors to build a contingency table of counts or frequencies at each combination of factor levels. A contingency table is a display format used to analyze and record the possible relationship between two or more categorical variables
  • 18. TYPES OF TABLES There are three basis of classifying tables. I. Purpose of a table II. Originality of a table III. Construction of a table.
  • 19. Kinds of Tables General Purpose Table According to Constructio n According to Originality Accordin g to Purpose Drived table Original table Specific Purpose Table Complex table Simple or one way table Manifold table Treble table Double or two way table
  • 20. I. ACCORDING TO PURPOSE General Purpose Table: General purpose table is that table which is of general use. It is does not serve any specific purpose or specific problem under consideration.  Special Purpose Table: Special Purpose table is that table which is prepared with some specific purpose in mind.
  • 21. II. ACCORDING TO ORIGINALITY Original Table: An original table is that in which data are presented in the same form and manner in which they are collected.  Derived Table: A derived table is that in which data are not presented in the form or manner in which these are collected. Instead the data are first converted into ratios or percentage and then presented.
  • 22. III. ACCORDING TO CONSTRUCTION Simple Table Complex Tables  Double or Two-Way Table Three-Way Table Manifold (or Higher Order) Table
  • 23. SIMPLE TABLE • In a simple table (also known as one-way table), data are presented based on only one characteristic. Table 1.1 illustrates the concept. Faculties Number of Users Science 50 Commerce 70 Arts 90 Total 210 Table 1.1 Faculty-wise Library Users
  • 24. COMPLEX TABLES In a complex table (also known as a manifold table) data are presented according to two or more characteristics simultaneously. The complex tables are two-way or three-way tables according to whether two or three characteristics are presented simultaneously. Double or Two-Way Table Three-Way Table Manifold (or Higher Order) Table
  • 25. DOUBLE OR TWO-WAY TABLE • In such a table, the variable under study is further subdivided into two groups according to two inter- related characteristics. The two-way table is shown in Table 1.2. Faculties Numbers of User Total Girls Girls science 20 30 50 Commerce 30 40 70 Arts 35 55 90 total 85 125 210 Table 1.2 Faculty-wise Library Users
  • 26. THREE-WAY TABLE • In such a table, the variable under study is divided according to three interrelated characteristics. Faculties Number of users Total (1)+(2) Girls Boys I Sem II Sem Total (1) I Sem II Sem Total (2) Science 15 20 35 20 30 50 85 Commerc e 35 30 65 45 40 85 150 Art 25 35 60 35 55 90 150 Total 75 85 160 100 125 225 385 Table 1.3 Faculty-wise Library Users
  • 27. MANIFOLD (OR HIGHER ORDER) TABLE • Such tables provide information about a large no of interrelated characteristics in the data set. Faculties Number of users Total (1)+(2) Girls Boys I Sem II Se m I Sem II Sem Total (1) I Sem II Sem I Se m II Sem Total (2) Science 15 34 20 54 123 20 45 30 27 122 245 Commerce 35 23 30 122 122 45 37 40 29 151 273 Art 25 56 35 22 138 35 34 55 36 160 298 Table 1.4 Faculty-wise Library Users