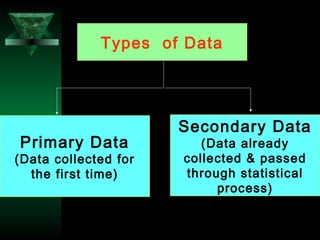
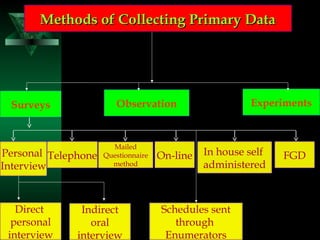
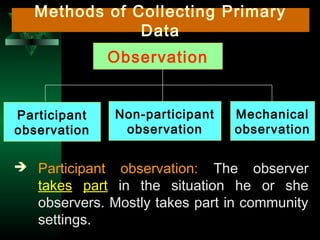
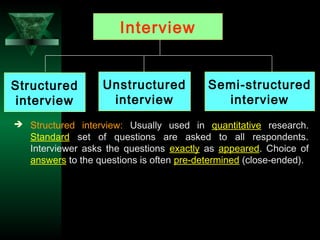
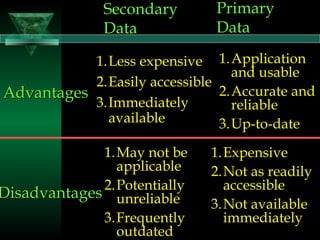
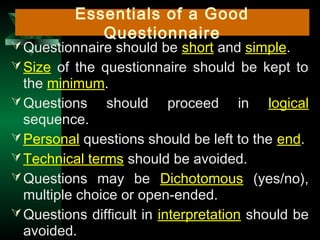
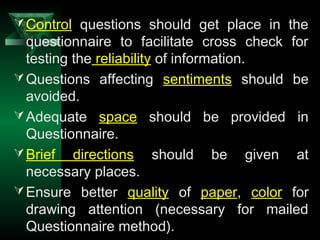
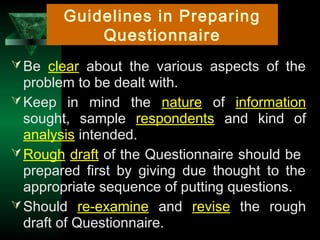
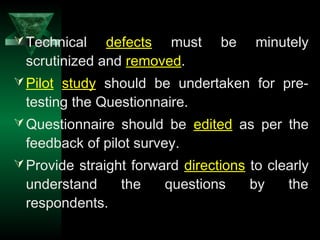
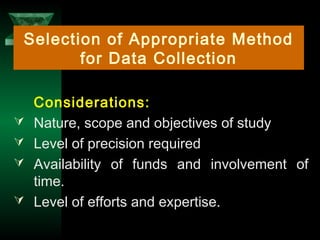
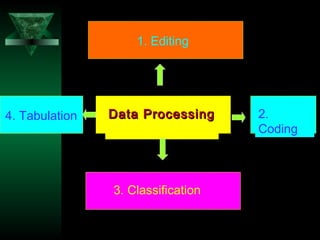
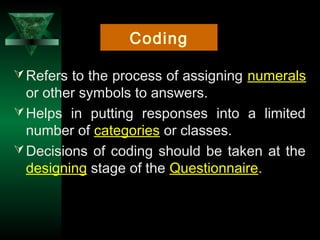
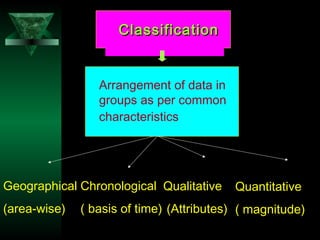
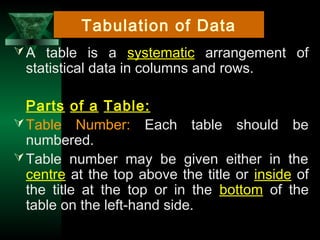
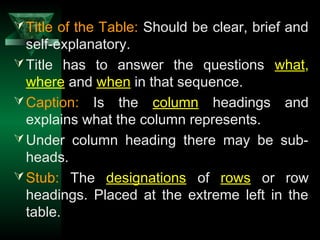
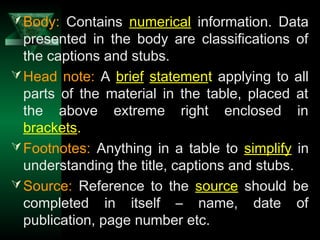
This chapter discusses procedures for data collection, processing, and analysis including primary and secondary data collection methods, guidelines for questionnaires, data editing, coding, classification, tabulation, and presenting data through diagrams and graphs for analysis and answering research questions.
This is an exclusive presentation on data collection for researchers in National Institutes Labor of Administration & Training (NILAT), Ministry of production, government of Pakistan
The data, collected for research, has to be processed, analyzed and interpreted to develop a solution to the research question.
Data analysis is a practice in which unorganized or unfinished data  is ordered and organized so that useful information can be extracted from it.
It is the most enjoyable part of carrying out the research since after all of the hard works and waiting the researcher gets the chance to find out the answers. So analyzing the data and interpreting the results are the ârewardâ for the work of collecting the data.
This was a presentation that was carried out in our research method class by our group. It will be useful for PHD and master students quantitative and qualitative method. It consist sample definition, purpose of sampling, stages in the selection of a sample, types of sampling in quantitative researches, types of sampling in qualitative researches, and ethical Considerations in Data Collection.
Data analysis means the ordering, manipulating, and summarizing of data to obtain answers to research questions. Its purpose is to reduce data to intelligible and interpretable form so that the relations of research problems can be studied and tested.
Introduction to Epidemiology Course Project Detailed Article Cri.docxmariuse18nolet
Â
Introduction to Epidemiology Course Project
Detailed Article Critique
Reading, interpreting, and judging the value of epidemiologic literature is a skill that you will exercise throughout your academic career in public health and beyond. To help prepare you for your thesis or capstone experience as well as future coursework, your project this term involves writing a detailed critique of an article. (See link in blackboard.) Construct your critique using complete paragraphs. DO NOT present your critique as an outline.
Please consult the table on the next page to ensure that your review includes the required major elements for this assignment. We will use this table in our evaluation of your project. Each element is worth a specified number of points. Please understand that full credit will not be awarded for simply mentioning each element. You must justify your assessment. For example, you cannot simply state, âThe authors justified the importance of their study.â You need to point out how the authors did or did not meet each criterion. Your critique should not be longer than 4-6 pages double-spaced with one-inch margins. There is no minimum page requirement.
For additional assistance, please refer to the article by Young et al. (2009) that is also posted in Blackboard along with the article that you are to review.
See next page for more details. ( ( ( ( ( (
Name___________________________
Element
Possible Points
Grade
Objectives:
¡ What is/are the research question(s) addressed by this study?
¡ Did the authors justify the need for their study? What was it?
5
5
Study Design:
¡ Describe the study design and methods used for the study.
¡ Critique the overall design by addressing the following:
¡ Did the authors correctly identify their study design (e.g., the authors stated that their study was a cohort study when it really was a cross-sectional study)?
¡ Did the authors present clear definitions of their exposure/health outcomes?
¡ Did the authors adequately describe their sampling (e.g., convenience, consecutive, or random; response rate; study population) and data collection methods (e.g., questionnaire, records, biomarkers, surveys, etc.)?
15
10
Analysis:
¡ Describe the data analysis plan overall.
¡ Critique the analysis plan by addressing the following:
¡ Is the analysis appropriate for the study design (considering you level of statistical knowledge)? Was potential confounding addressed in the analysis stage? If so, how?
¡ Are the tables and graphs well organized and labeled? Do the tables and graphs provide enough data for reader to draw their own conclusions (e.g. do they stand alone?)?
¡ Are the findings within the tables/figures consistent? Is each table/figure consistent with the text and other tables/figures?
¡ Can the findings be attributed simply to chance?
5
10
Validity and Conclusions:
¡ Internal validity- Consider the potential for selection bias, information bias, and .
Research design decisions and be competent in the process of reliable data co...Stats Statswork
Â
Research Design may be described as the researchers scheme of outlining the flow of his project. It is based on research design, that the researcher goes about gathering data to answer his research question. It enables the researcher to prioritize his work, create better questionnaires and arrive at conclusions with greater clarity. Statswork offers statistical services as per the requirements of the customers. When you Order statistical Services at Statswork, we promise you the following â Always on Time, outstanding customer support, and High-quality Subject Matter Experts.
Learn More: http://bit.ly/2S312hb
Why Statswork?
Plagiarism Free | Unlimited Support | Prompt Turnaround Times | Subject Matter Expertise | Experienced Bio-statisticians & Statisticians | Statistics Across Methodologies | Wide Range Of Tools & Technologies Supports | Tutoring Services | 24/7 Email Support | Recommended by Universities
Contact Us:
Website: www.statswork.com/
Email: info@statswork.com
UnitedKingdom: +44-1143520021
India: +91-4448137070
WhatsApp: +91-8754446690
Practical applications and analysis in Research Methodology Hafsa Ranjha
Â
practical application in research, reviews of qualitative and mixed method studies, analysis, processing the data, data editing , data coding , classification of data, analysis of data, parametric test, non parametric test in
Research Methodology
The French Revolution, which began in 1789, was a period of radical social and political upheaval in France. It marked the decline of absolute monarchies, the rise of secular and democratic republics, and the eventual rise of Napoleon Bonaparte. This revolutionary period is crucial in understanding the transition from feudalism to modernity in Europe.
For more information, visit-www.vavaclasses.com
Synthetic Fiber Construction in lab .pptxPavel ( NSTU)
Â
Synthetic fiber production is a fascinating and complex field that blends chemistry, engineering, and environmental science. By understanding these aspects, students can gain a comprehensive view of synthetic fiber production, its impact on society and the environment, and the potential for future innovations. Synthetic fibers play a crucial role in modern society, impacting various aspects of daily life, industry, and the environment. ynthetic fibers are integral to modern life, offering a range of benefits from cost-effectiveness and versatility to innovative applications and performance characteristics. While they pose environmental challenges, ongoing research and development aim to create more sustainable and eco-friendly alternatives. Understanding the importance of synthetic fibers helps in appreciating their role in the economy, industry, and daily life, while also emphasizing the need for sustainable practices and innovation.
How to Split Bills in the Odoo 17 POS ModuleCeline George
Â
Bills have a main role in point of sale procedure. It will help to track sales, handling payments and giving receipts to customers. Bill splitting also has an important role in POS. For example, If some friends come together for dinner and if they want to divide the bill then it is possible by POS bill splitting. This slide will show how to split bills in odoo 17 POS.
2024.06.01 Introducing a competency framework for languag learning materials ...Sandy Millin
Â
http://sandymillin.wordpress.com/iateflwebinar2024
Published classroom materials form the basis of syllabuses, drive teacher professional development, and have a potentially huge influence on learners, teachers and education systems. All teachers also create their own materials, whether a few sentences on a blackboard, a highly-structured fully-realised online course, or anything in between. Despite this, the knowledge and skills needed to create effective language learning materials are rarely part of teacher training, and are mostly learnt by trial and error.
Knowledge and skills frameworks, generally called competency frameworks, for ELT teachers, trainers and managers have existed for a few years now. However, until I created one for my MA dissertation, there wasnât one drawing together what we need to know and do to be able to effectively produce language learning materials.
This webinar will introduce you to my framework, highlighting the key competencies I identified from my research. It will also show how anybody involved in language teaching (any language, not just English!), teacher training, managing schools or developing language learning materials can benefit from using the framework.
The Indian economy is classified into different sectors to simplify the analysis and understanding of economic activities. For Class 10, it's essential to grasp the sectors of the Indian economy, understand their characteristics, and recognize their importance. This guide will provide detailed notes on the Sectors of the Indian Economy Class 10, using specific long-tail keywords to enhance comprehension.
For more information, visit-www.vavaclasses.com
2. 2
Contents
ī Collection of data â primary, secondary
data
ī Methods of collecting data
ī Essentials of a good questionnaire
ī Selection of appropriate method for data
collection
ī Data processing - Editing, coding,
classifying and tabulating of data
ī Rules for tabulation
ī Diagrammatic and graphic presentation
ī Data analysis
3. 3
Types of Data
Primary Data
(Data collected for
the first time)
Secondary Data
(Data already
collected & passed
through statistical
process)
4. 4
īData collection begins only after a research
problem has been defined and research
design finalized.
īPrimary data are collected for the first time,
hence original in character.
īSecondary data are those which have
already been collected by someone else and
have already been passed through statistical
process.
5. 5
Methods of Collecting Primary DataMethods of Collecting Primary Data
Surveys Observation Experiments
Personal
Interview
Mailed
Questionnaire
method
On-lineTelephone In house self
administered
Schedules sent
through
Enumerators
Indirect
oral
interview
Direct
personal
interview
FGD
7. 7
ī¨ Non-participant observation: The observer
does not participate in the situation and
collects data by observing behaviour
without interacting with participants.
ī¨ Mechanical observation: People or
situations are to be observed in a closed
setting through mechanical devices.
9. 9
ī¨ Unstructured interview: Neither the
questions not the answers are pre-
determined. Questions can be changed or
adopted to meet respondentâs
understanding. Does not offer a restricted,
pre-set range of answers.
ī¨ Semi-structured interview: Includes partly
open-ended and closed-ended questions.
Involves both give and receive information.
10. 10
Sources of Secondary DataSources of Secondary Data
Internal Source External Source
Databases
Letters, Records
In house
publications
Ministries, Agencies of govt.
Reports of international
Bodies & foreign govt.
www., magazines
Journals, newspapers
Associations
Research Groups &Companies
Universities/Colleges
11. 11
ī¨ Each item contributes equally to the
measure of that construct, implying all
items are of equal importance.
ī¨ Can have several types of response
categories.
Rating Scale
12. 12
Type of
Scale
Points on Continuum
1 2 3 4 5
Agreement Strongly
Agree
Agree Neither
Agree or
Disagree
Disagree Strongly
Disagree
Frequency Always Often About Half
the Time
Seldom Never
Satisfaction Very
Satisfied
Satisfied Neither
Satisfied nor
Dissatisfied
Dissatisfied Very
Dissatisfied
Effectiveness Very
Effective
Effective Neither
Effective nor
Ineffective
Ineffective Very
Ineffective
Quality Very Good Good Average Poor Very Poor
Expectancy Much
Better than
Expected
Better than
Expected
As Expected Worse than
Expected
Much Worse
then
Expected
Extent To a Very
Great
Extent
To a Great
Extent
Somewhat To a Small
Extent
To a Very
Small Extent
14. 14
īQuestionnaire should be short and simple.
īSize of the questionnaire should be kept to
the minimum.
īQuestions should proceed in logical
sequence.
īPersonal questions should be left to the end.
īTechnical terms should be avoided.
īQuestions may be Dichotomous (yes/no),
multiple choice or open-ended.
īQuestions difficult in interpretation should be
avoided.
Essentials of a Good
Questionnaire
15. 15
īControl questions should get place in the
questionnaire to facilitate cross check for
testing the reliability of information.
īQuestions affecting sentiments should be
avoided.
īAdequate space should be provided in
Questionnaire.
īBrief directions should be given at
necessary places.
īEnsure better quality of paper, color for
drawing attention (necessary for mailed
Questionnaire method).
16. 16
īBe clear about the various aspects of the
problem to be dealt with.
īKeep in mind the nature of information
sought, sample respondents and kind of
analysis intended.
īRough draft of the Questionnaire should be
prepared first by giving due thought to the
appropriate sequence of putting questions.
īShould re-examine and revise the rough
draft of Questionnaire.
Guidelines in Preparing
Questionnaire
17. 17
īTechnical defects must be minutely
scrutinized and removed.
īPilot study should be undertaken for pre-
testing the Questionnaire.
īQuestionnaire should be edited as per the
feedback of pilot survey.
īProvide straight forward directions to clearly
understand the questions by the
respondents.
18. 18
Considerations:
ī Nature, scope and objectives of study
ī Level of precision required
ī Availability of funds and involvement of
time.
ī Level of efforts and expertise.
Selection of Appropriate Method
for Data Collection
19. 19
īProcessing implies editing, coding,
classification and tabulation of collected
data to help further analysis.
īAnalysis refers to computation of certain
measures along with searching for patterns
of relationship that exist among data-
groups.
īAnalysis involves organizing data for
answering the research questions.
Data Processing and Analysis
21. 21
EditingEditing
Central Editing
Field Editing
Checking the data for errors ,
omissions & ambiguities
Should be done
after the closing
of interview.
Should be done after
the field interview.
(Be familiar with instructions and understand clearly)
22. 22
īRefers to the process of assigning numerals
or other symbols to answers.
īHelps in putting responses into a limited
number of categories or classes.
īDecisions of coding should be taken at the
designing stage of the Questionnaire.
Coding
24. 24
īA table is a systematic arrangement of
statistical data in columns and rows.
Parts of a Table:
īTable Number: Each table should be
numbered.
īTable number may be given either in the
centre at the top above the title or inside of
the title at the top or in the bottom of the
table on the left-hand side.
Tabulation of Data
25. 25
īTitle of the Table: Should be clear, brief and
self-explanatory.
īTitle has to answer the questions what,
where and when in that sequence.
īCaption: Is the column headings and
explains what the column represents.
īUnder column heading there may be sub-
heads.
īStub: The designations of rows or row
headings. Placed at the extreme left in the
table.
26. 26
īBody: Contains numerical information. Data
presented in the body are classifications of
the captions and stubs.
īHead note: A brief statement applying to all
parts of the material in the table, placed at
the above extreme right enclosed in
brackets.
īFootnotes: Anything in a table to simplify in
understanding the title, captions and stubs.
īSource: Reference to the source should be
completed in itself â name, date of
publication, page number etc.
29. 29
Simple table (one-way table): Only one
characteristics is shown.
Table No. 2.1
Distribution of Teachers in Institute of Higher
Learning according to age-group
Age (in years) No. of Employees
Below 25
25 â 35
35 â 45
07 (25.93)
09 (33.33)
11 (40.74
Total 27 (100.0)
Footnote: Figures in the parentheses indicate percentage to total.
Source: Annual Report, Institute of Higher Learning, 2010.
30. 30
īTwo-way table: Shows two characteristics.
īFormed when either Stub or the Caption is
divided into two coordinate parts.
Table No. 2.1.3
Distribution of Teachers in Institute of Higher
Learning according to Age-groups and Sex
Age (in years) Teachers Total
Males Females
Below 25
25 â 35
35 â 45
06
07
13
05
09
04
11 (25.0)
16 (36.0)
17 (39.0)
Total 26 (59.0) 18 (41.0) 44 (100.0)
31. 31
īHigher order table: Three or more
characteristics are represented in the table.
īTreble tabulation: Three characteristics are
shown.
Age in
Years
Positions
TotalProfessor Associate
Professor
Assistant
Professor
M F Total M F Total M F Total M F Total
Below 25
25 - 35
03
04
02
05
05
09
07
11
06
07
13
18
01
03
04
05
05
08
11
18
12
17
23 (..)
35 (..)
Total 07 07 14 18 13 31 04 09 13 29 29 58
Distribution of Teachers in IHL according to Age-groups, Sex and
Positions
Table No. 3.2.1
32. 32
ī Manifold tabulation: Four or more characteristics
are simultaneously shown.
Table No. 4.6.1
Distribution of Teachers in IHL as per Religion, Age, Position
and Sex
Position
TotalProfessor Associate
Professor
Assistant
Professor
M F Total M F Total M F Total M F Total
Total
Total
Religion
Age(InYears)
BuddhismHinduism
33. 33
īGeneral tables: Reference or Repository
tables provide information for general use or
reference.
īUsually contain detailed information and are
not constructed for specific discussion.
īBe placed in the appendix of the reports for
easy reference.
īSpecial tables: Known as Summary tables,
provide information for particular discussion.
īBe placed in the body of the text.
īAre derived from general tables.
34. 34
General Rules:
īEvery diagram must be given a suitable title.
īA proper proportion between the height and
width of the diagram should be maintained to
avoid ugly look to the diagram.
īScale showing the values should be in even
numbers or in multiples of 5 or 10. Odd
values like 1,3,7 should be avoided.
Diagrammatic and Graphic
Presentation
35. 35
īScale should specify the size of the unit and
what it represents- million of tones, units in
thousands, etc.
īTo clarify certain points about diagram,
footnote be placed at the bottom of the
diagram.
īAn index explaining different types of lines
or shades, colors should be given for getting
the meaning easily.
36. 36
īDiagrams should be absolutely neat and
clean.
īToo much material should not be loaded in
a single diagram. This is to avoid confusion.
īDiagrams should be as simple as possible
to understand clearly and easily.