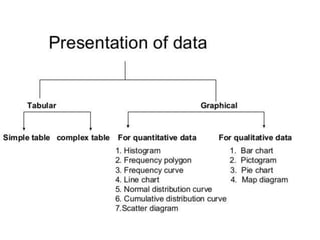
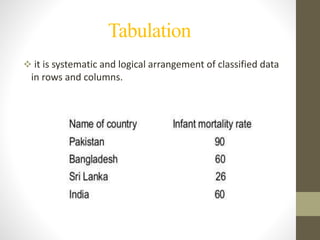
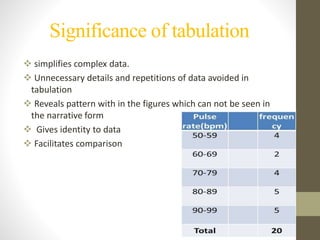
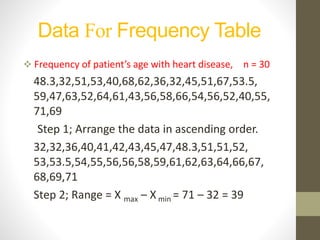
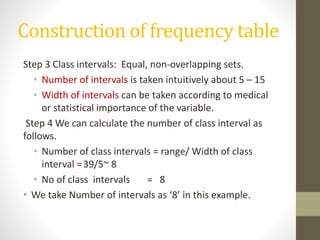
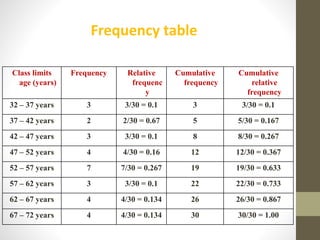
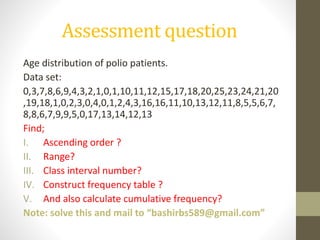
Data Presentation
Prep by: Mr. Bashir Ullah
MS Epi & biostatistics
KMU_IPHSS
By the end of this session, the
students should be able to
 Data and its types.
 Know about data presentation
 Know the different ways to present the
data scientifically and systematically.
 Types of data presentation (textual ,
tabular and graphical).
 Uses of data presentation
 Types of tables.
Definition of Data
• Data mean observation/ evidence ,raw facts and figures
/collection of meaningful information is called data.
Types of Data
• To give a holistic picture of classification data can divided into
two types :
• Quantitative data (numerical)
a) Discrete b) continuous
• Qualitative data (descriptive, categorical/frequency count)
a) Nominal b) Ordinal
Data Presentation
 Method by which the people organize, summarize and
communicate information using variety of tools such as tables,
graphs and diagrams.
Presentation of data
Uses of data presentation
 Easy and better understanding of the subject.
 Provide first hand information about data.
 Helpful in future analysis .
 Easy for making comparisons.
 Very attractive .
Data Presentation
• Principles of data presentation
(a) To present the data in a simple form so as to draw
the conclusion directly by viewing at the data.
(b) To present the information in a compact and concise
form without losing important details.
(c) To arrange the data in such a way that it should
create interest in the reader’s mind at the first sight.
(d) To present it in such away that it can help in further
statistical analysis.
Tabulation
 it is systematic and logical arrangement of classified data
in rows and columns.
Significance of tabulation
 simplifies complex data.
 Unnecessary details and repetitions of data avoided in
tabulation
 Reveals pattern with in the figures which can not be seen in
the narrative form
 Gives identity to data
 Facilitates comparison
Rules for Tabulation
Tables are the devices, that are used to present the data in a
simple form. It is probably the first step before the data is used for
analysis or interpretation.
General principles/rules of designing tables :
a) The tables should be numbered e.g. table 1, table 2 etc.
b) A title must be given to each table, which should be brief and
self explanatory.
c) The headings of columns or rows (subtitles) should be clear and
concise.
d)Group interval in column and rows should neither be too narrow
nor too wide.
e) The data must be presented according to size or importance
chronologically, alphabetically, or geographically.
f) If percentages or averages are to be compared, they should be
placed as close as possible.
g) Unit of measurement must be mentioned clearly where ever
necessary.
h) Any short form/symbols, if used should be explained in the
footnote. OR
Foot notes may be given, where necessary, providing explanatory
notes or additional information.
i) No table should be too large.
j) Most of the people find a vertical arrangement better than a
horizontal one because, it is easier to scan the data from top to
bottom than from left to right
Rules for Tabulation
Types of tables
1) Simple tables :Measurements of single set are presented
2) Complex tables :Measurements of multiple sets are presented
Frequency distribution table
• In the frequency distribution table, the data is first split up into
convenient groups (class interval) and the number of items
(frequency) which occur in each group is shown in adjacent
columns.
• Hence it is a table showing the frequency with which the values
are distributed in different groups or classes with some defined
characteristics
Rules for construction of frequency table
1)Arrange data set Range  class interval
should not be too large or too small
2)The number of classes to be formed more than 8
and less than 15
3)The class interval should be equal and uniform
through out the classification.
4) After construction of table, proper and clear
heading should be given to it
5)The base or source of data should be mentioned
with the pattern of analysis in footnote at the end
of table
Data For Frequency Table
 Frequency of patient’s age with heart disease, n = 30
48.3,32,51,53,40,68,62,36,32,45,51,67,53.5,
59,47,63,52,64,61,43,56,58,66,54,56,52,40,55,
71,69
Step 1; Arrange the data in ascending order.
32,32,36,40,41,42,43,45,47,48.3,51,51,52,
53,53.5,54,55,56,56,58,59,61,62,63,64,66,67,
68,69,71
Step 2; Range = X max – X min = 71 – 32 = 39
Construction of frequency table
Step 3 Class intervals: Equal, non-overlapping sets.
• Number of intervals is taken intuitively about 5 – 15
• Width of intervals can be taken according to medical
or statistical importance of the variable.
Step 4 We can calculate the number of class interval as
follows.
• Number of class intervals = range/ Width of class
interval =39/5~ 8
• No of class intervals = 8
• We take Number of intervals as ‘8’ in this example.
Class limits
age (years)
Frequency Relative
frequenc
y
Cumulative
frequency
Cumulative
relative
frequency
32 – 37 years 3 3/30 = 0.1 3 3/30 = 0.1
37 – 42 years 2 2/30 = 0.67 5 5/30 = 0.167
42 – 47 years 3 3/30 = 0.1 8 8/30 = 0.267
47 – 52 years 4 4/30 = 0.16 12 12/30 = 0.367
52 – 57 years 7 7/30 = 0.267 19 19/30 = 0.633
57 – 62 years 3 3/30 = 0.1 22 22/30 = 0.733
62 – 67 years 4 4/30 = 0.134 26 26/30 = 0.867
67 – 72 years 4 4/30 = 0.134 30 30/30 = 1.00
Frequency table
Assessment question
Age distribution of polio patients.
Data set:
0,3,7,8,6,9,4,3,2,1,0,1,10,11,12,15,17,18,20,25,23,24,21,20
,19,18,1,0,2,3,0,4,0,1,2,4,3,16,16,11,10,13,12,11,8,5,5,6,7,
8,8,6,7,9,9,5,0,17,13,14,12,13
Find;
I. Ascending order ?
II. Range?
III. Class interval number?
IV. Construct frequency table ?
V. And also calculate cumulative frequency?
Note: solve this and mail to “bashirbs589@gmail.com”
Data presenattaion  we can read this document..pptx

Data presenattaion we can read this document..pptx

  • 1.
    Data Presentation Prep by:Mr. Bashir Ullah MS Epi & biostatistics KMU_IPHSS
  • 2.
    By the endof this session, the students should be able to  Data and its types.  Know about data presentation  Know the different ways to present the data scientifically and systematically.  Types of data presentation (textual , tabular and graphical).  Uses of data presentation  Types of tables.
  • 4.
    Definition of Data •Data mean observation/ evidence ,raw facts and figures /collection of meaningful information is called data.
  • 5.
    Types of Data •To give a holistic picture of classification data can divided into two types : • Quantitative data (numerical) a) Discrete b) continuous • Qualitative data (descriptive, categorical/frequency count) a) Nominal b) Ordinal
  • 6.
    Data Presentation  Methodby which the people organize, summarize and communicate information using variety of tools such as tables, graphs and diagrams.
  • 7.
  • 8.
    Uses of datapresentation  Easy and better understanding of the subject.  Provide first hand information about data.  Helpful in future analysis .  Easy for making comparisons.  Very attractive .
  • 9.
    Data Presentation • Principlesof data presentation (a) To present the data in a simple form so as to draw the conclusion directly by viewing at the data. (b) To present the information in a compact and concise form without losing important details. (c) To arrange the data in such a way that it should create interest in the reader’s mind at the first sight. (d) To present it in such away that it can help in further statistical analysis.
  • 11.
    Tabulation  it issystematic and logical arrangement of classified data in rows and columns.
  • 12.
    Significance of tabulation simplifies complex data.  Unnecessary details and repetitions of data avoided in tabulation  Reveals pattern with in the figures which can not be seen in the narrative form  Gives identity to data  Facilitates comparison
  • 14.
    Rules for Tabulation Tablesare the devices, that are used to present the data in a simple form. It is probably the first step before the data is used for analysis or interpretation. General principles/rules of designing tables : a) The tables should be numbered e.g. table 1, table 2 etc. b) A title must be given to each table, which should be brief and self explanatory. c) The headings of columns or rows (subtitles) should be clear and concise. d)Group interval in column and rows should neither be too narrow nor too wide. e) The data must be presented according to size or importance chronologically, alphabetically, or geographically. f) If percentages or averages are to be compared, they should be placed as close as possible.
  • 15.
    g) Unit ofmeasurement must be mentioned clearly where ever necessary. h) Any short form/symbols, if used should be explained in the footnote. OR Foot notes may be given, where necessary, providing explanatory notes or additional information. i) No table should be too large. j) Most of the people find a vertical arrangement better than a horizontal one because, it is easier to scan the data from top to bottom than from left to right Rules for Tabulation
  • 17.
    Types of tables 1)Simple tables :Measurements of single set are presented 2) Complex tables :Measurements of multiple sets are presented
  • 19.
    Frequency distribution table •In the frequency distribution table, the data is first split up into convenient groups (class interval) and the number of items (frequency) which occur in each group is shown in adjacent columns. • Hence it is a table showing the frequency with which the values are distributed in different groups or classes with some defined characteristics
  • 20.
    Rules for constructionof frequency table 1)Arrange data set Range  class interval should not be too large or too small 2)The number of classes to be formed more than 8 and less than 15 3)The class interval should be equal and uniform through out the classification. 4) After construction of table, proper and clear heading should be given to it 5)The base or source of data should be mentioned with the pattern of analysis in footnote at the end of table
  • 21.
    Data For FrequencyTable  Frequency of patient’s age with heart disease, n = 30 48.3,32,51,53,40,68,62,36,32,45,51,67,53.5, 59,47,63,52,64,61,43,56,58,66,54,56,52,40,55, 71,69 Step 1; Arrange the data in ascending order. 32,32,36,40,41,42,43,45,47,48.3,51,51,52, 53,53.5,54,55,56,56,58,59,61,62,63,64,66,67, 68,69,71 Step 2; Range = X max – X min = 71 – 32 = 39
  • 22.
    Construction of frequencytable Step 3 Class intervals: Equal, non-overlapping sets. • Number of intervals is taken intuitively about 5 – 15 • Width of intervals can be taken according to medical or statistical importance of the variable. Step 4 We can calculate the number of class interval as follows. • Number of class intervals = range/ Width of class interval =39/5~ 8 • No of class intervals = 8 • We take Number of intervals as ‘8’ in this example.
  • 23.
    Class limits age (years) FrequencyRelative frequenc y Cumulative frequency Cumulative relative frequency 32 – 37 years 3 3/30 = 0.1 3 3/30 = 0.1 37 – 42 years 2 2/30 = 0.67 5 5/30 = 0.167 42 – 47 years 3 3/30 = 0.1 8 8/30 = 0.267 47 – 52 years 4 4/30 = 0.16 12 12/30 = 0.367 52 – 57 years 7 7/30 = 0.267 19 19/30 = 0.633 57 – 62 years 3 3/30 = 0.1 22 22/30 = 0.733 62 – 67 years 4 4/30 = 0.134 26 26/30 = 0.867 67 – 72 years 4 4/30 = 0.134 30 30/30 = 1.00 Frequency table
  • 24.
    Assessment question Age distributionof polio patients. Data set: 0,3,7,8,6,9,4,3,2,1,0,1,10,11,12,15,17,18,20,25,23,24,21,20 ,19,18,1,0,2,3,0,4,0,1,2,4,3,16,16,11,10,13,12,11,8,5,5,6,7, 8,8,6,7,9,9,5,0,17,13,14,12,13 Find; I. Ascending order ? II. Range? III. Class interval number? IV. Construct frequency table ? V. And also calculate cumulative frequency? Note: solve this and mail to “bashirbs589@gmail.com”