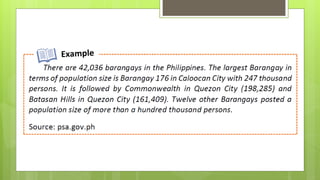
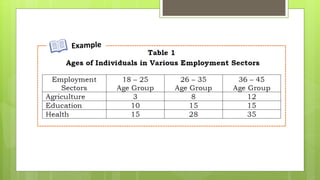
Data Presentation and
Interpretation in
Tabular & Graphical
Forms
Rellie D. Castro, RN, LPT
Introduction
 Data processing is a fundamental step done in
analyzing gathered data in study.
 In research, data is manipulated to produce results that
lead to answers to specific problems for the
improvement of an existing situation.
 The data may be presented through diagram, graph
(line, bar, pie, etc.), table or figure.
Data Processing
 It is important to process the data collected carefully.
 The essence of data processing in research is data
reduction.
 Data reduction involves winnowing out the irrelevant
from the relevant data and establishing order from chaos
and giving shape to a mass of data.
Methods of Data Processing
 Data Processing is concerned with;
 editing,
 classifying,
 tabulating and charting,
 diagramming of research data.
Editing of Data
 Editing is the process of examining the data
collected to detect errors and omissions and to
see that they are corrected, and ready for
tabulation.
 The researcher must see to it that data are
accurate, relevant, consistent, complete, and
acceptable.
Classification of Data
 Data must be classified or categorized in the
statistical data under various understandable
homogeneous groups for the purpose of
convenient interpretation.
 A uniformity of attributes is the basic criterion for
classification; and the grouping of data is made
according to similarity.
Tabulation of Data
 Tabulation is the process of summarizing raw
data and displaying it in compact form for
further analysis.
 Therefore, preparing tables is a very important
step.
Tabulation of Data
A. Title of Table. The table should be first given a brief,
simple, and clear title which may express the basis of
classification based on the purpose of the study.
B. Columns and Rows. Each table should be prepared in
just adequate number of columns and rows.
C. Captions. The columns and rows should be given simple
and clear captions so the ordinary reader can understand
the data.
Tabulation of Data
D. Unit of measurement. The unit should be noted
below the lines.
E. Footnotes. this may be given below the table.
F. Total. totals of each column and grand total
should be in one line.
Data Interpretation
 After gathering the data, they must be tabulated
and computed so the researcher can analyze and
interpret the result.
 Research interpretation is defined as adequate
exposition of the true meaning of the material
presented in terms of the purpose of the study
Data Interpretation
 Results in discussions should be systematic,
logical, and comprehensive.
 The decision should blend the findings in relation
to those identified in the literature review and
placed within the context of the theoretical
framework underpinning the study.
Example:
Sample Interpretation:
The table presents Certain reasons why teacher want to change shift
career. As gleaned from the data, 20% of the teacher – respondents admits
that oftentimes teacher salaries are not released on time hence they are
prompted to borrow a certain amount of money from the loan sharks with
a sizable amount of interest rate. As revealed by the respondents, the
teacher’s salary is not so high. married ones expressed that sometimes they
experience sending promissory notes to the school of their children for the
permission to take major examination. Further during the interview, 19%
noted that they have little opportunity for promotion. 15% of the teacher
respondents are not motivated to teach because of the low salary and not
enough instructional materials in the classroom. trainings are available but
14% of the respondents assert that the training is not offered to all of them.
In addition, 13% revealed that the environment is not conductive for
learning.
Presentation of Data
 To be able to create and present an organized picture
of information from a research report, it is important to
use certain techniques to communicate findings and
interpretations of research studies into visual forms.
 The common techniques being used to display data
results are tabular, textual, and graphical methods.
A. Textual Presentation of Data
 Textual presentations use words, statements or paragraphs
with numerals, numbers, or measurements to describe
data.
 They can be used independently to describe the data when
there are very few quantities or numbers.
 They can also be used to compare data using paragraphs
for the discussion.
B. Tabular Presentation of Data
 Tables present clear and organized data. A table must be
clear and simple but complete. A good table should include
the following parts:
 Table Number and Title – These are placed above the table.
The title is usually written right after the table number.
 Caption Subhead – This refers to columns and rows.
 Body – It contains all the data under each subhead.
 Source – It indicates if the data is secondary and it should be
acknowledged.
Tabular Presentation with Textual
Analysis
 Tabular Presentation with Textual Analysis has
similar parts to the Tabular Presentation of
Data, but it has a textual analysis below the
table.
C. Graphical Methods of
Presenting Data
 A graph or chart portrays the visual
presentation of data using symbols such as
lines, dots, bars, or slices.
 It depicts a certain set of measurements or
shows comparison between two or more sets
of data or quantities.
C. Graphical Methods of
Presenting Data
 Charts and graphs are very useful in
simplifying the presentation of research
reports.
 It helps researchers and readers understand
data quickly and interestingly.
C. Graphical Methods of
Presenting Data
 A good graph or chart shows that the X and Y
axis has a heading and units are included.
 The figure number and title are usually placed
below the figure.
 The known value is plotted on the X-axis and the
measured value is plotted on the Y-axis.
Line Graph
 A line graph is a graphical presentation of data
that shows a continuous change or trend it
may show ascending or descending trend.
Double Line Graph
 A double line graph has two lines connecting
points to show continuous change in the data
overtime.
 Like a single line graph, the lines can ascend
or descend in a double line graph.
Bar Graph or Bar Chart
 A bar graph uses bars to compare categories
of data. It may be drawn vertically or
horizontally.
 A vertical bar graph is best to use when
comparing means or percentage between
distinct categories.
Pictographs
 A pictogram is a special type of bar graph. Instead of
using an axis with numbers, it uses pictures / icons to
represent a number of items.
 The use of icons can sometimes help overcome
differences in language, culture, and education. Icons
can also give a more representational view of the data.
Pie Charts or Circle Graphs
 A pie chart is usually used to show how parts
of a whole compared to each other and to the
whole.
 The entire circle represents the total, and the
parts are proportional to the amount of the
total they represent.
Pie Charts or Circle Graphs
 The amount going to each part is expressed
as a percentage; then, a circle is divided into
pieces proportional to the percentage of each
category.
 It is done by multiplying the percentage share
by 360 degrees.
THANK YOU

Data-Presentation-and-Interpretation-in-Tabular-Graphical.pptx

  • 1.
    Data Presentation and Interpretationin Tabular & Graphical Forms Rellie D. Castro, RN, LPT
  • 2.
    Introduction  Data processingis a fundamental step done in analyzing gathered data in study.  In research, data is manipulated to produce results that lead to answers to specific problems for the improvement of an existing situation.  The data may be presented through diagram, graph (line, bar, pie, etc.), table or figure.
  • 3.
    Data Processing  Itis important to process the data collected carefully.  The essence of data processing in research is data reduction.  Data reduction involves winnowing out the irrelevant from the relevant data and establishing order from chaos and giving shape to a mass of data.
  • 4.
    Methods of DataProcessing  Data Processing is concerned with;  editing,  classifying,  tabulating and charting,  diagramming of research data.
  • 5.
    Editing of Data Editing is the process of examining the data collected to detect errors and omissions and to see that they are corrected, and ready for tabulation.  The researcher must see to it that data are accurate, relevant, consistent, complete, and acceptable.
  • 6.
    Classification of Data Data must be classified or categorized in the statistical data under various understandable homogeneous groups for the purpose of convenient interpretation.  A uniformity of attributes is the basic criterion for classification; and the grouping of data is made according to similarity.
  • 7.
    Tabulation of Data Tabulation is the process of summarizing raw data and displaying it in compact form for further analysis.  Therefore, preparing tables is a very important step.
  • 8.
    Tabulation of Data A.Title of Table. The table should be first given a brief, simple, and clear title which may express the basis of classification based on the purpose of the study. B. Columns and Rows. Each table should be prepared in just adequate number of columns and rows. C. Captions. The columns and rows should be given simple and clear captions so the ordinary reader can understand the data.
  • 9.
    Tabulation of Data D.Unit of measurement. The unit should be noted below the lines. E. Footnotes. this may be given below the table. F. Total. totals of each column and grand total should be in one line.
  • 11.
    Data Interpretation  Aftergathering the data, they must be tabulated and computed so the researcher can analyze and interpret the result.  Research interpretation is defined as adequate exposition of the true meaning of the material presented in terms of the purpose of the study
  • 12.
    Data Interpretation  Resultsin discussions should be systematic, logical, and comprehensive.  The decision should blend the findings in relation to those identified in the literature review and placed within the context of the theoretical framework underpinning the study.
  • 13.
  • 14.
    Sample Interpretation: The tablepresents Certain reasons why teacher want to change shift career. As gleaned from the data, 20% of the teacher – respondents admits that oftentimes teacher salaries are not released on time hence they are prompted to borrow a certain amount of money from the loan sharks with a sizable amount of interest rate. As revealed by the respondents, the teacher’s salary is not so high. married ones expressed that sometimes they experience sending promissory notes to the school of their children for the permission to take major examination. Further during the interview, 19% noted that they have little opportunity for promotion. 15% of the teacher respondents are not motivated to teach because of the low salary and not enough instructional materials in the classroom. trainings are available but 14% of the respondents assert that the training is not offered to all of them. In addition, 13% revealed that the environment is not conductive for learning.
  • 15.
    Presentation of Data To be able to create and present an organized picture of information from a research report, it is important to use certain techniques to communicate findings and interpretations of research studies into visual forms.  The common techniques being used to display data results are tabular, textual, and graphical methods.
  • 16.
    A. Textual Presentationof Data  Textual presentations use words, statements or paragraphs with numerals, numbers, or measurements to describe data.  They can be used independently to describe the data when there are very few quantities or numbers.  They can also be used to compare data using paragraphs for the discussion.
  • 18.
    B. Tabular Presentationof Data  Tables present clear and organized data. A table must be clear and simple but complete. A good table should include the following parts:  Table Number and Title – These are placed above the table. The title is usually written right after the table number.  Caption Subhead – This refers to columns and rows.  Body – It contains all the data under each subhead.  Source – It indicates if the data is secondary and it should be acknowledged.
  • 20.
    Tabular Presentation withTextual Analysis  Tabular Presentation with Textual Analysis has similar parts to the Tabular Presentation of Data, but it has a textual analysis below the table.
  • 22.
    C. Graphical Methodsof Presenting Data  A graph or chart portrays the visual presentation of data using symbols such as lines, dots, bars, or slices.  It depicts a certain set of measurements or shows comparison between two or more sets of data or quantities.
  • 23.
    C. Graphical Methodsof Presenting Data  Charts and graphs are very useful in simplifying the presentation of research reports.  It helps researchers and readers understand data quickly and interestingly.
  • 24.
    C. Graphical Methodsof Presenting Data  A good graph or chart shows that the X and Y axis has a heading and units are included.  The figure number and title are usually placed below the figure.  The known value is plotted on the X-axis and the measured value is plotted on the Y-axis.
  • 25.
    Line Graph  Aline graph is a graphical presentation of data that shows a continuous change or trend it may show ascending or descending trend.
  • 27.
    Double Line Graph A double line graph has two lines connecting points to show continuous change in the data overtime.  Like a single line graph, the lines can ascend or descend in a double line graph.
  • 29.
    Bar Graph orBar Chart  A bar graph uses bars to compare categories of data. It may be drawn vertically or horizontally.  A vertical bar graph is best to use when comparing means or percentage between distinct categories.
  • 32.
    Pictographs  A pictogramis a special type of bar graph. Instead of using an axis with numbers, it uses pictures / icons to represent a number of items.  The use of icons can sometimes help overcome differences in language, culture, and education. Icons can also give a more representational view of the data.
  • 34.
    Pie Charts orCircle Graphs  A pie chart is usually used to show how parts of a whole compared to each other and to the whole.  The entire circle represents the total, and the parts are proportional to the amount of the total they represent.
  • 35.
    Pie Charts orCircle Graphs  The amount going to each part is expressed as a percentage; then, a circle is divided into pieces proportional to the percentage of each category.  It is done by multiplying the percentage share by 360 degrees.
  • 37.