Downloaded 100 times


This document provides guidance on writing the results and discussion chapters for quantitative research theses. It discusses the structure and style of these chapters, including how to present tables and figures, summarize results, and compare findings to previous research. Examples are given from published theses. Resources for thesis writing are also listed, such as referencing guides, counseling services, and online phrasebooks.
Introduces the results and discussion chapters for quantitative research, contains contents.
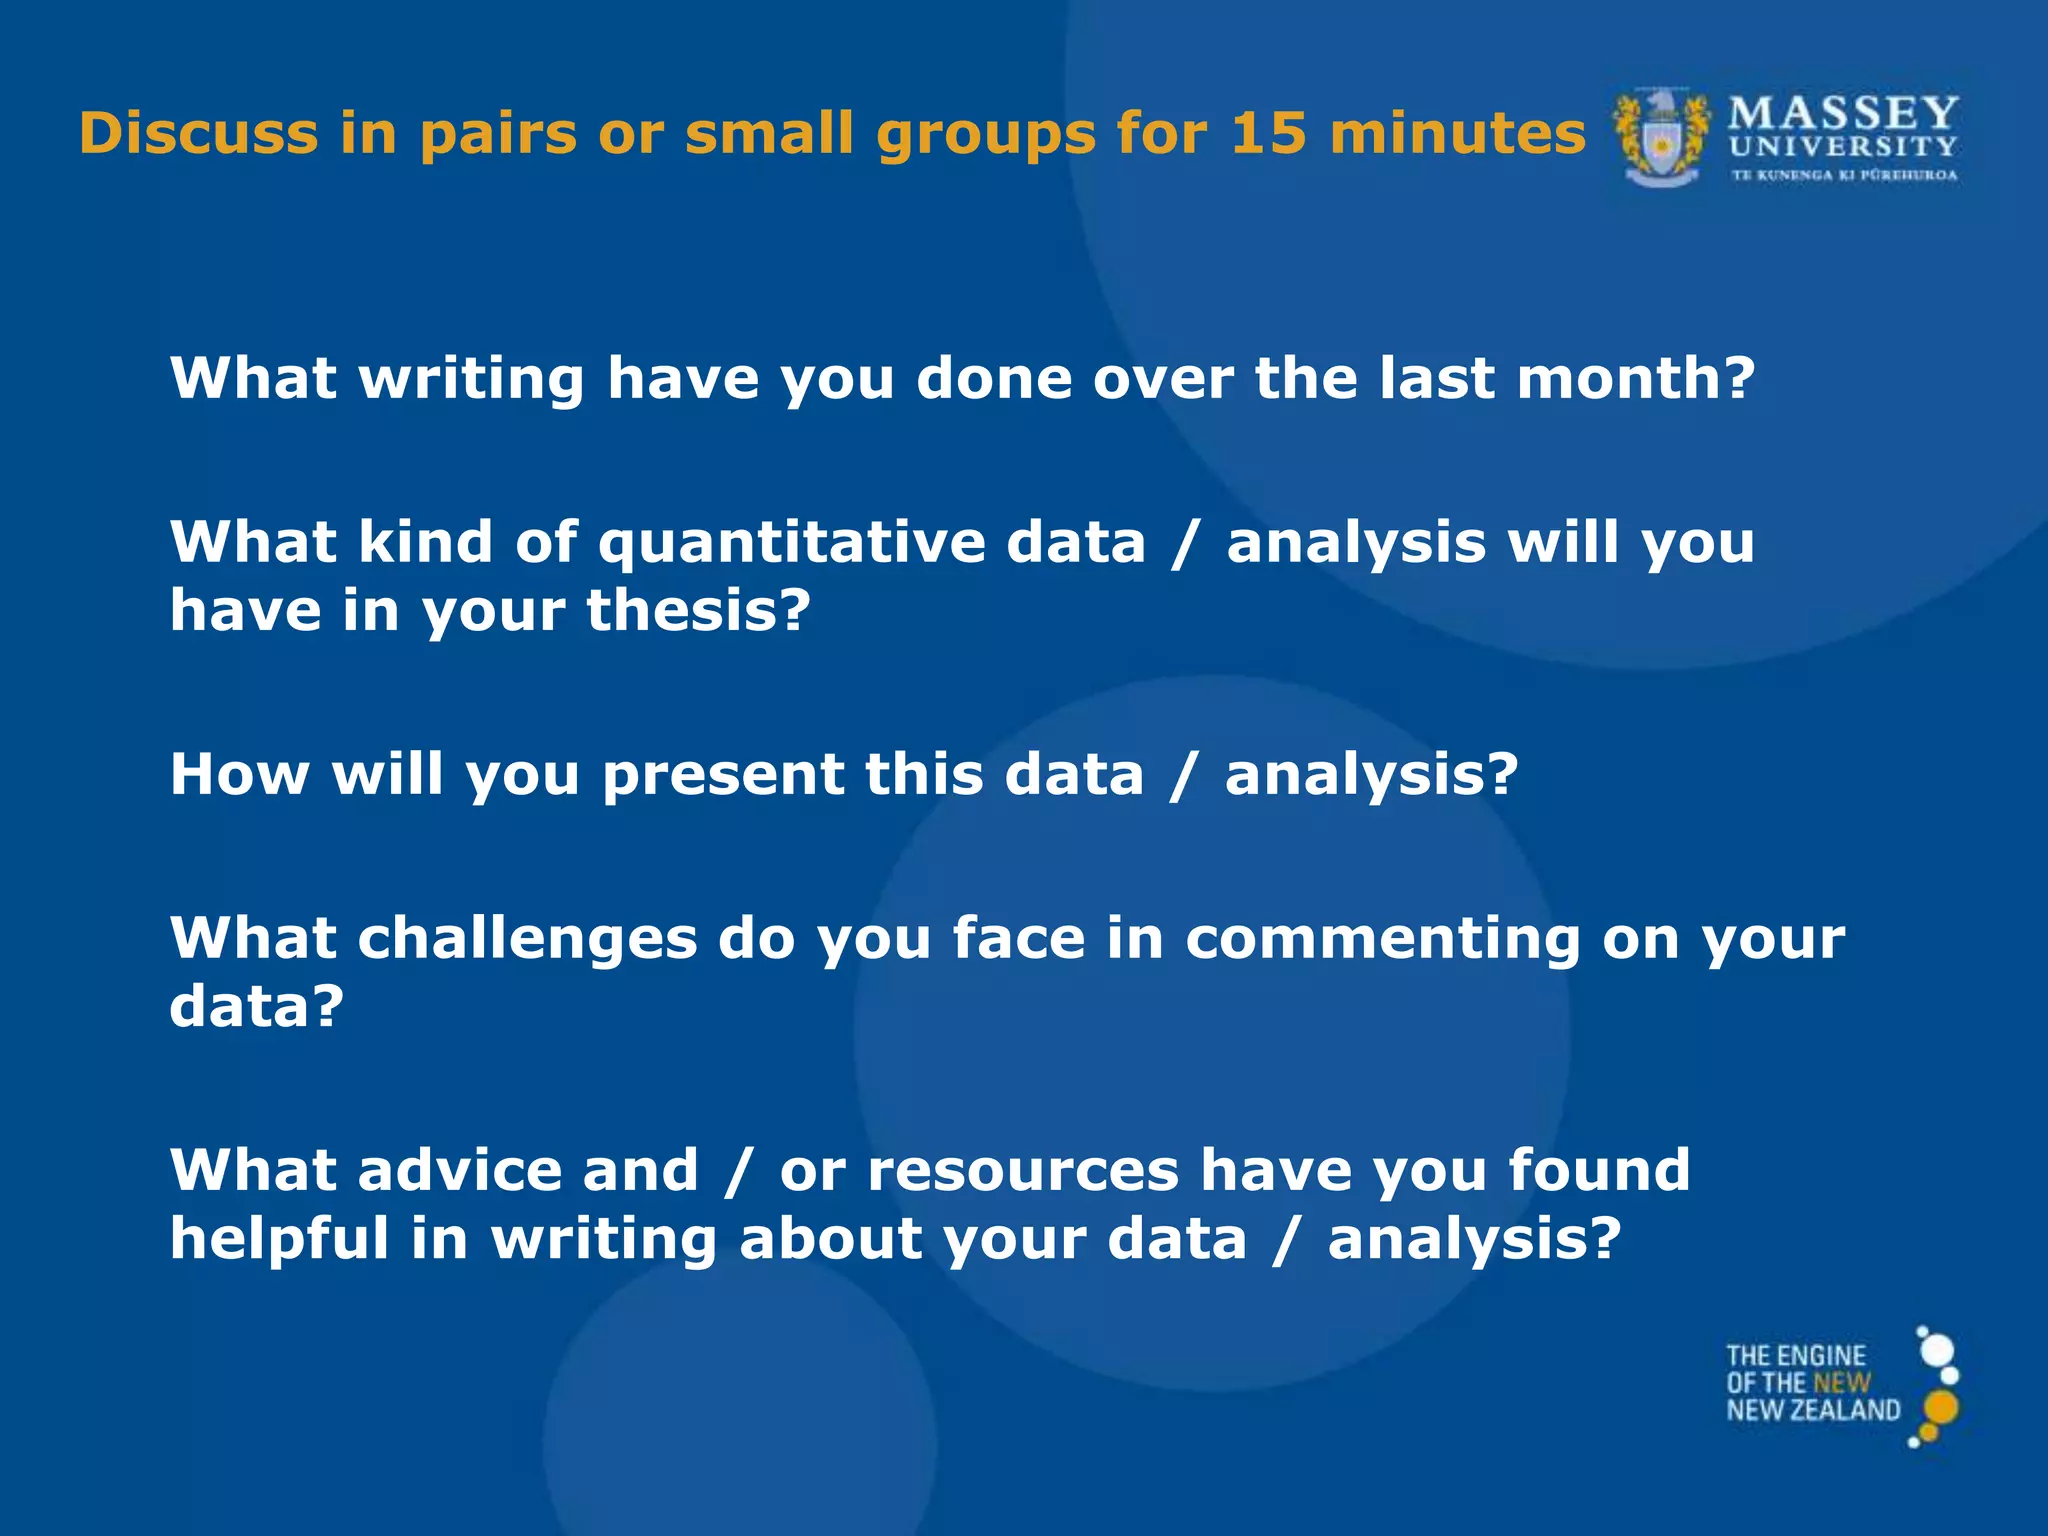
Focuses on writing introductions, encourages discussion on past writing and data challenges.
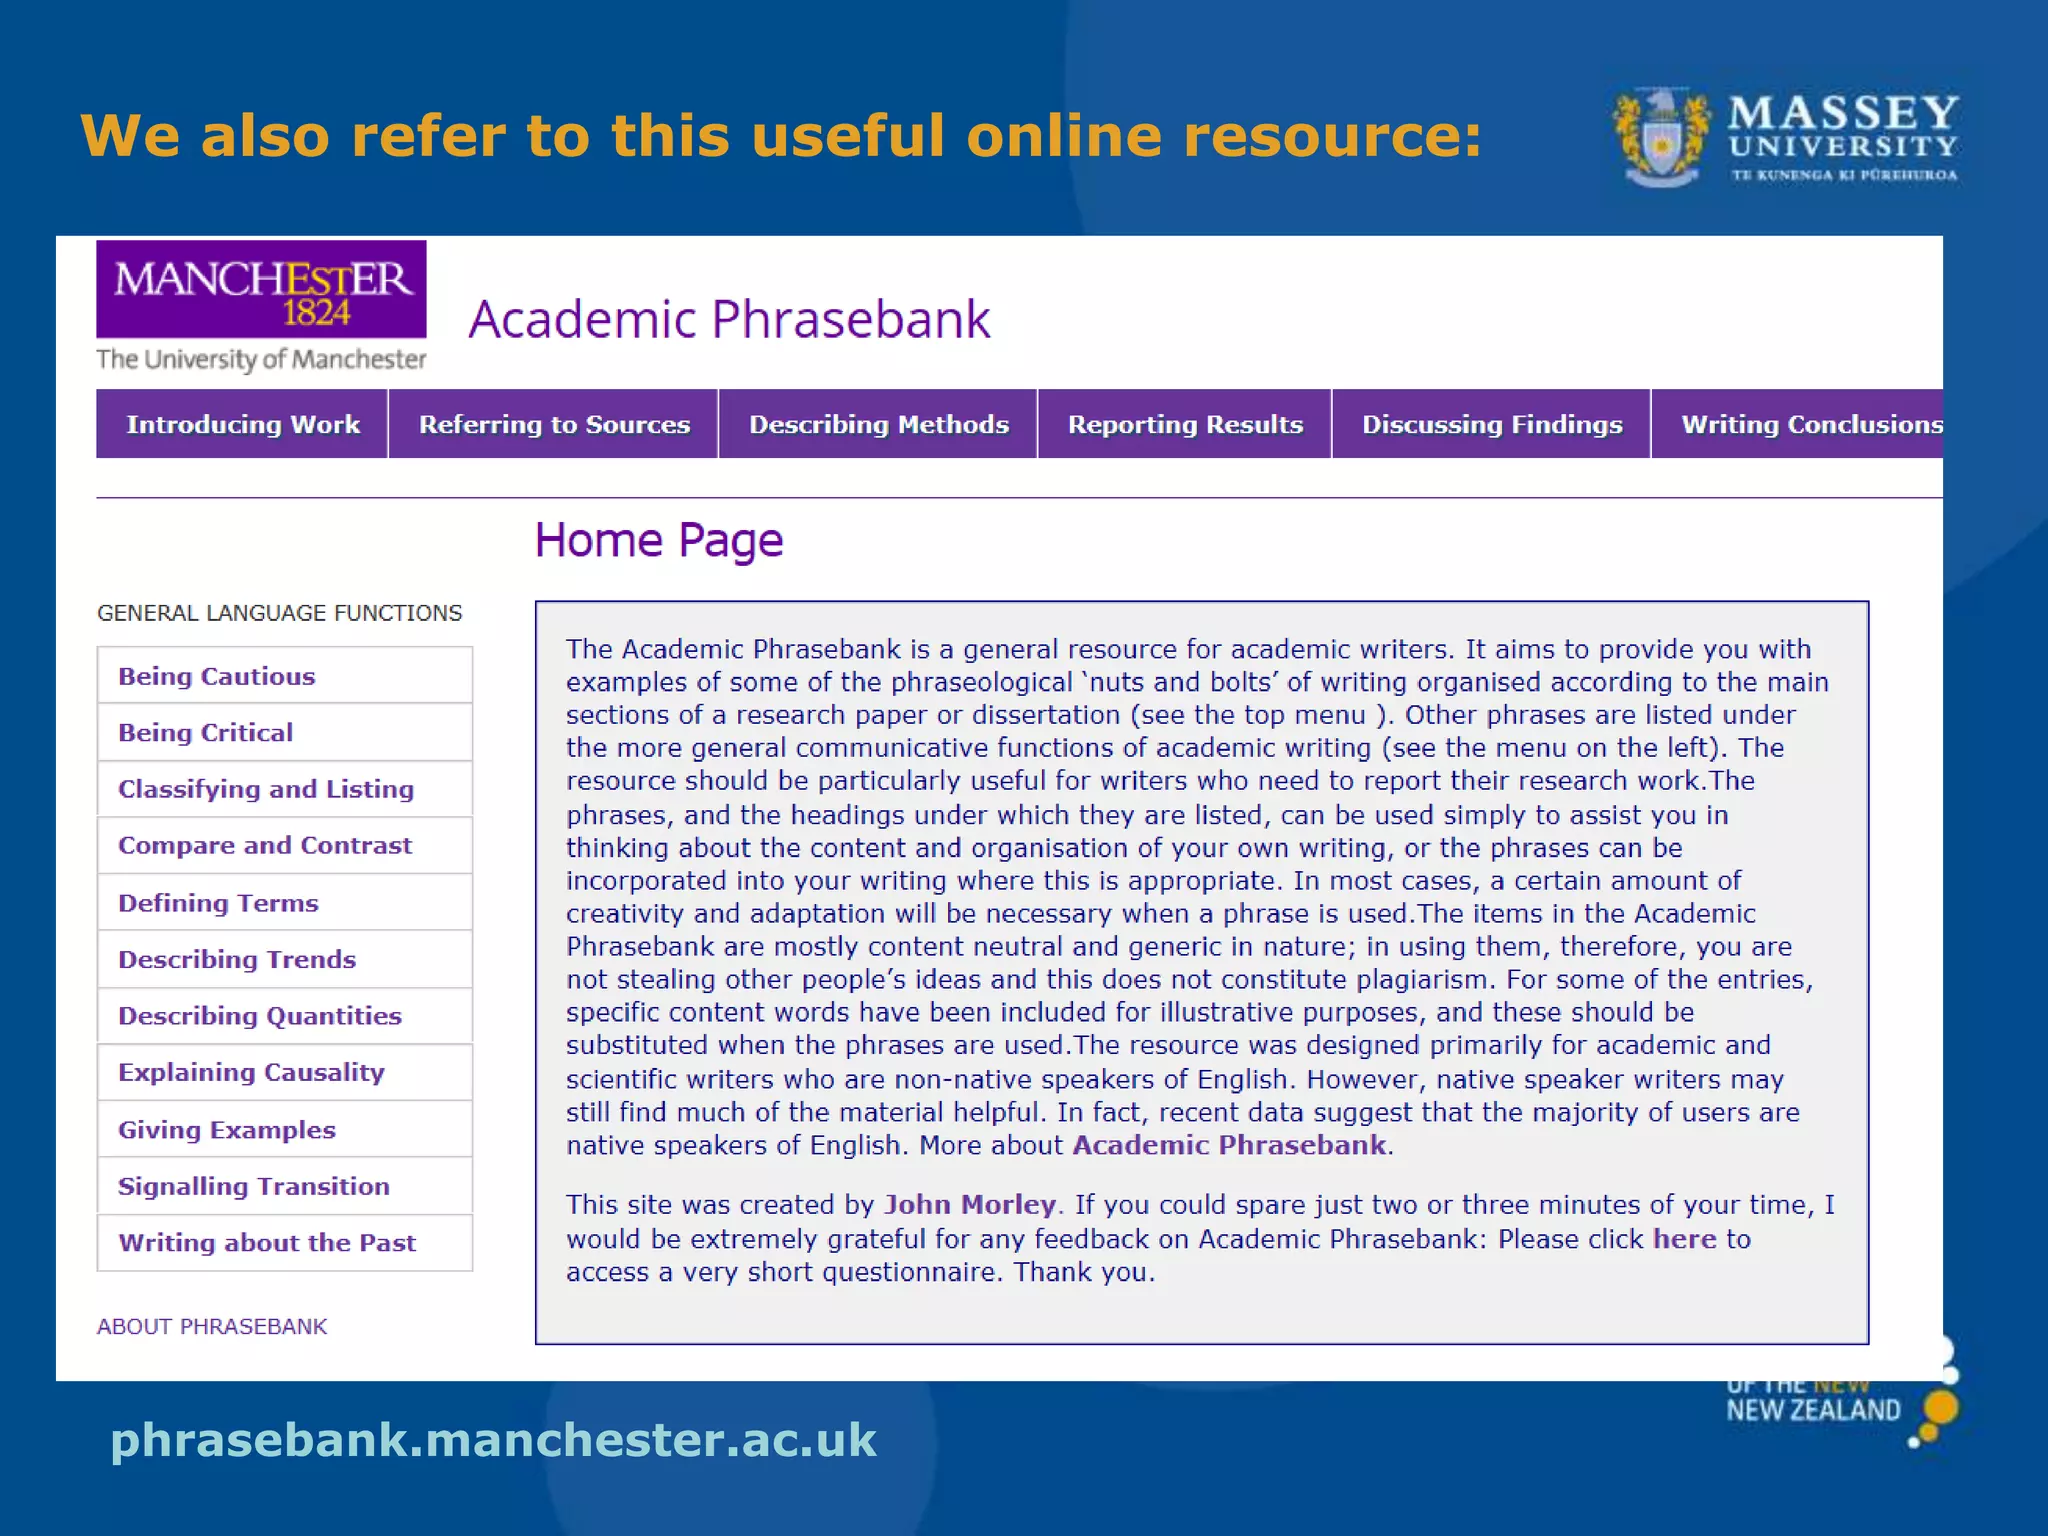
Acknowledges four doctoral theses and refers to an online phrasebank for academic writing support.
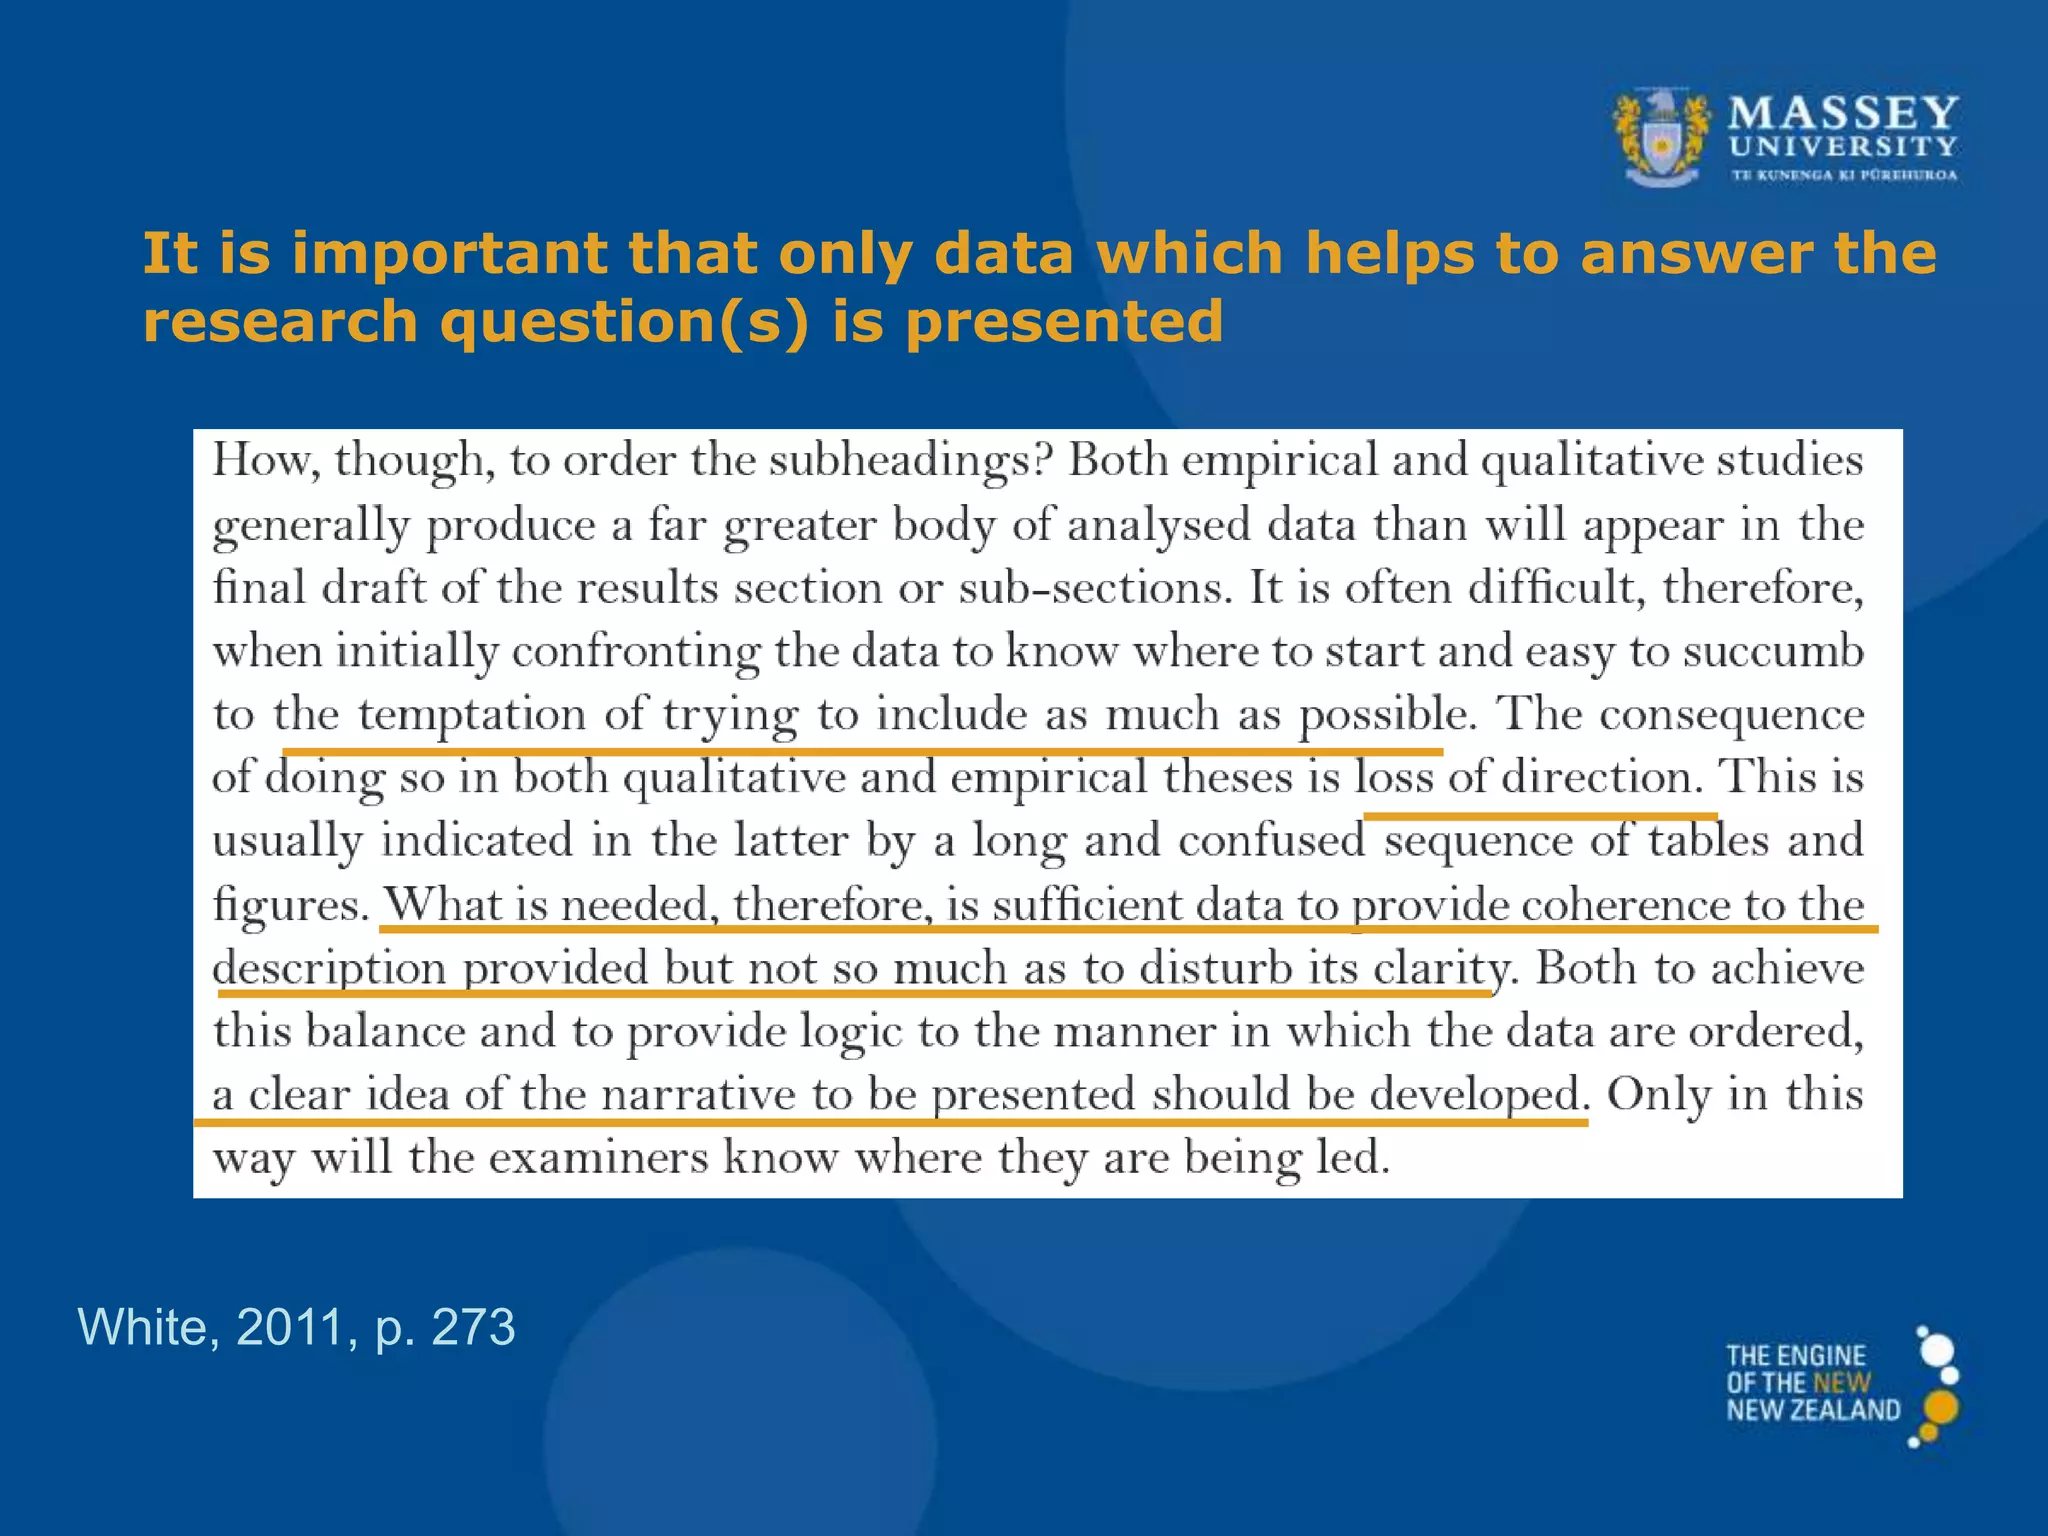
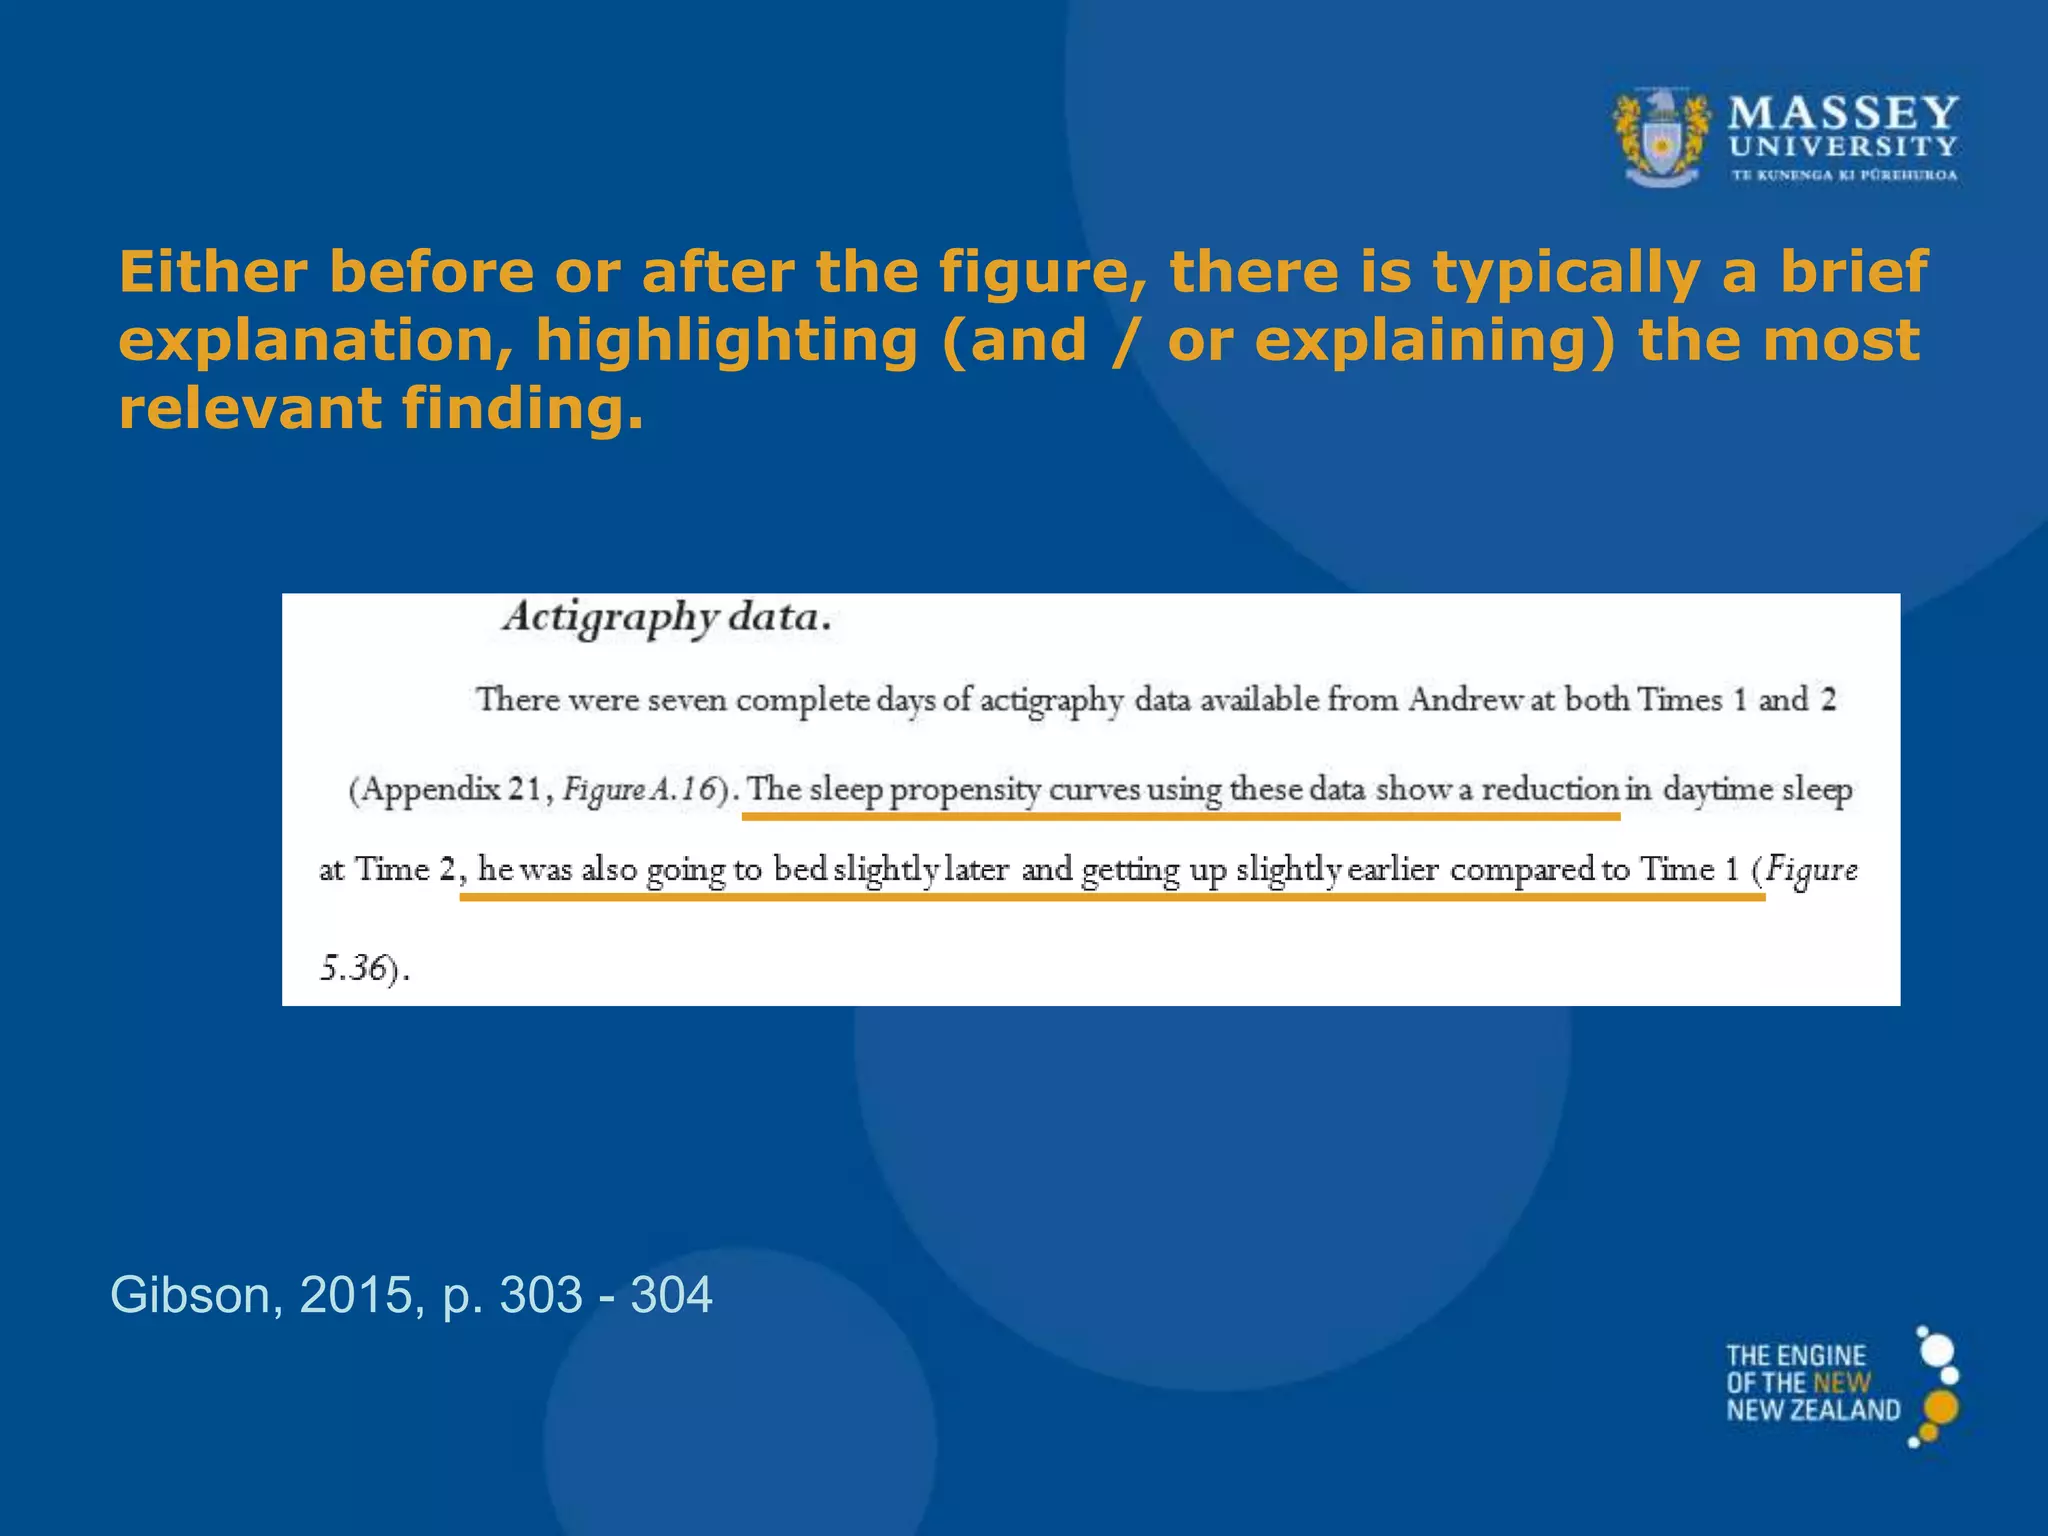
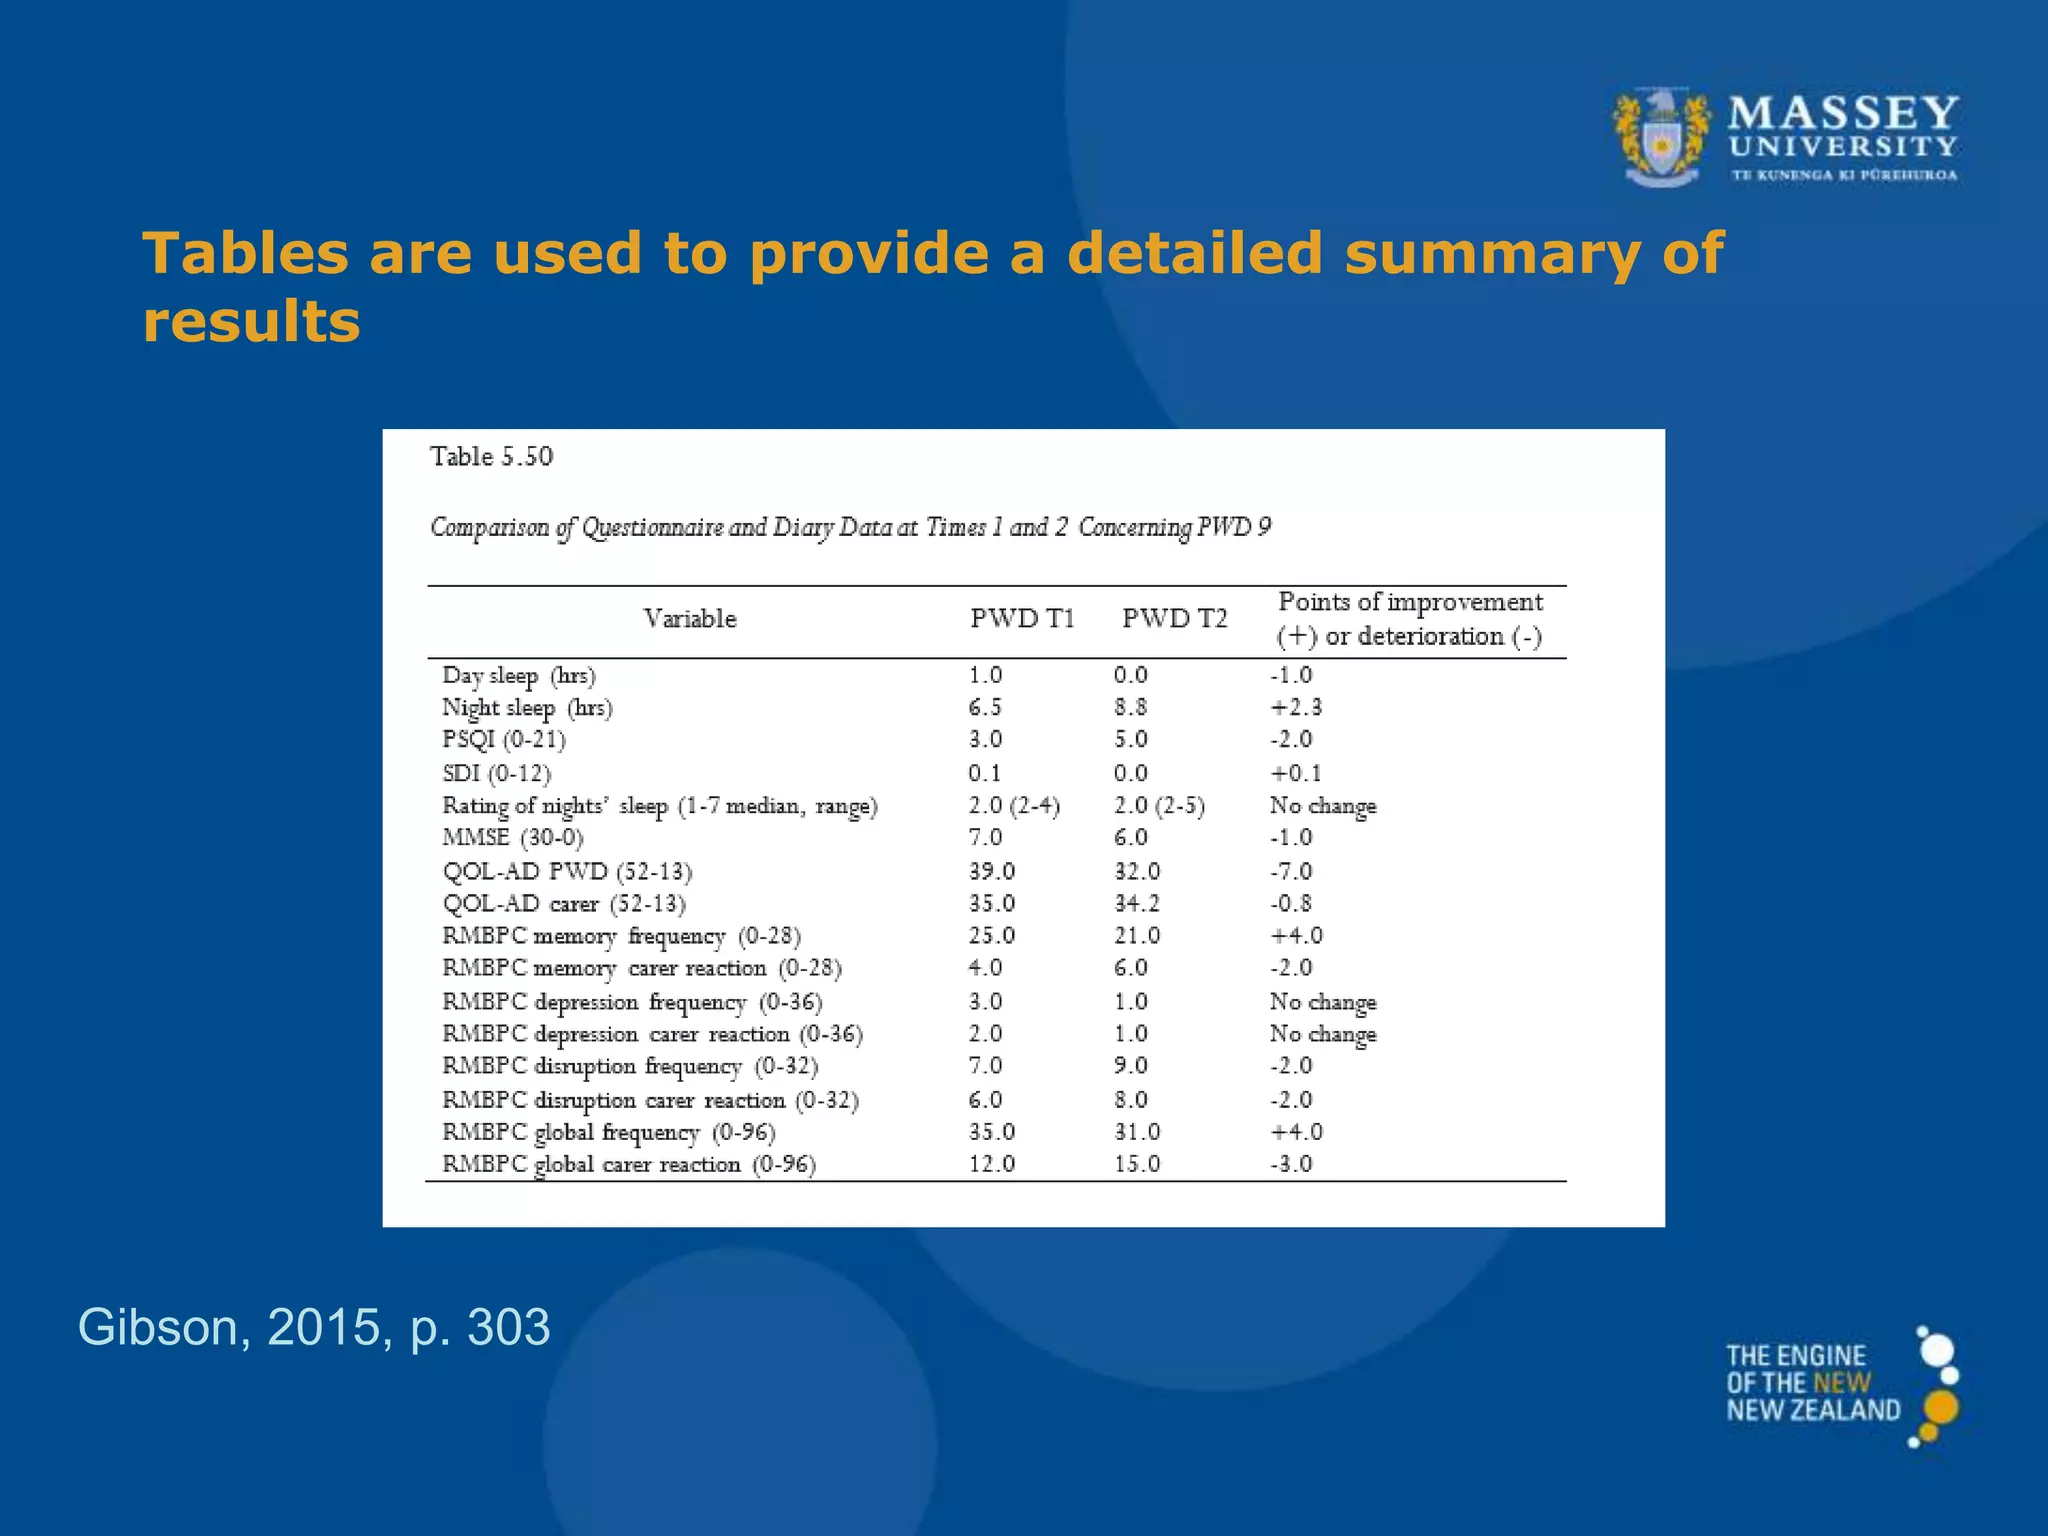
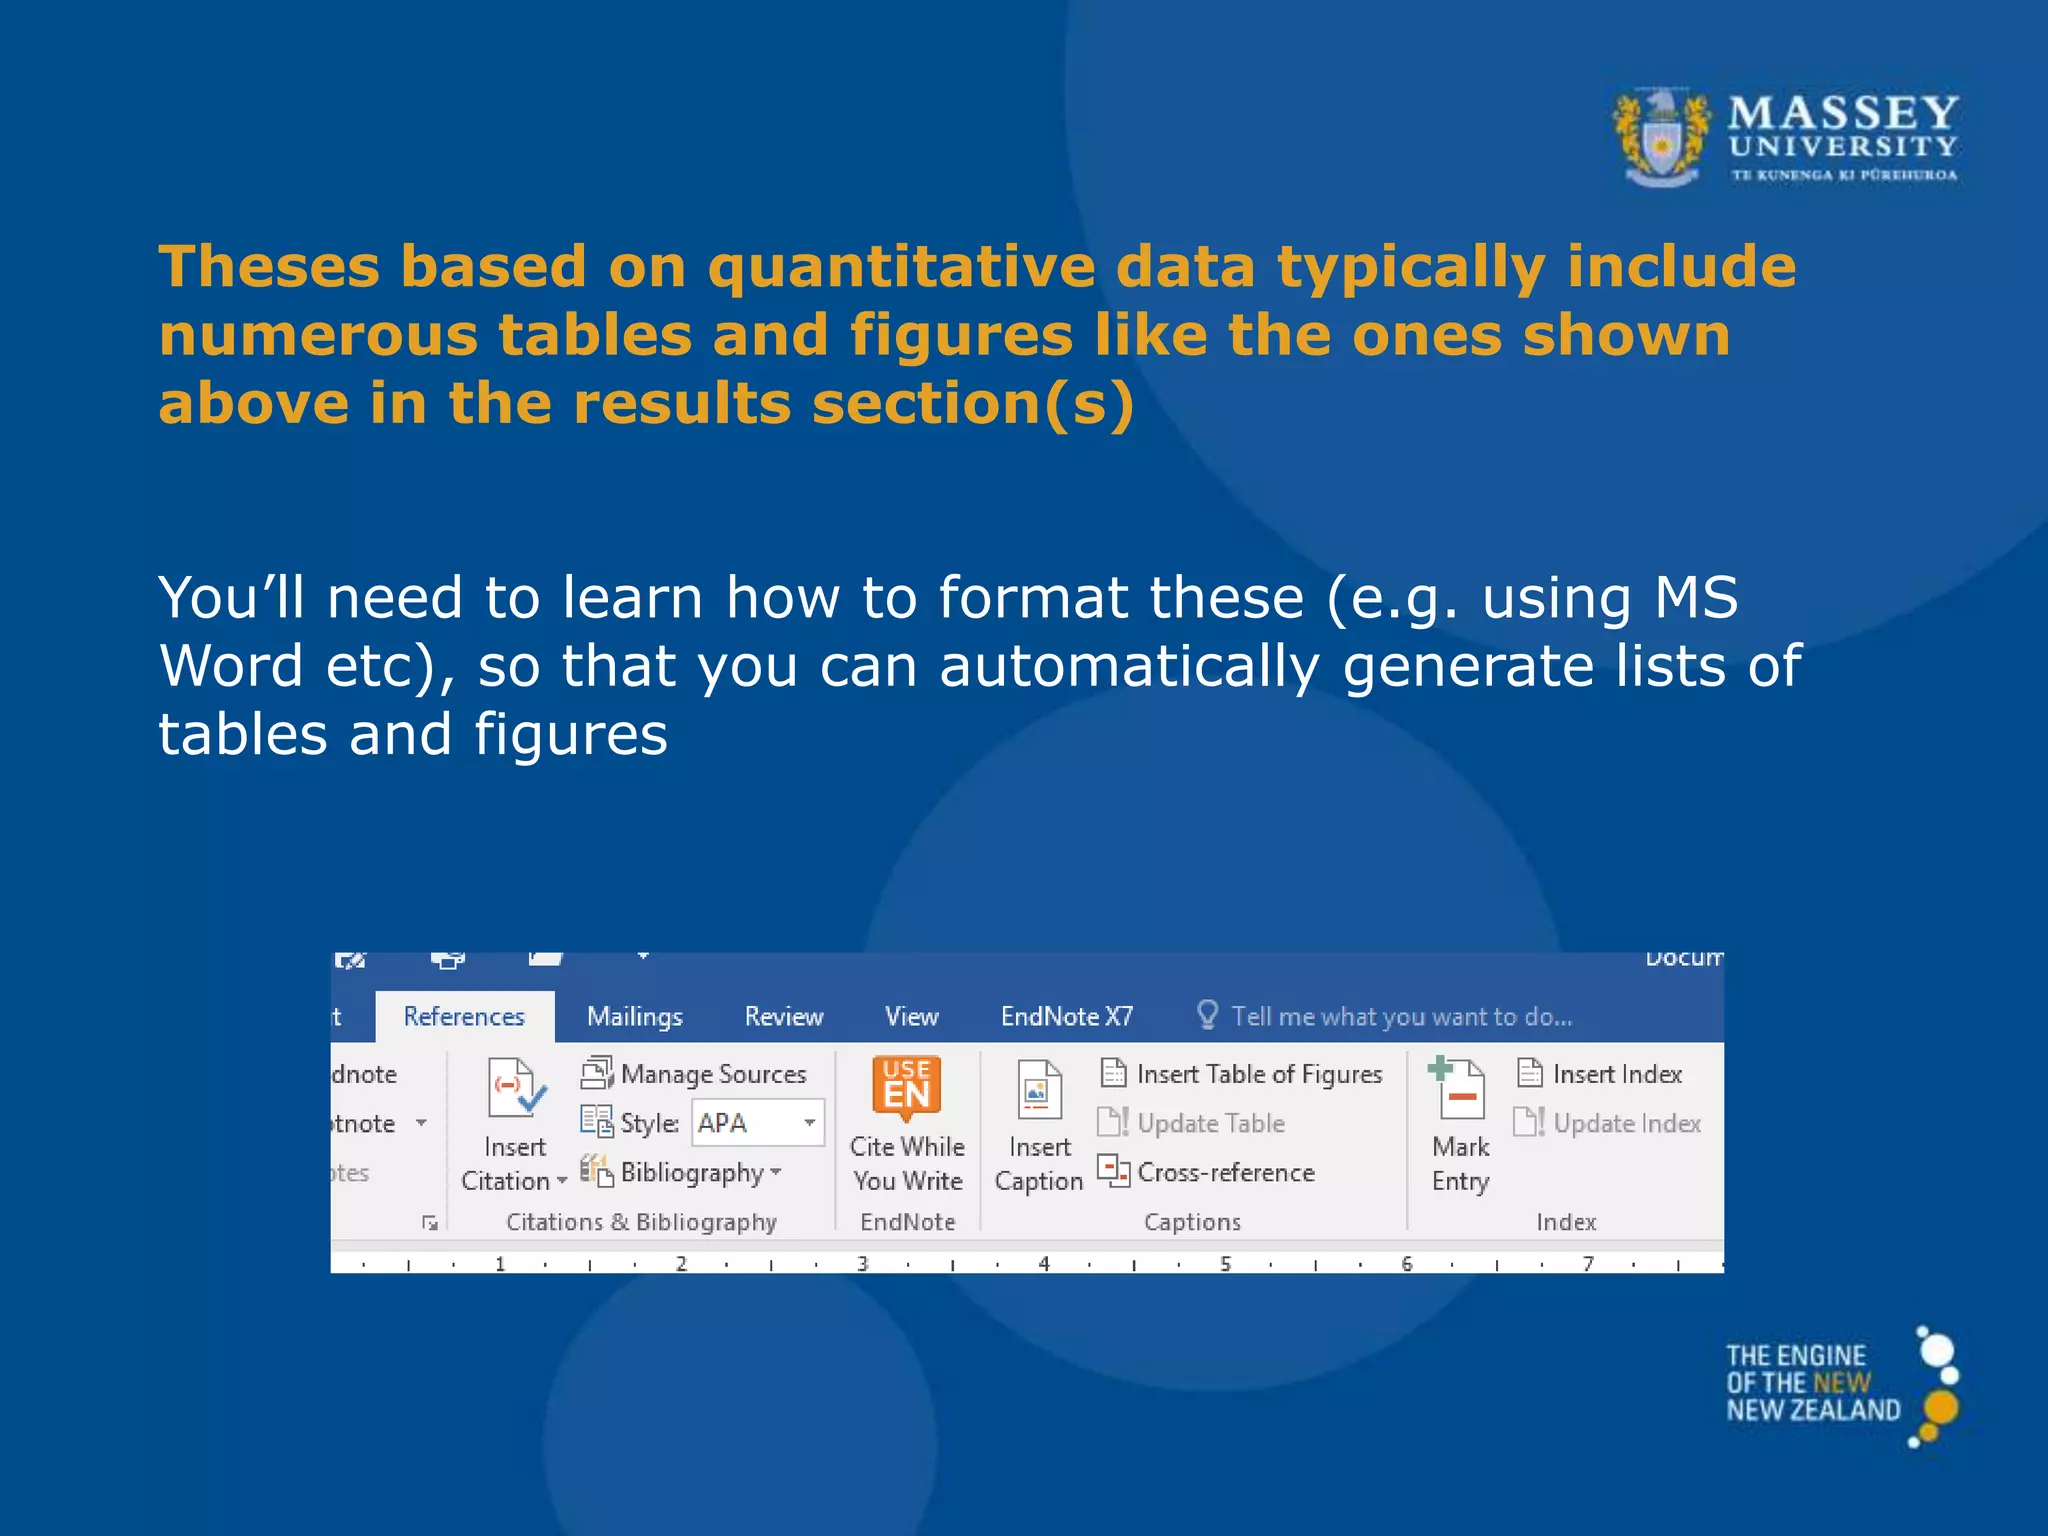
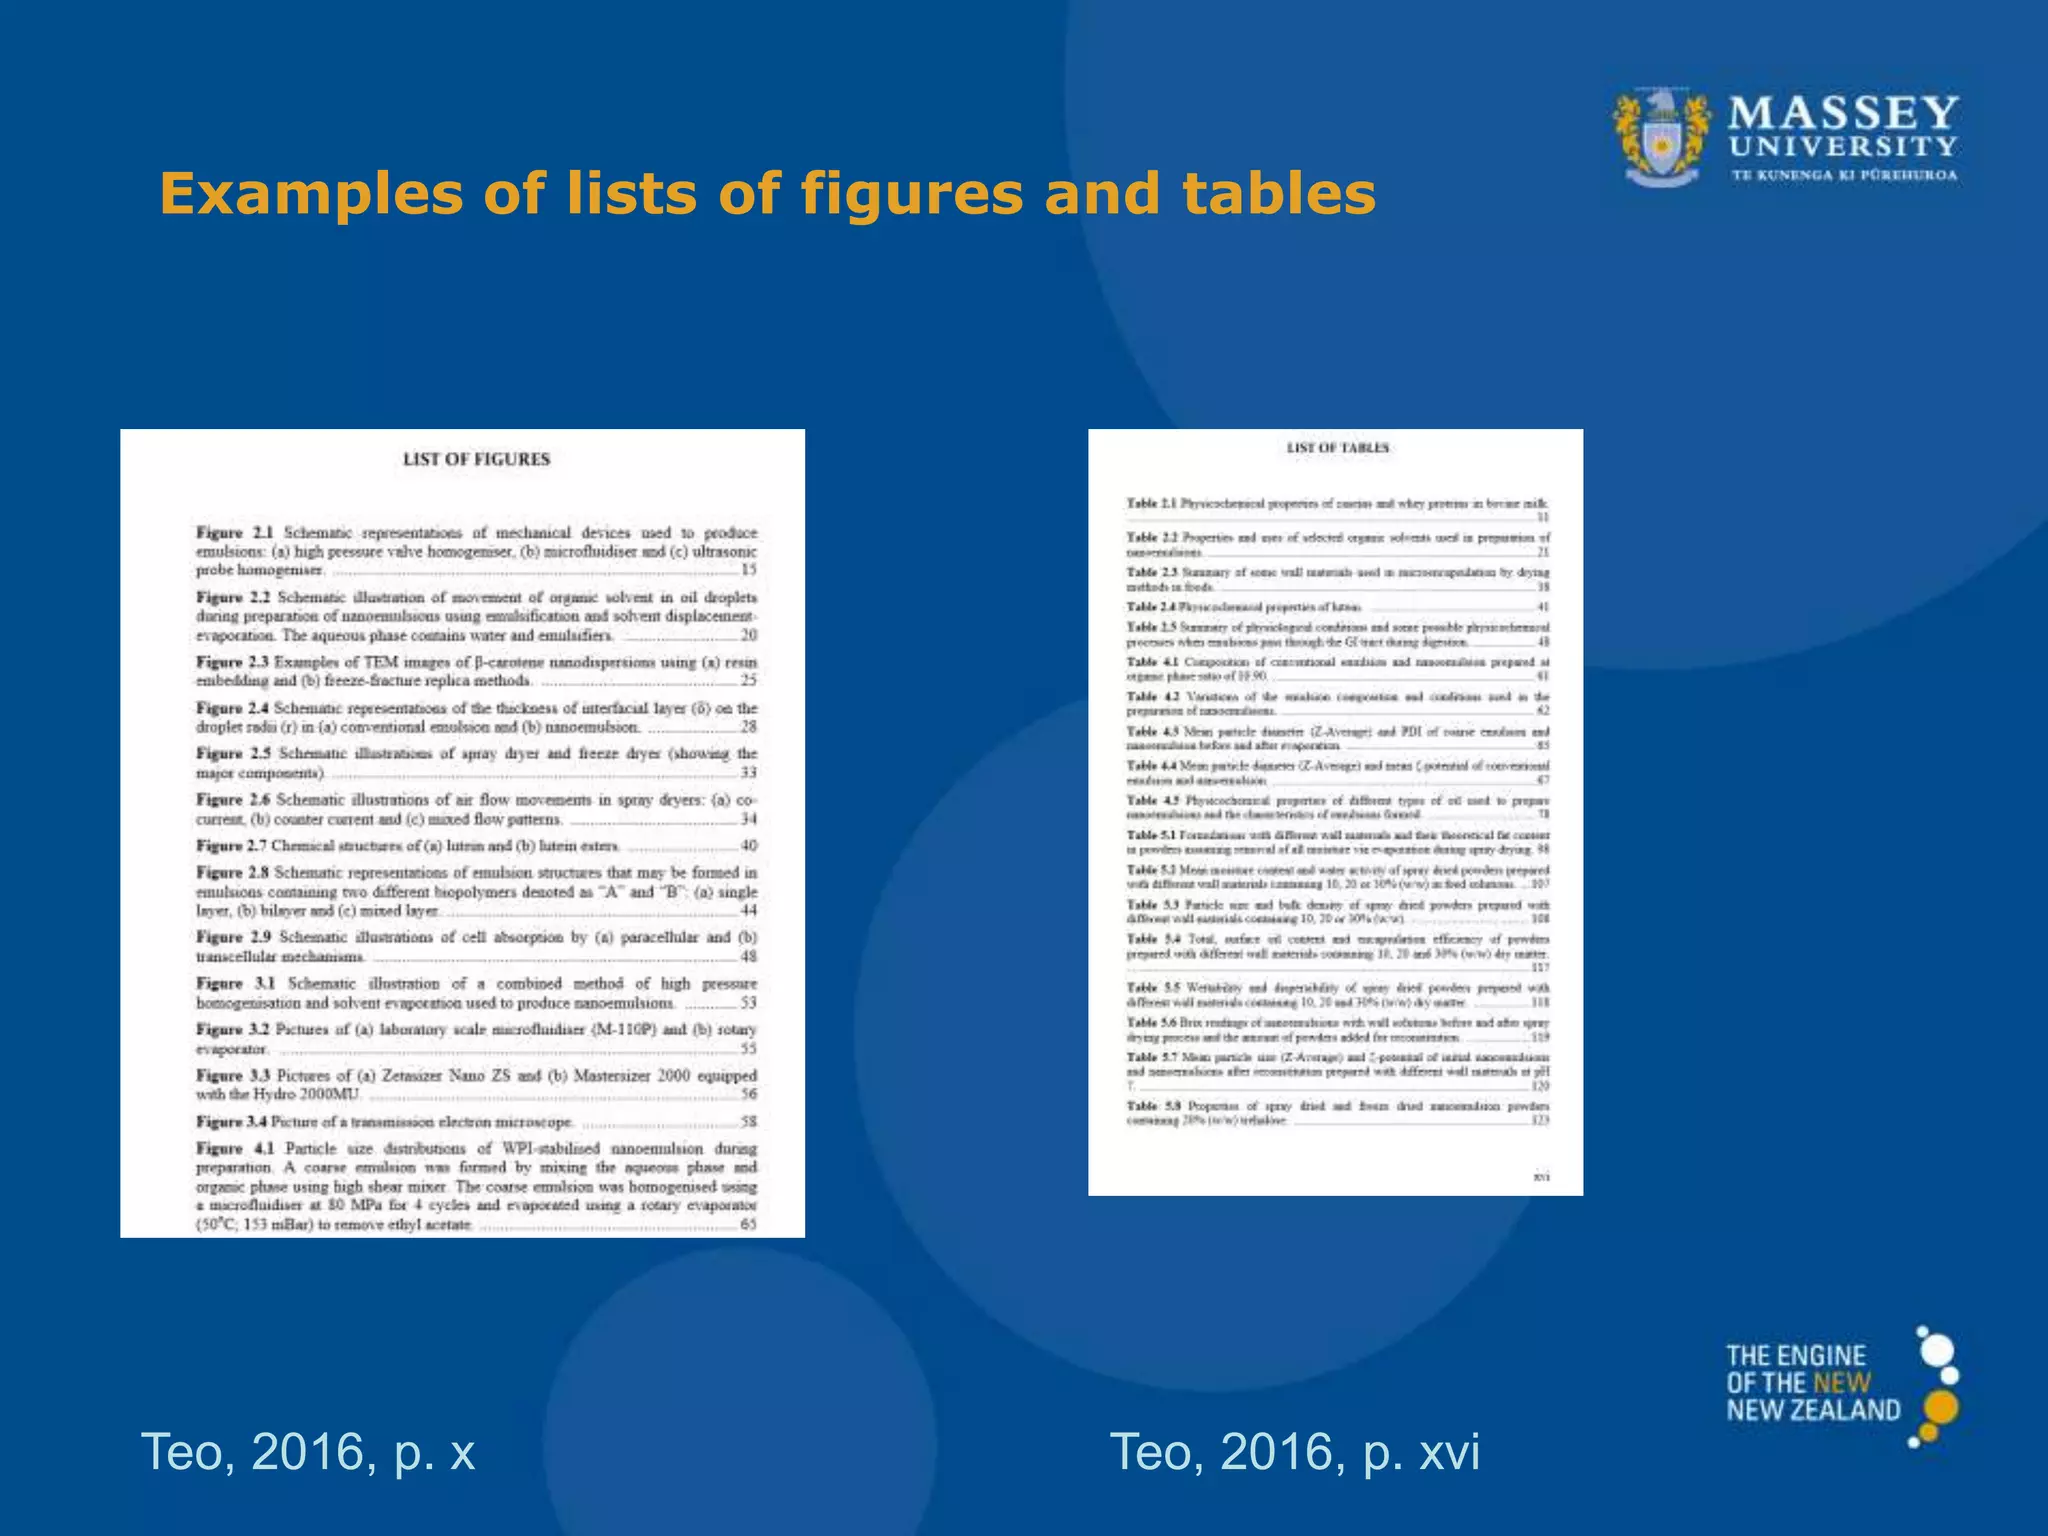
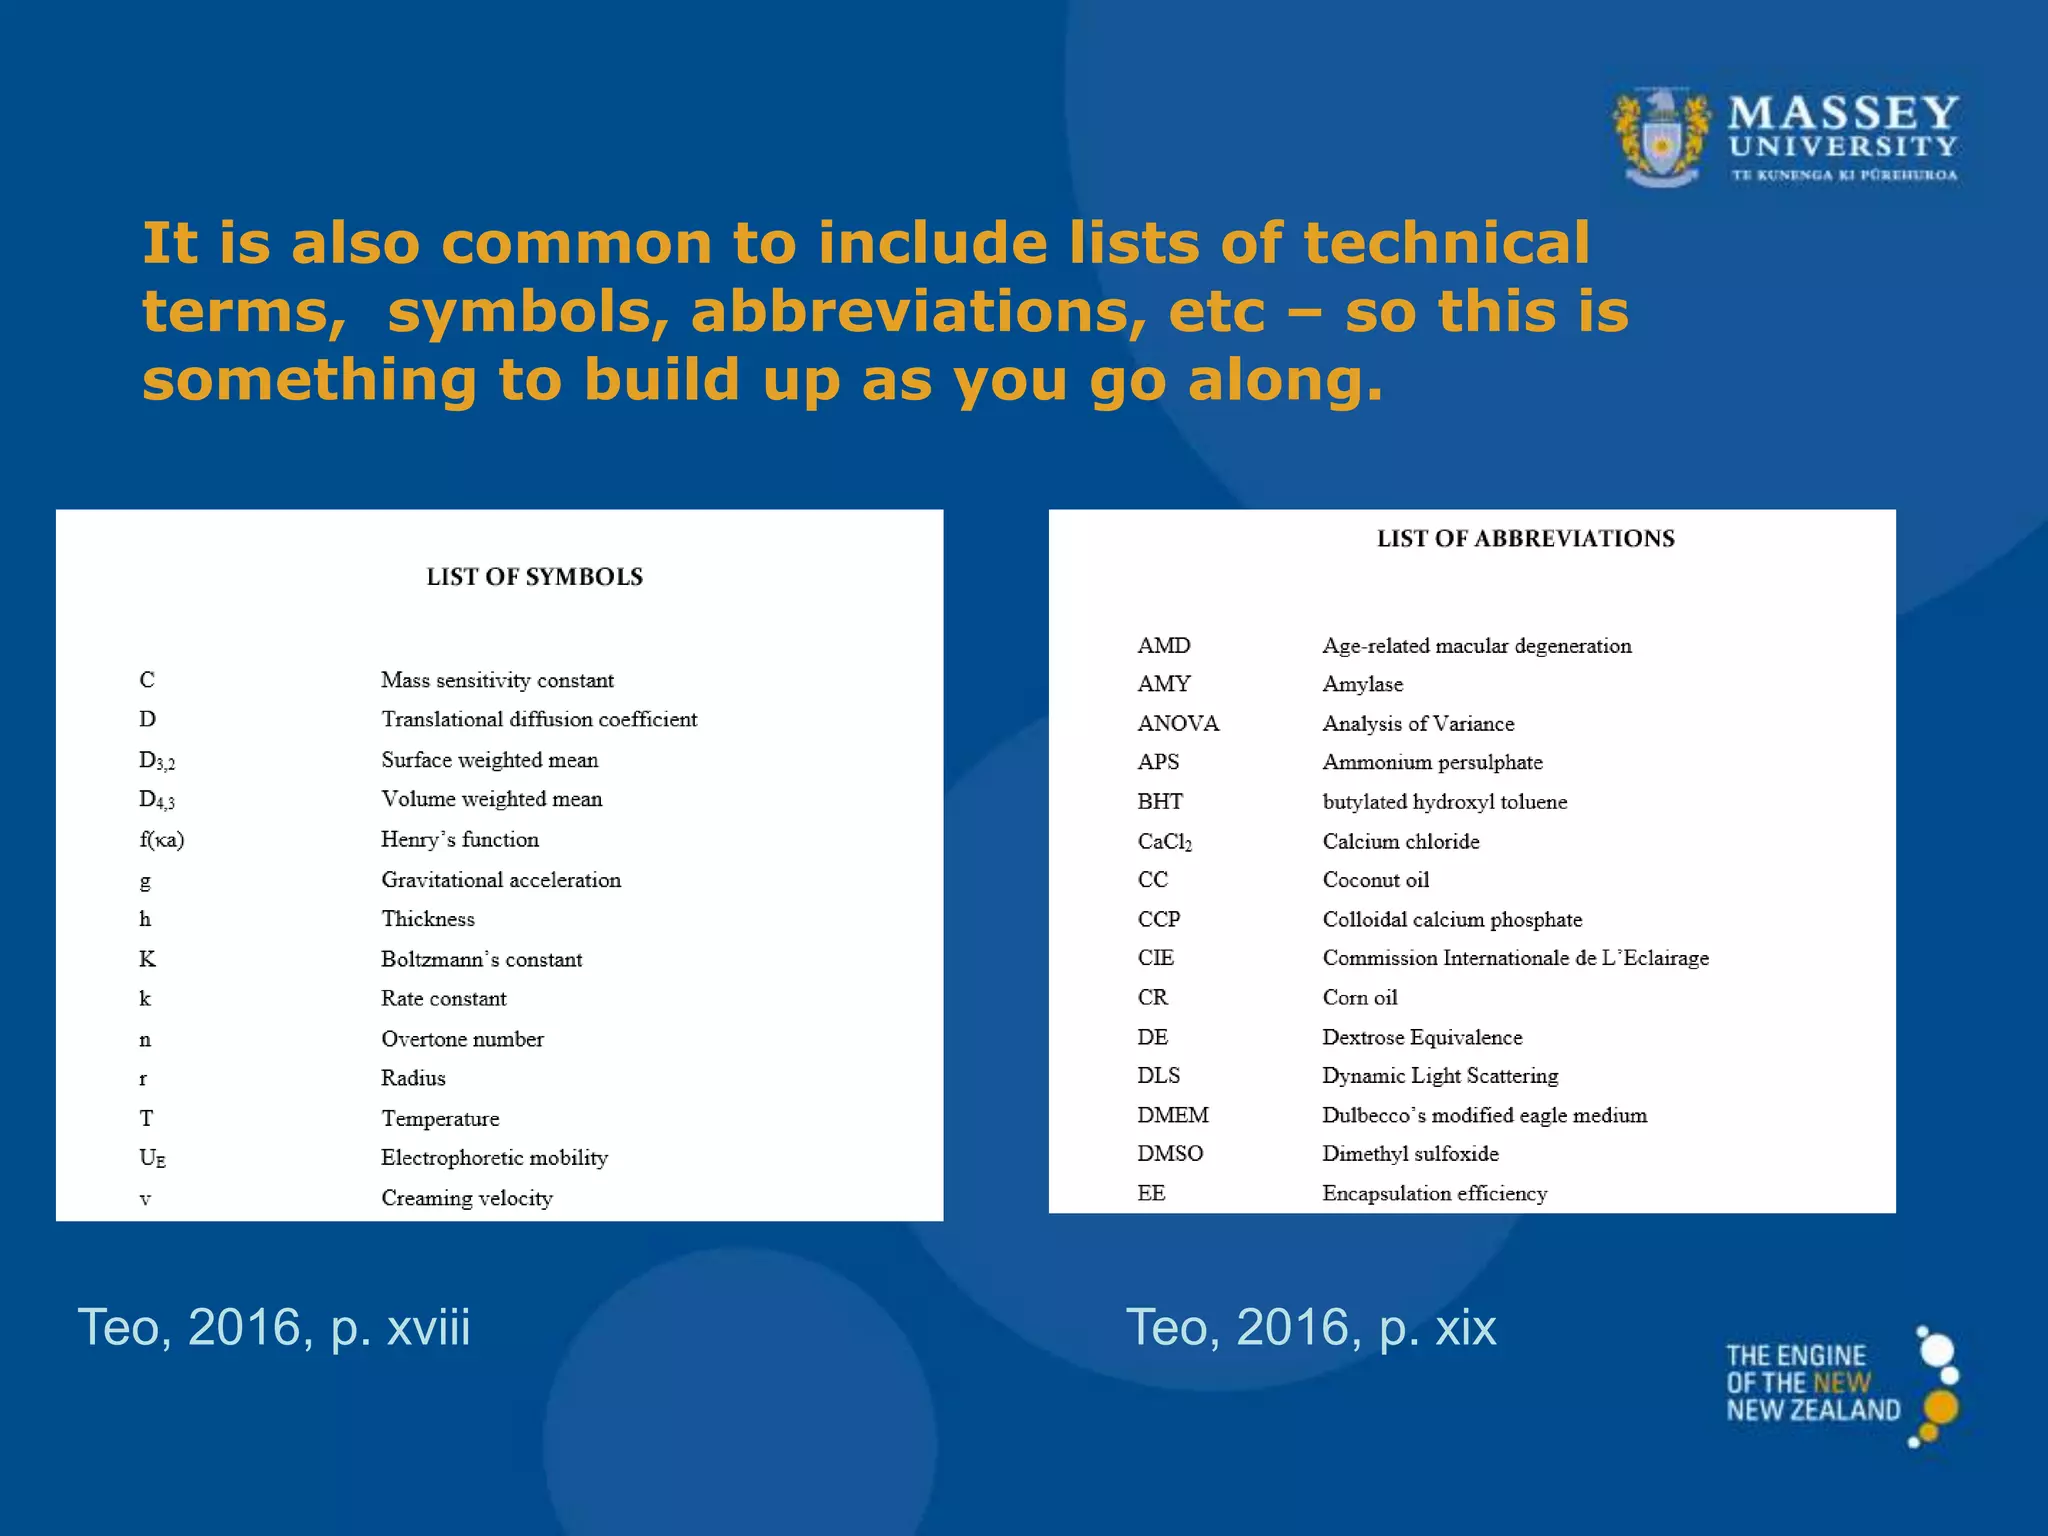
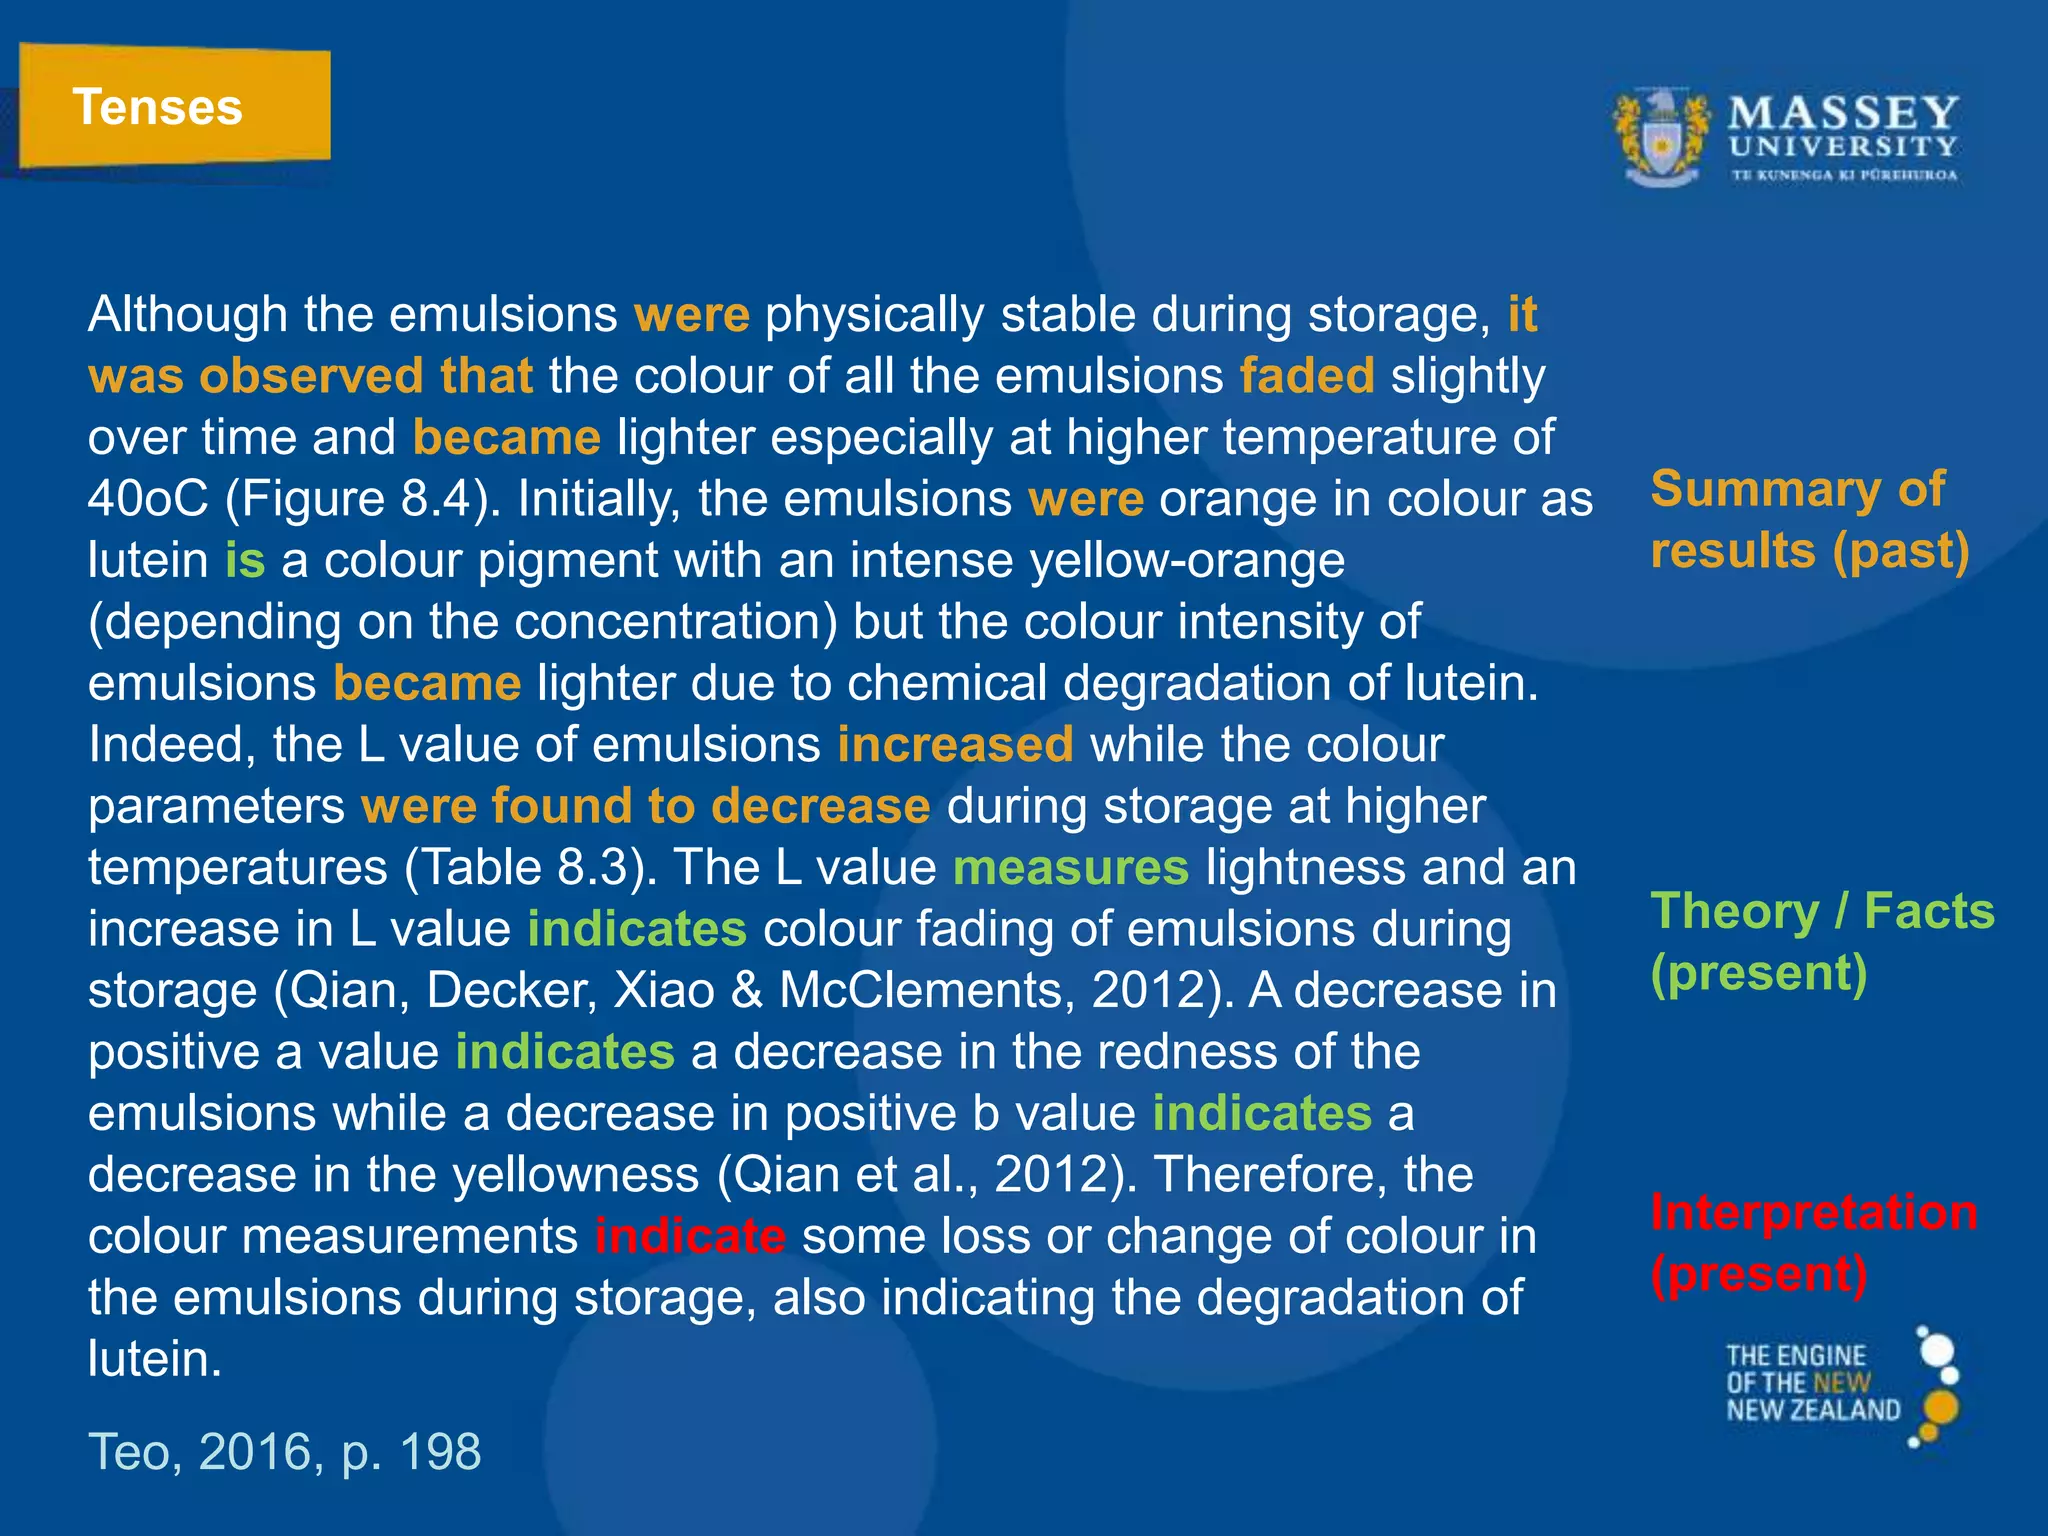
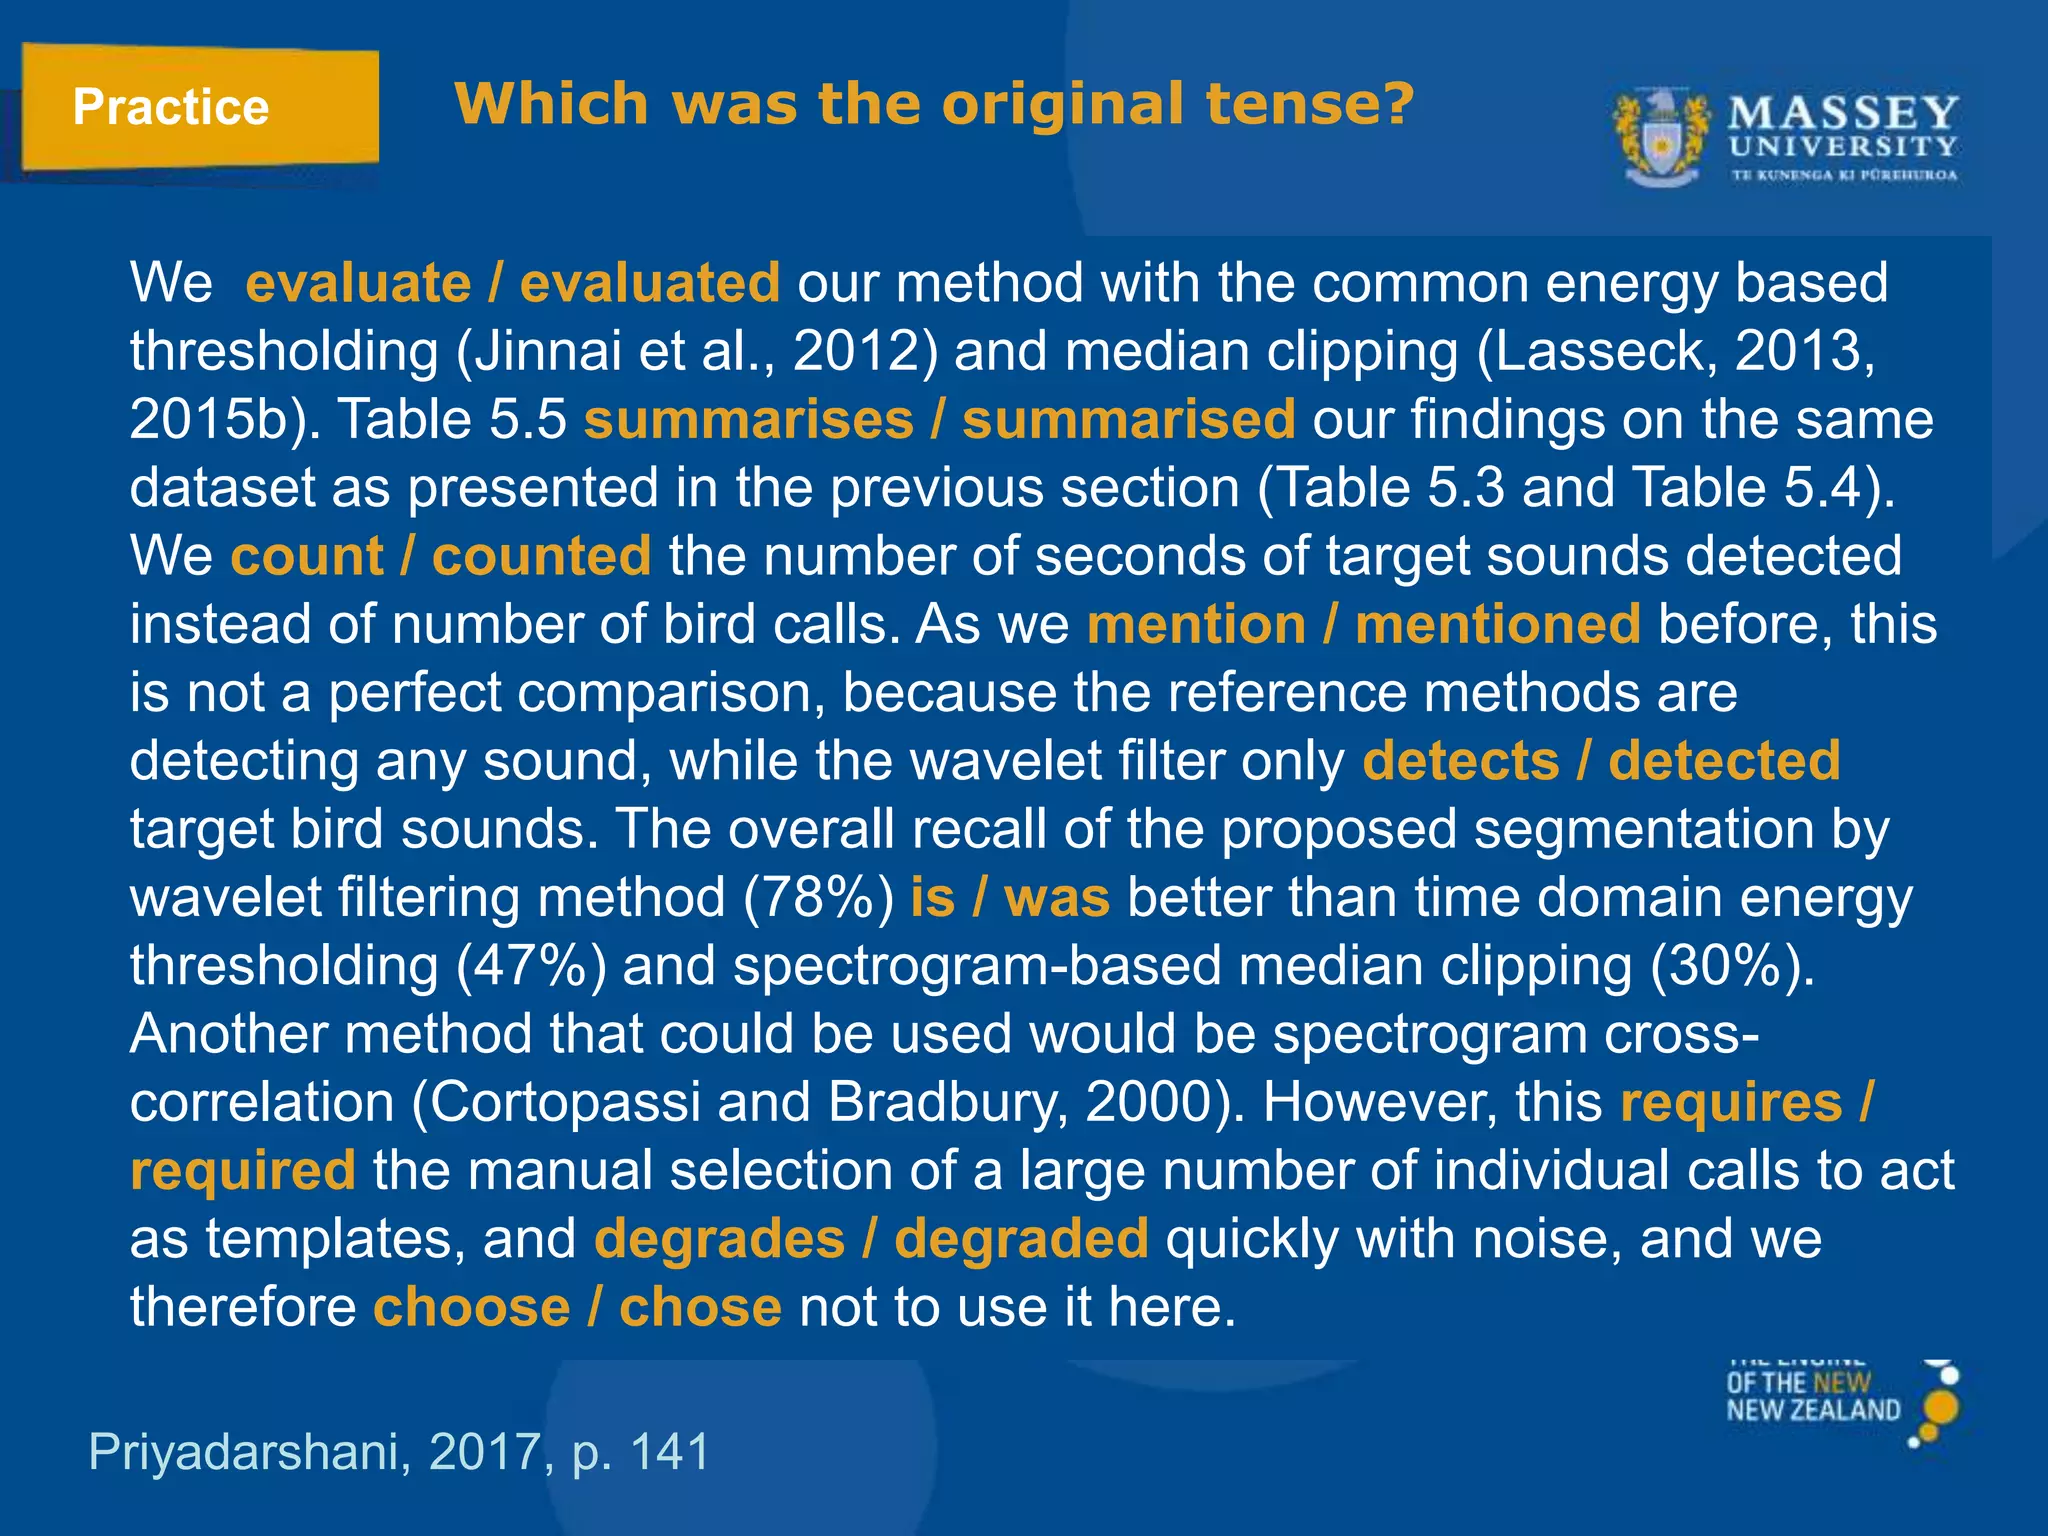
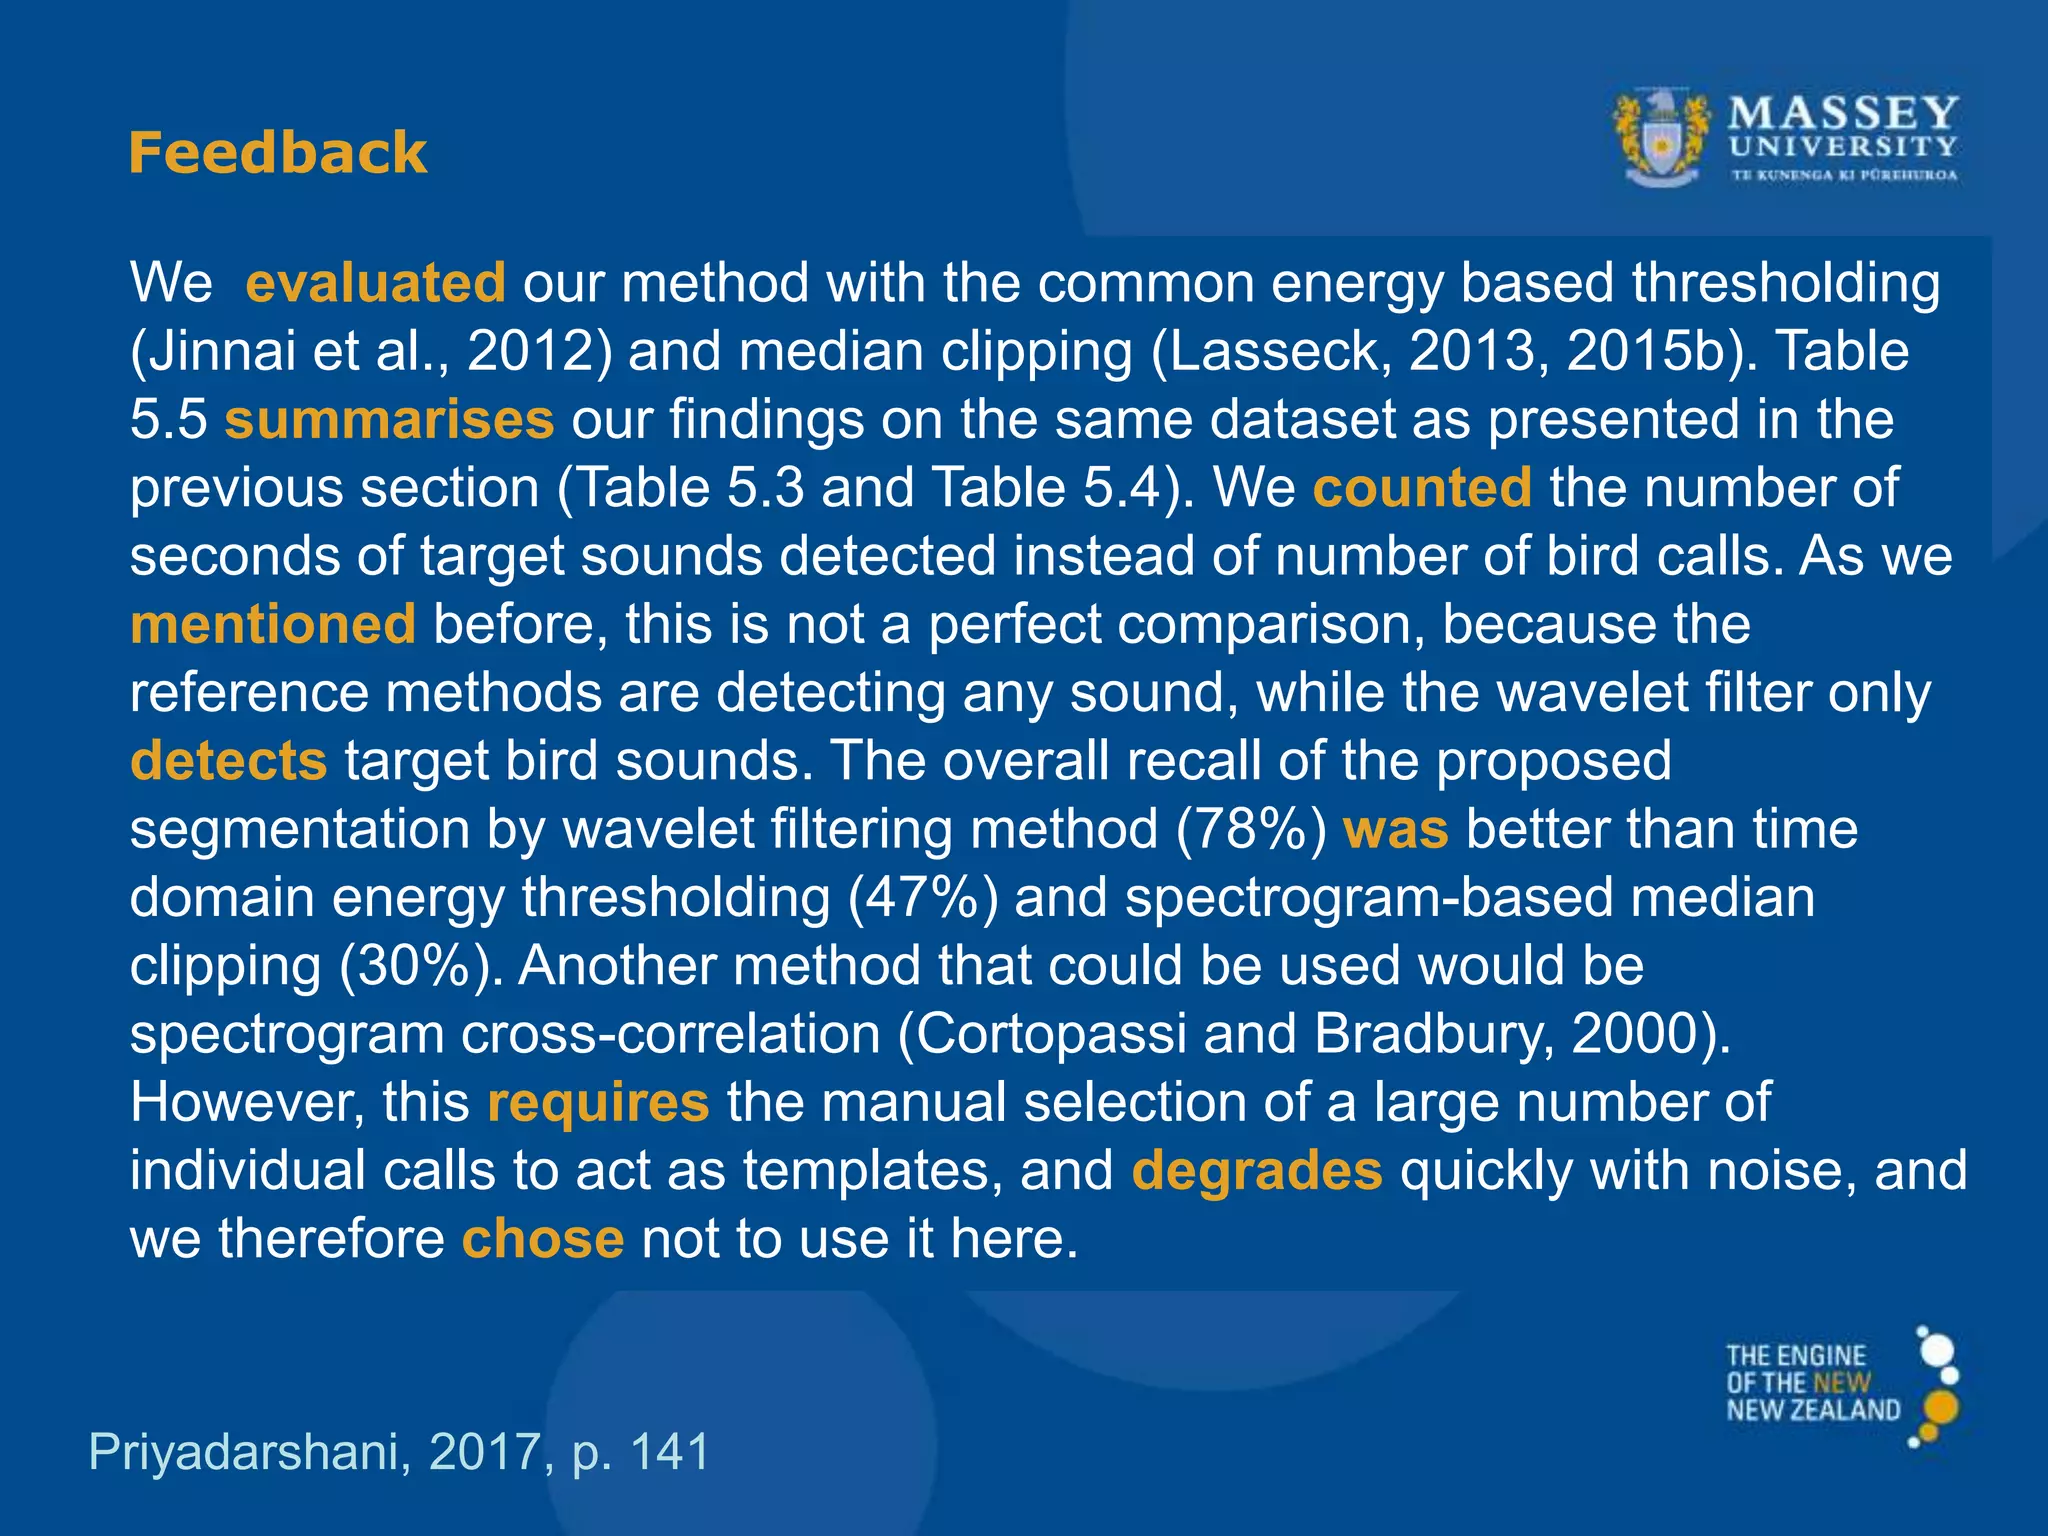
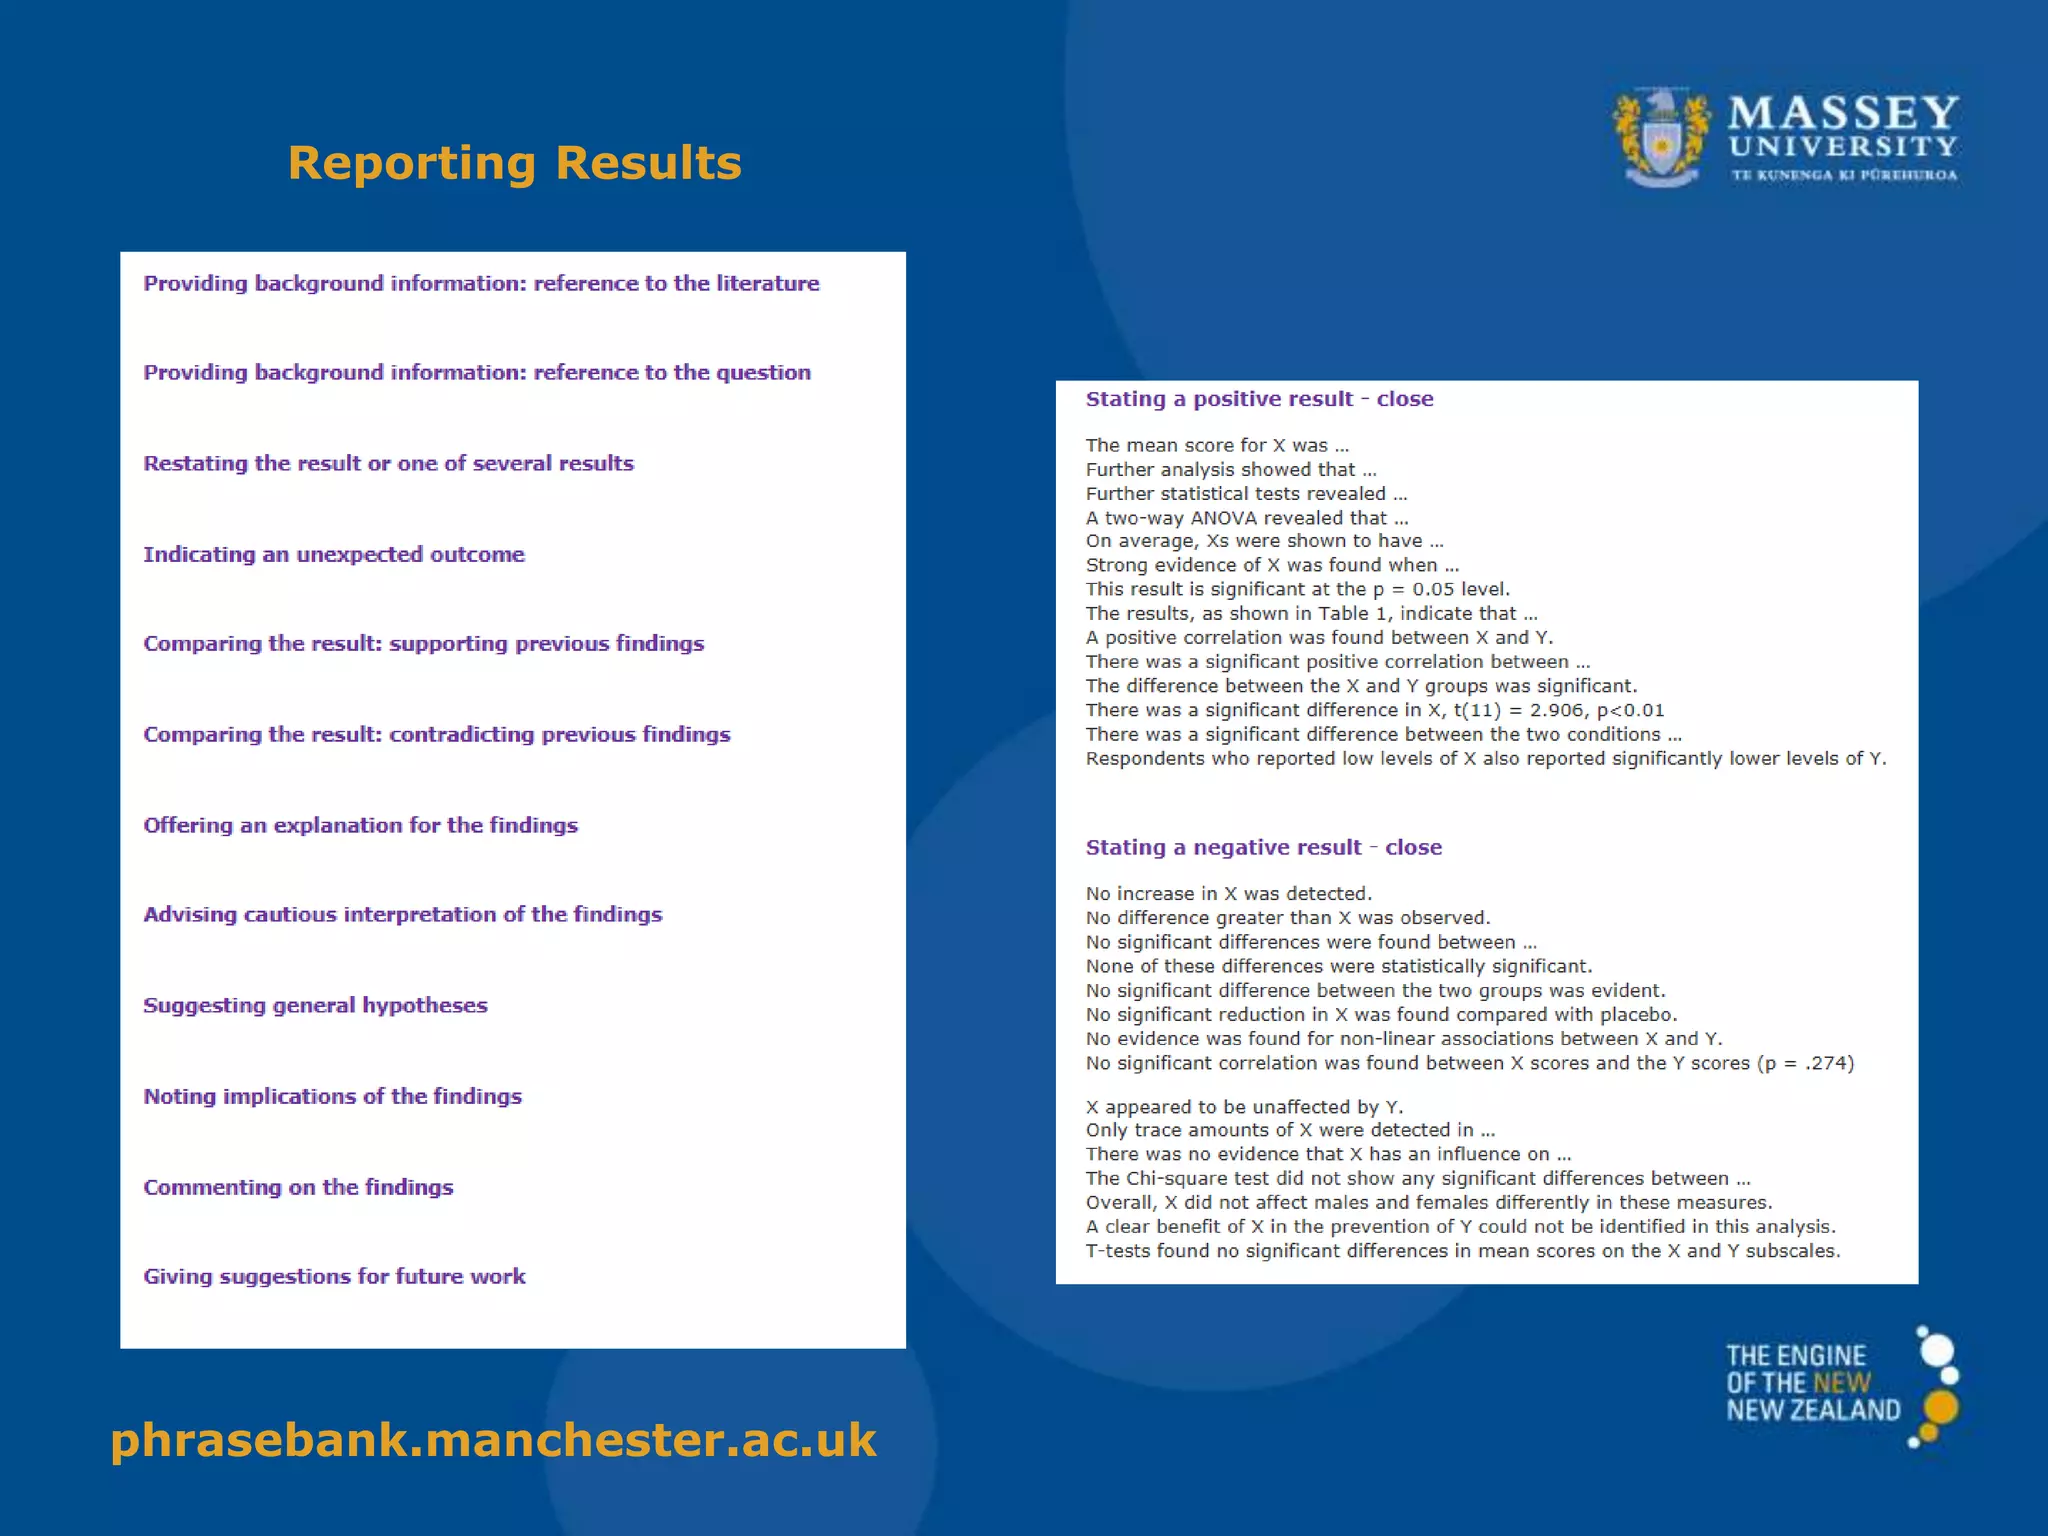
Discusses importance and presentation style of tables and figures in research, including summarization.
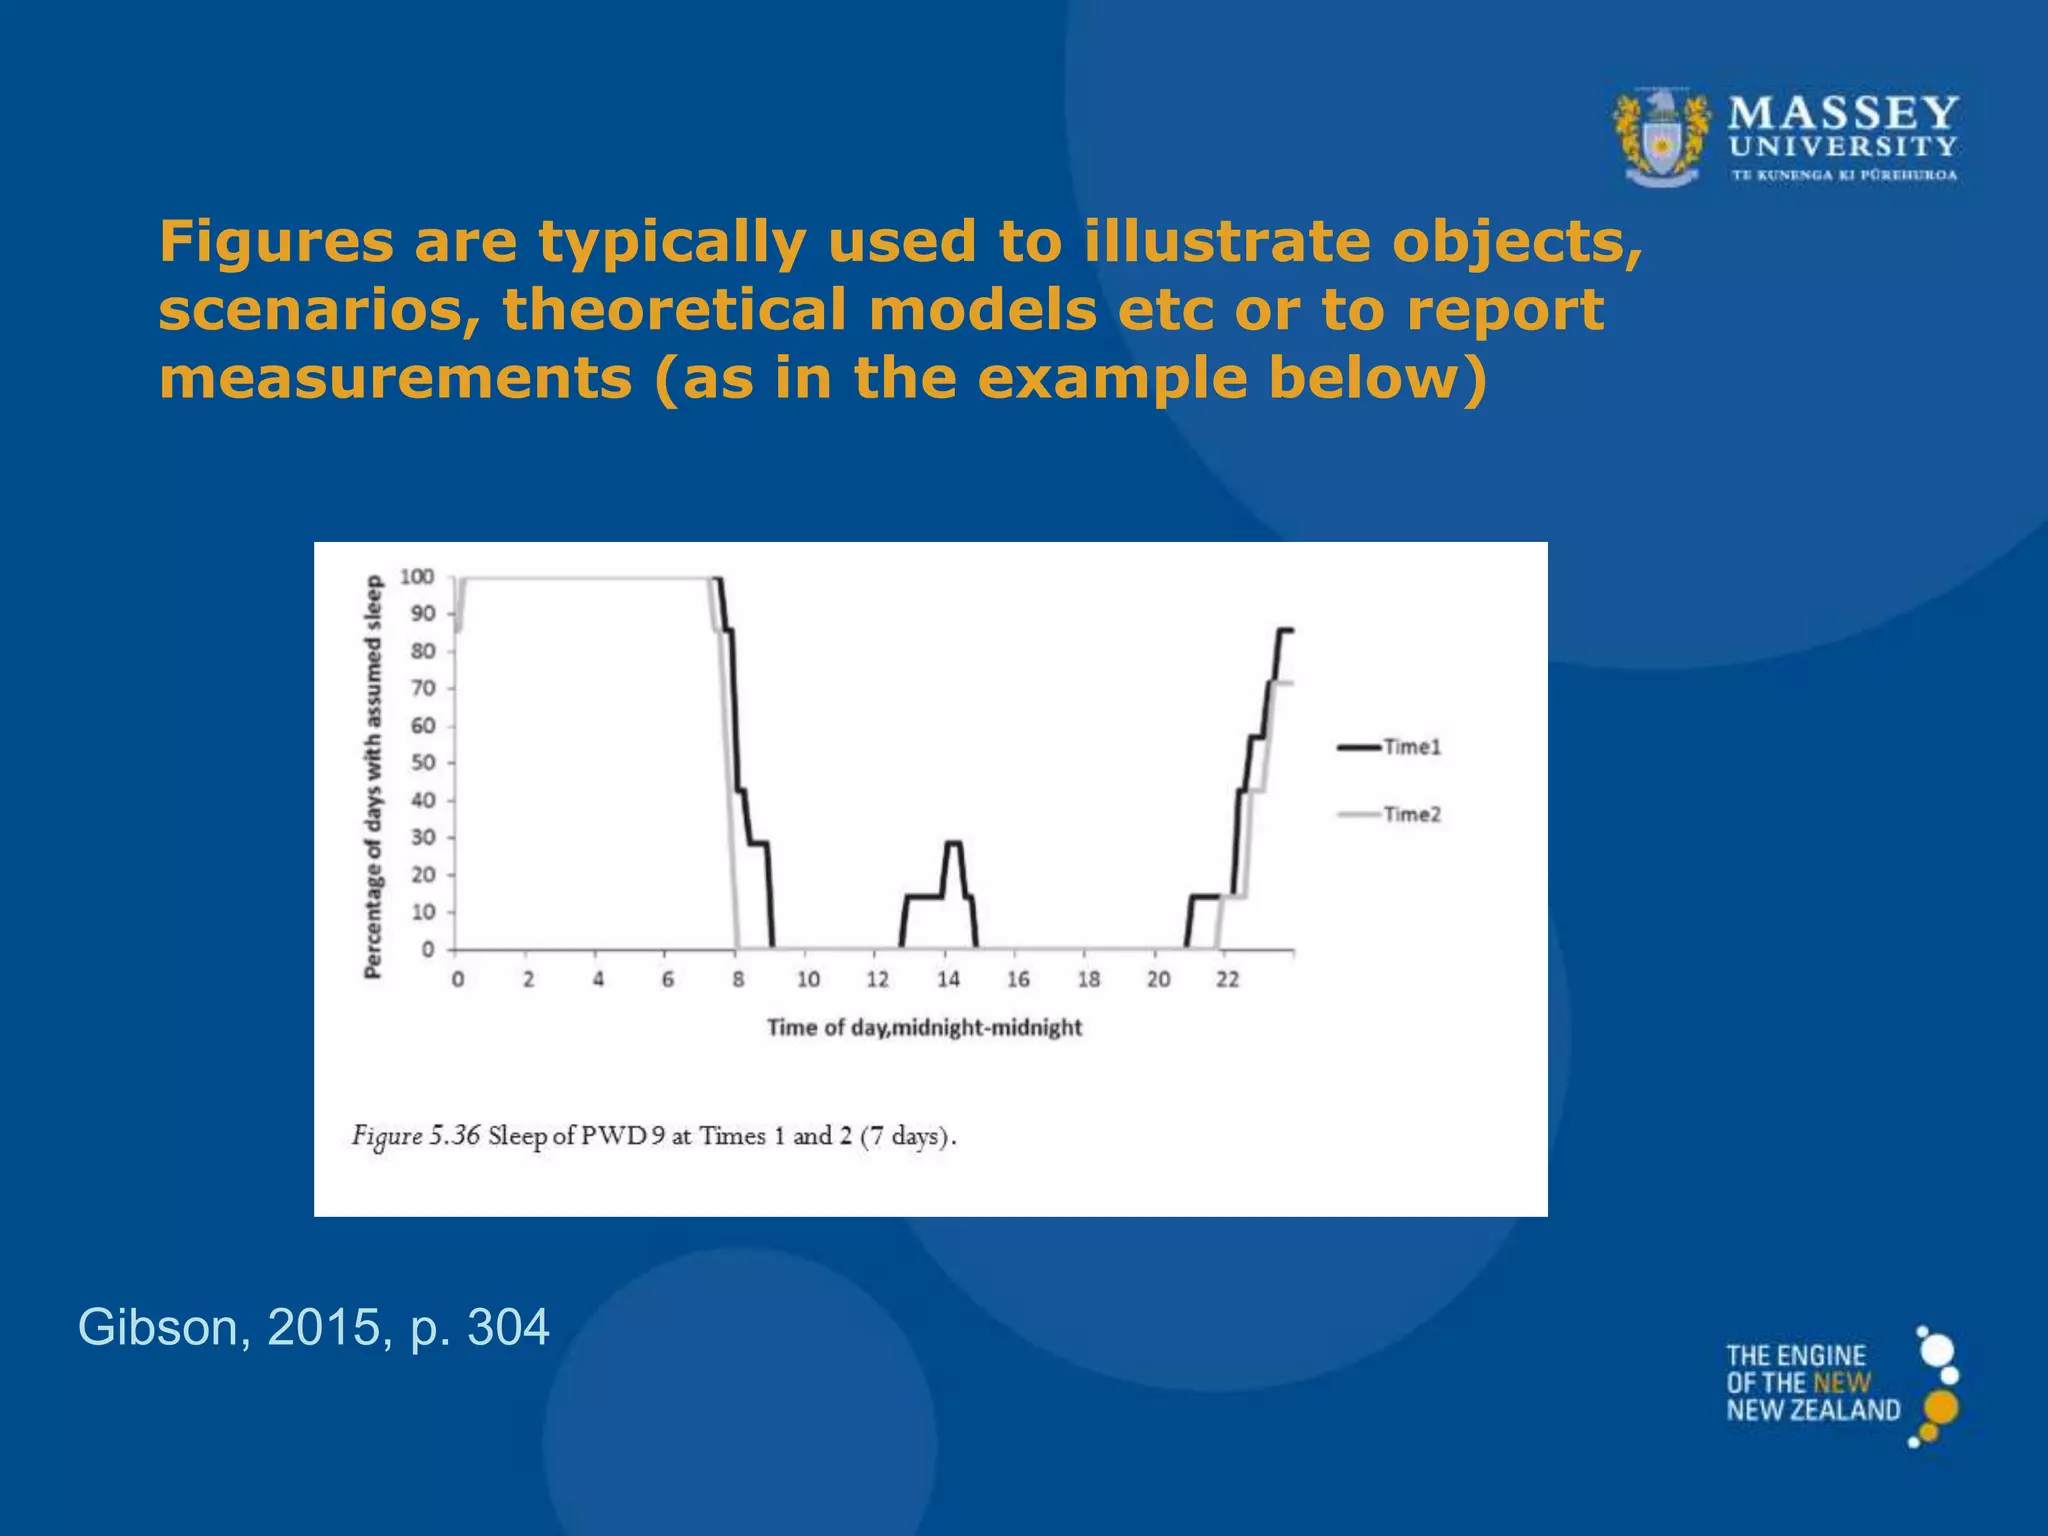
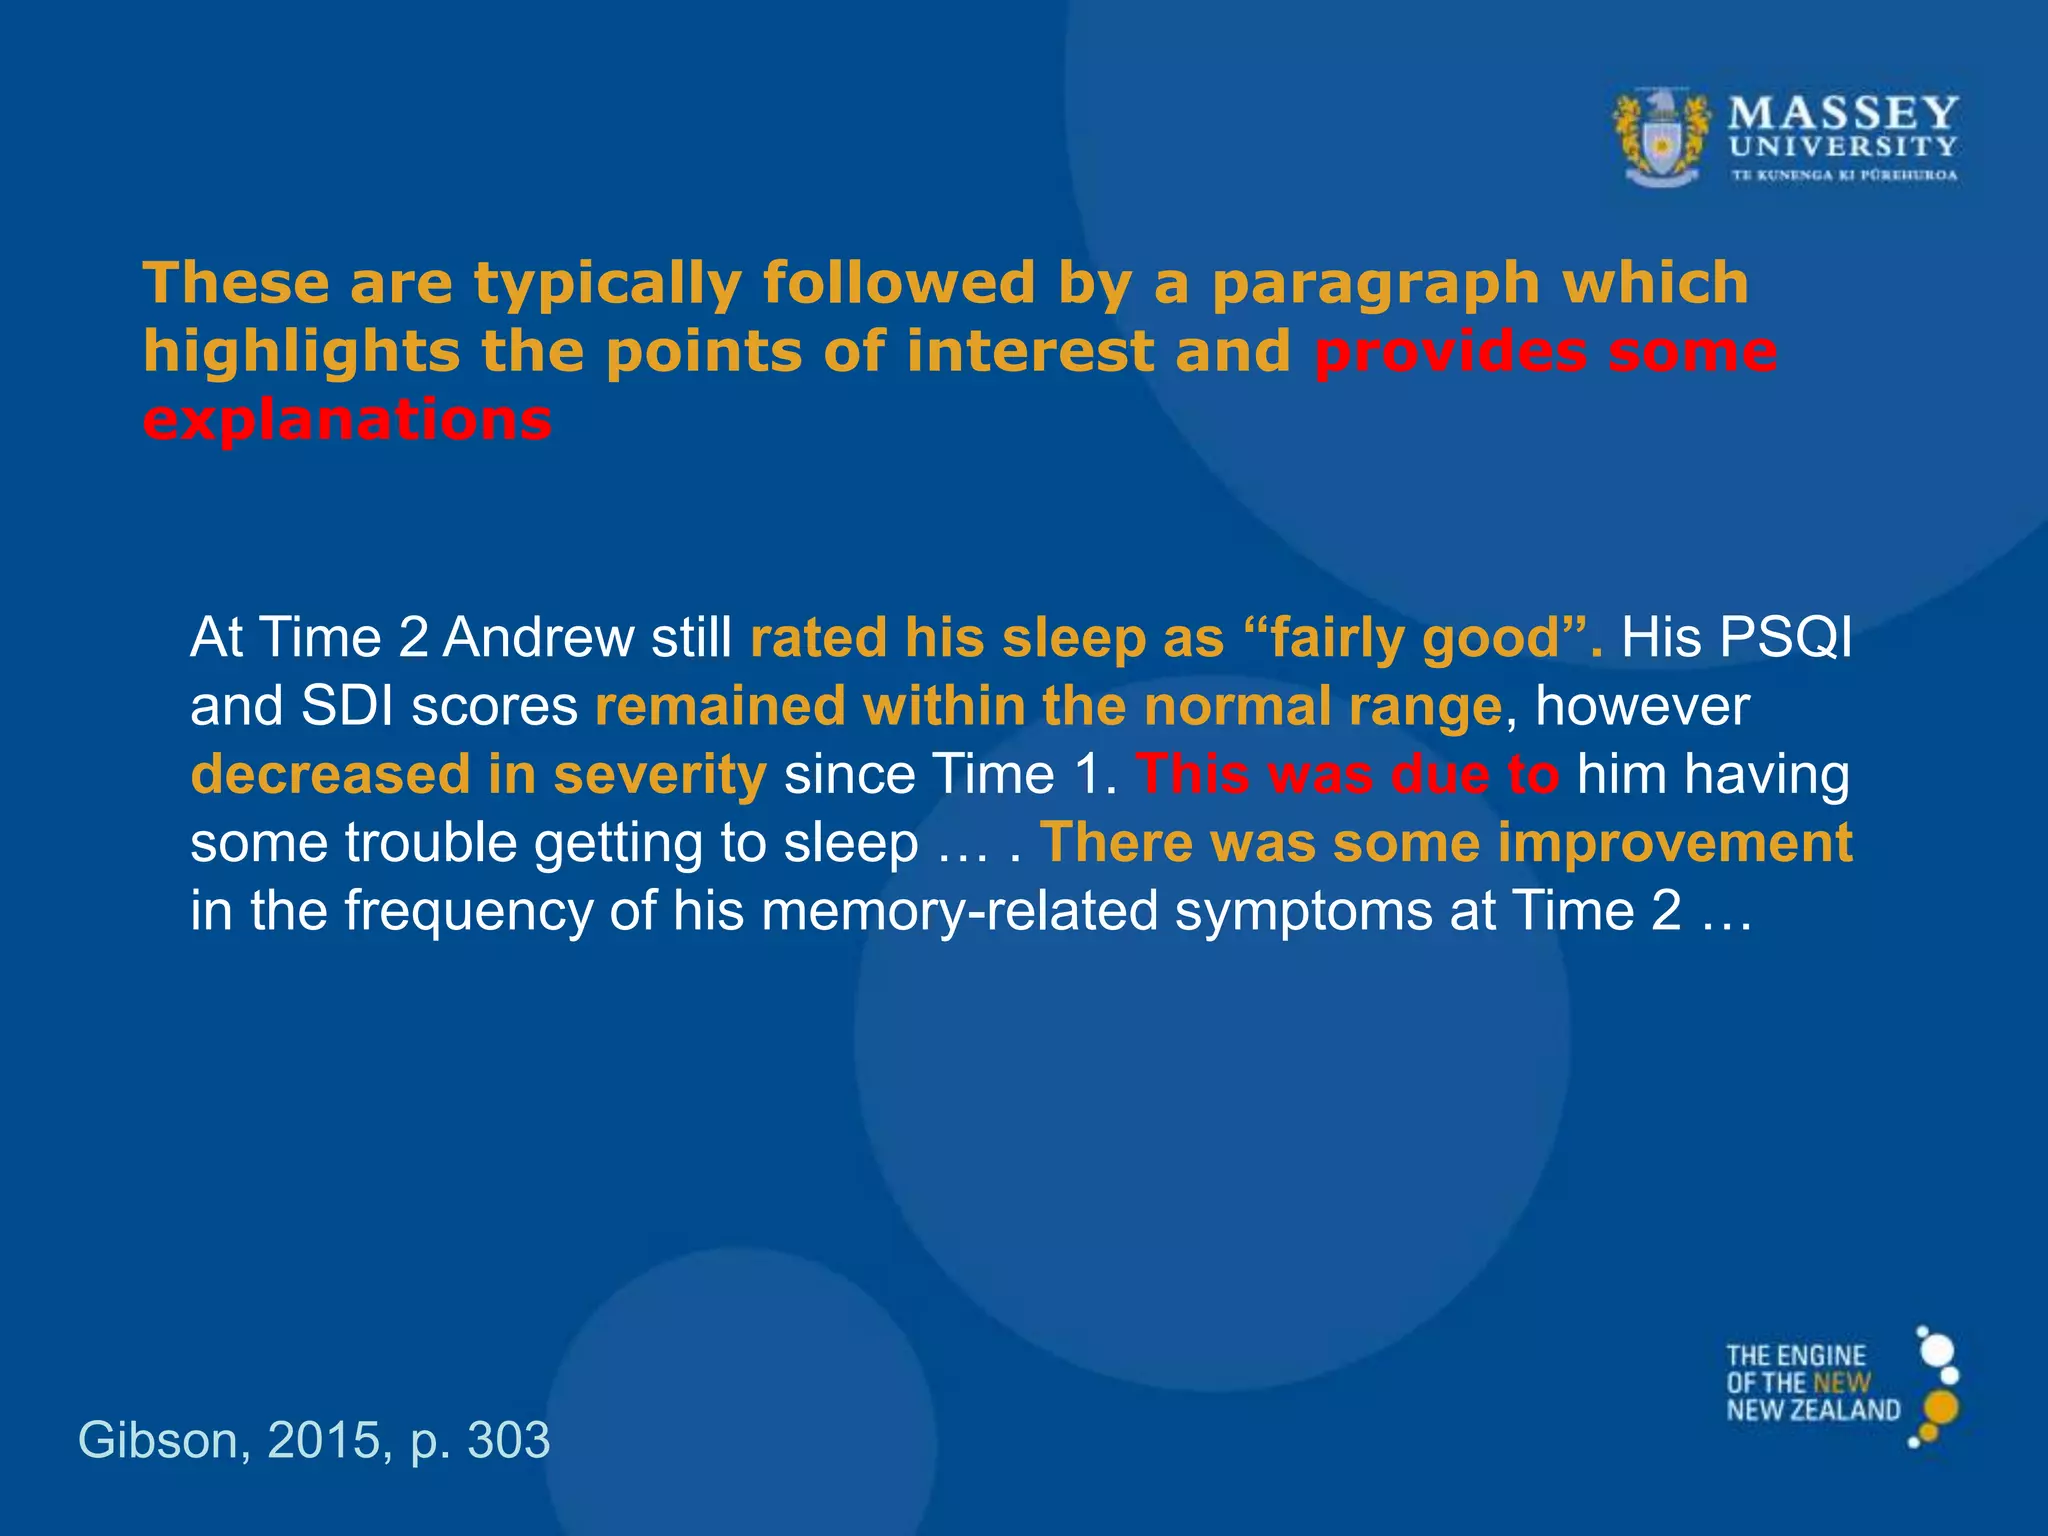
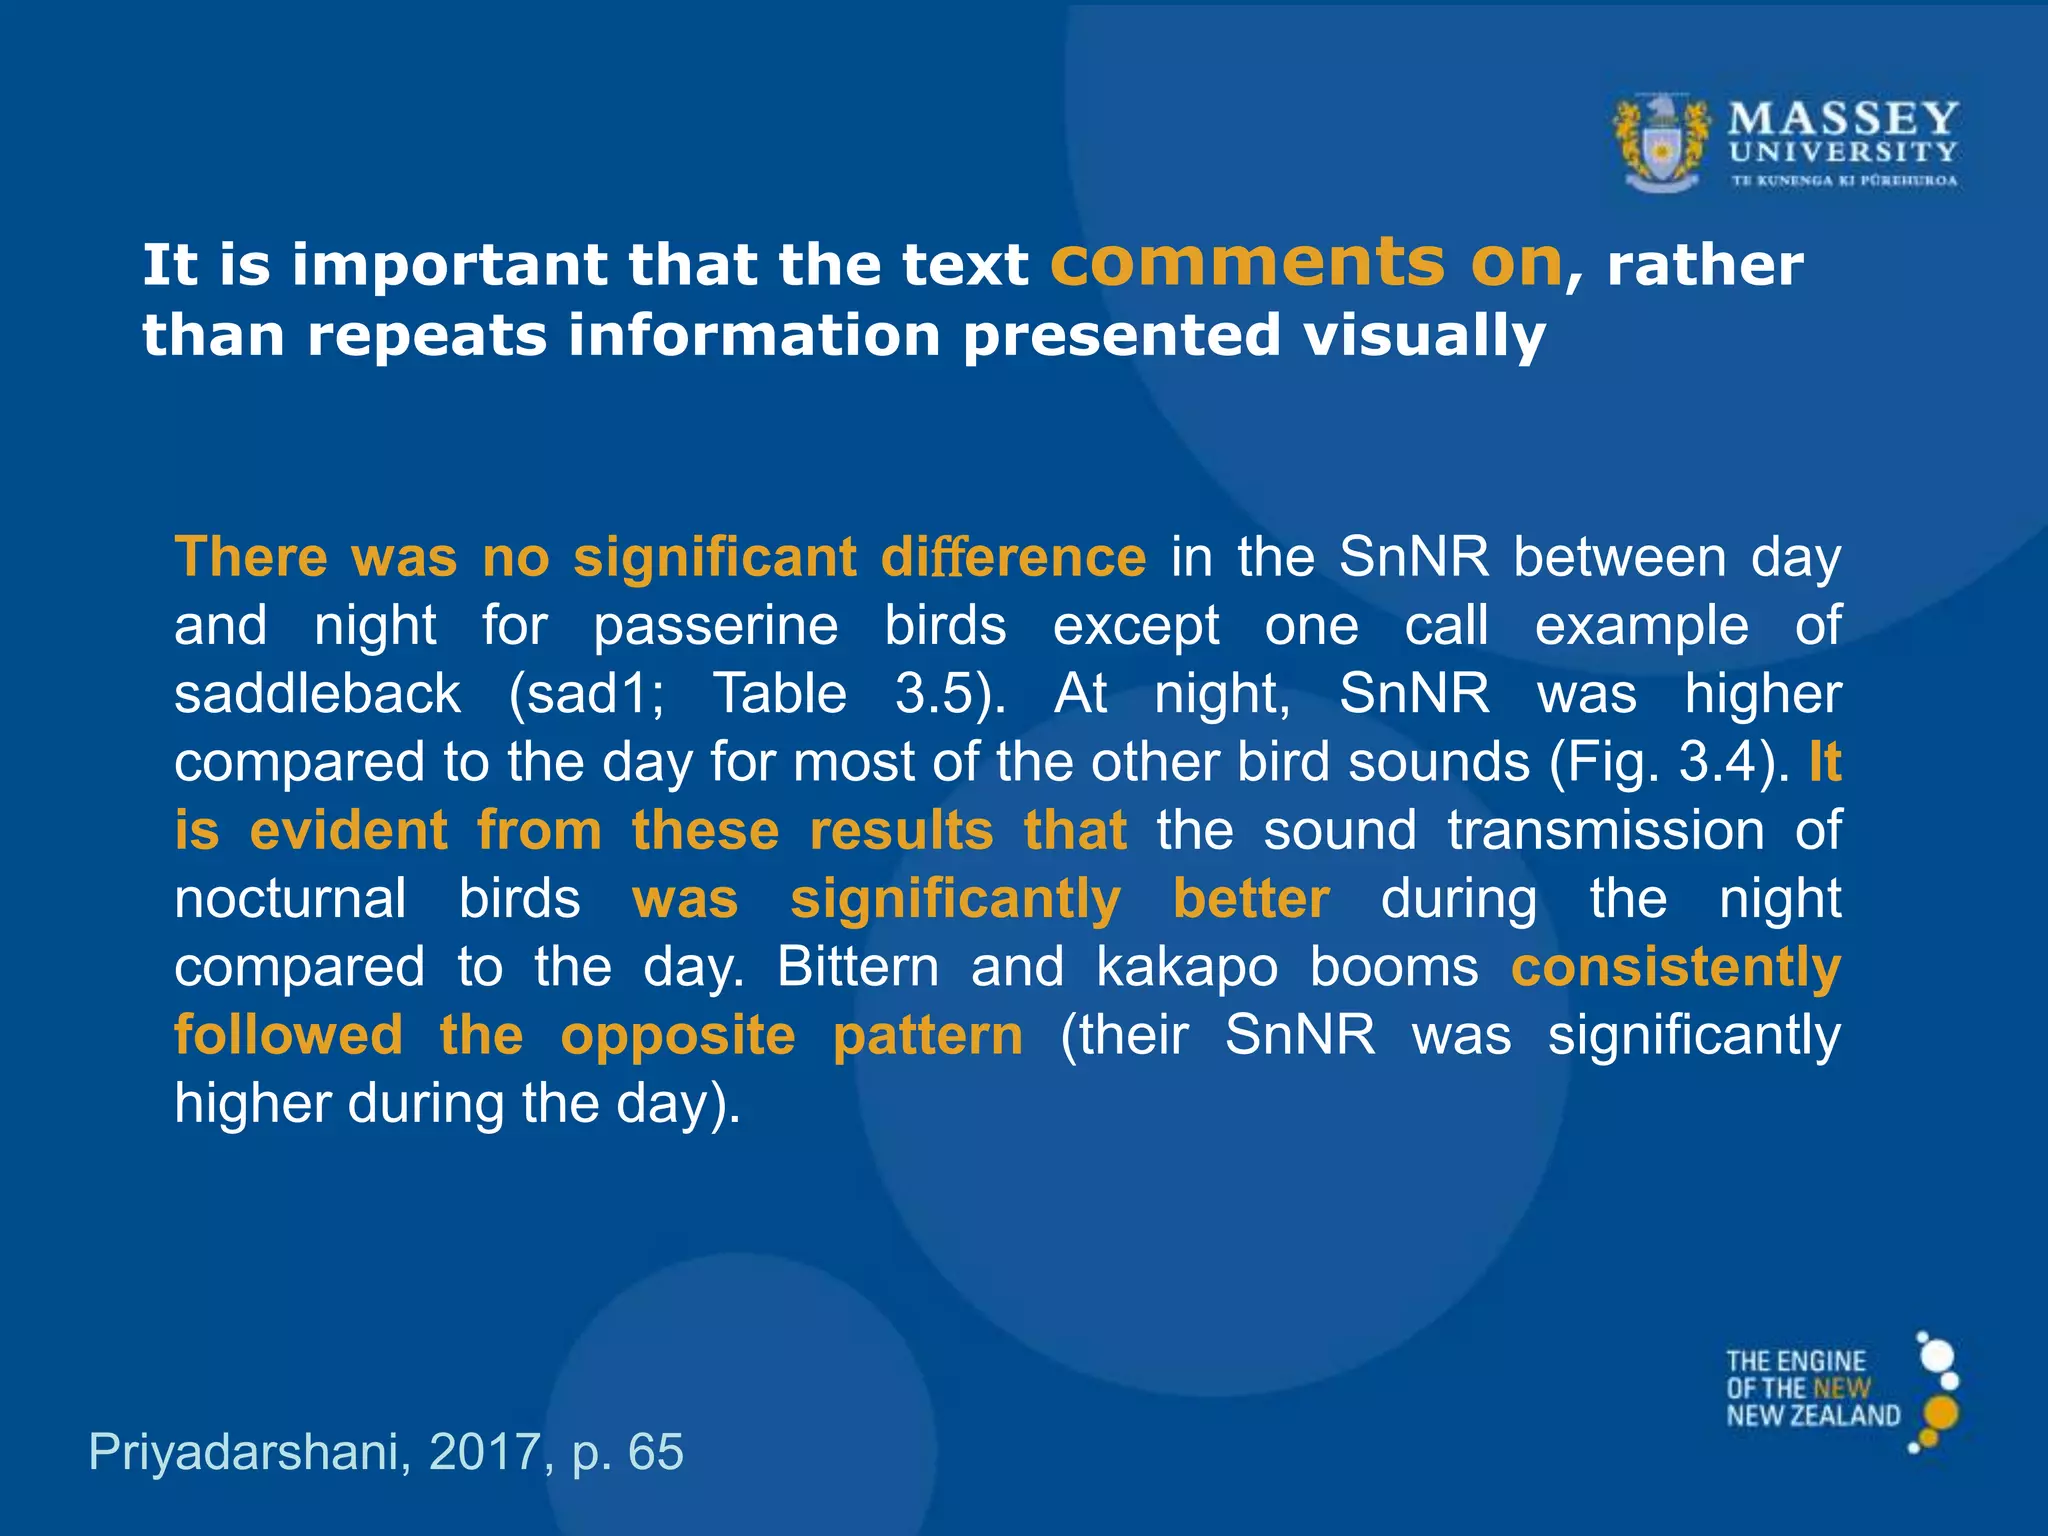
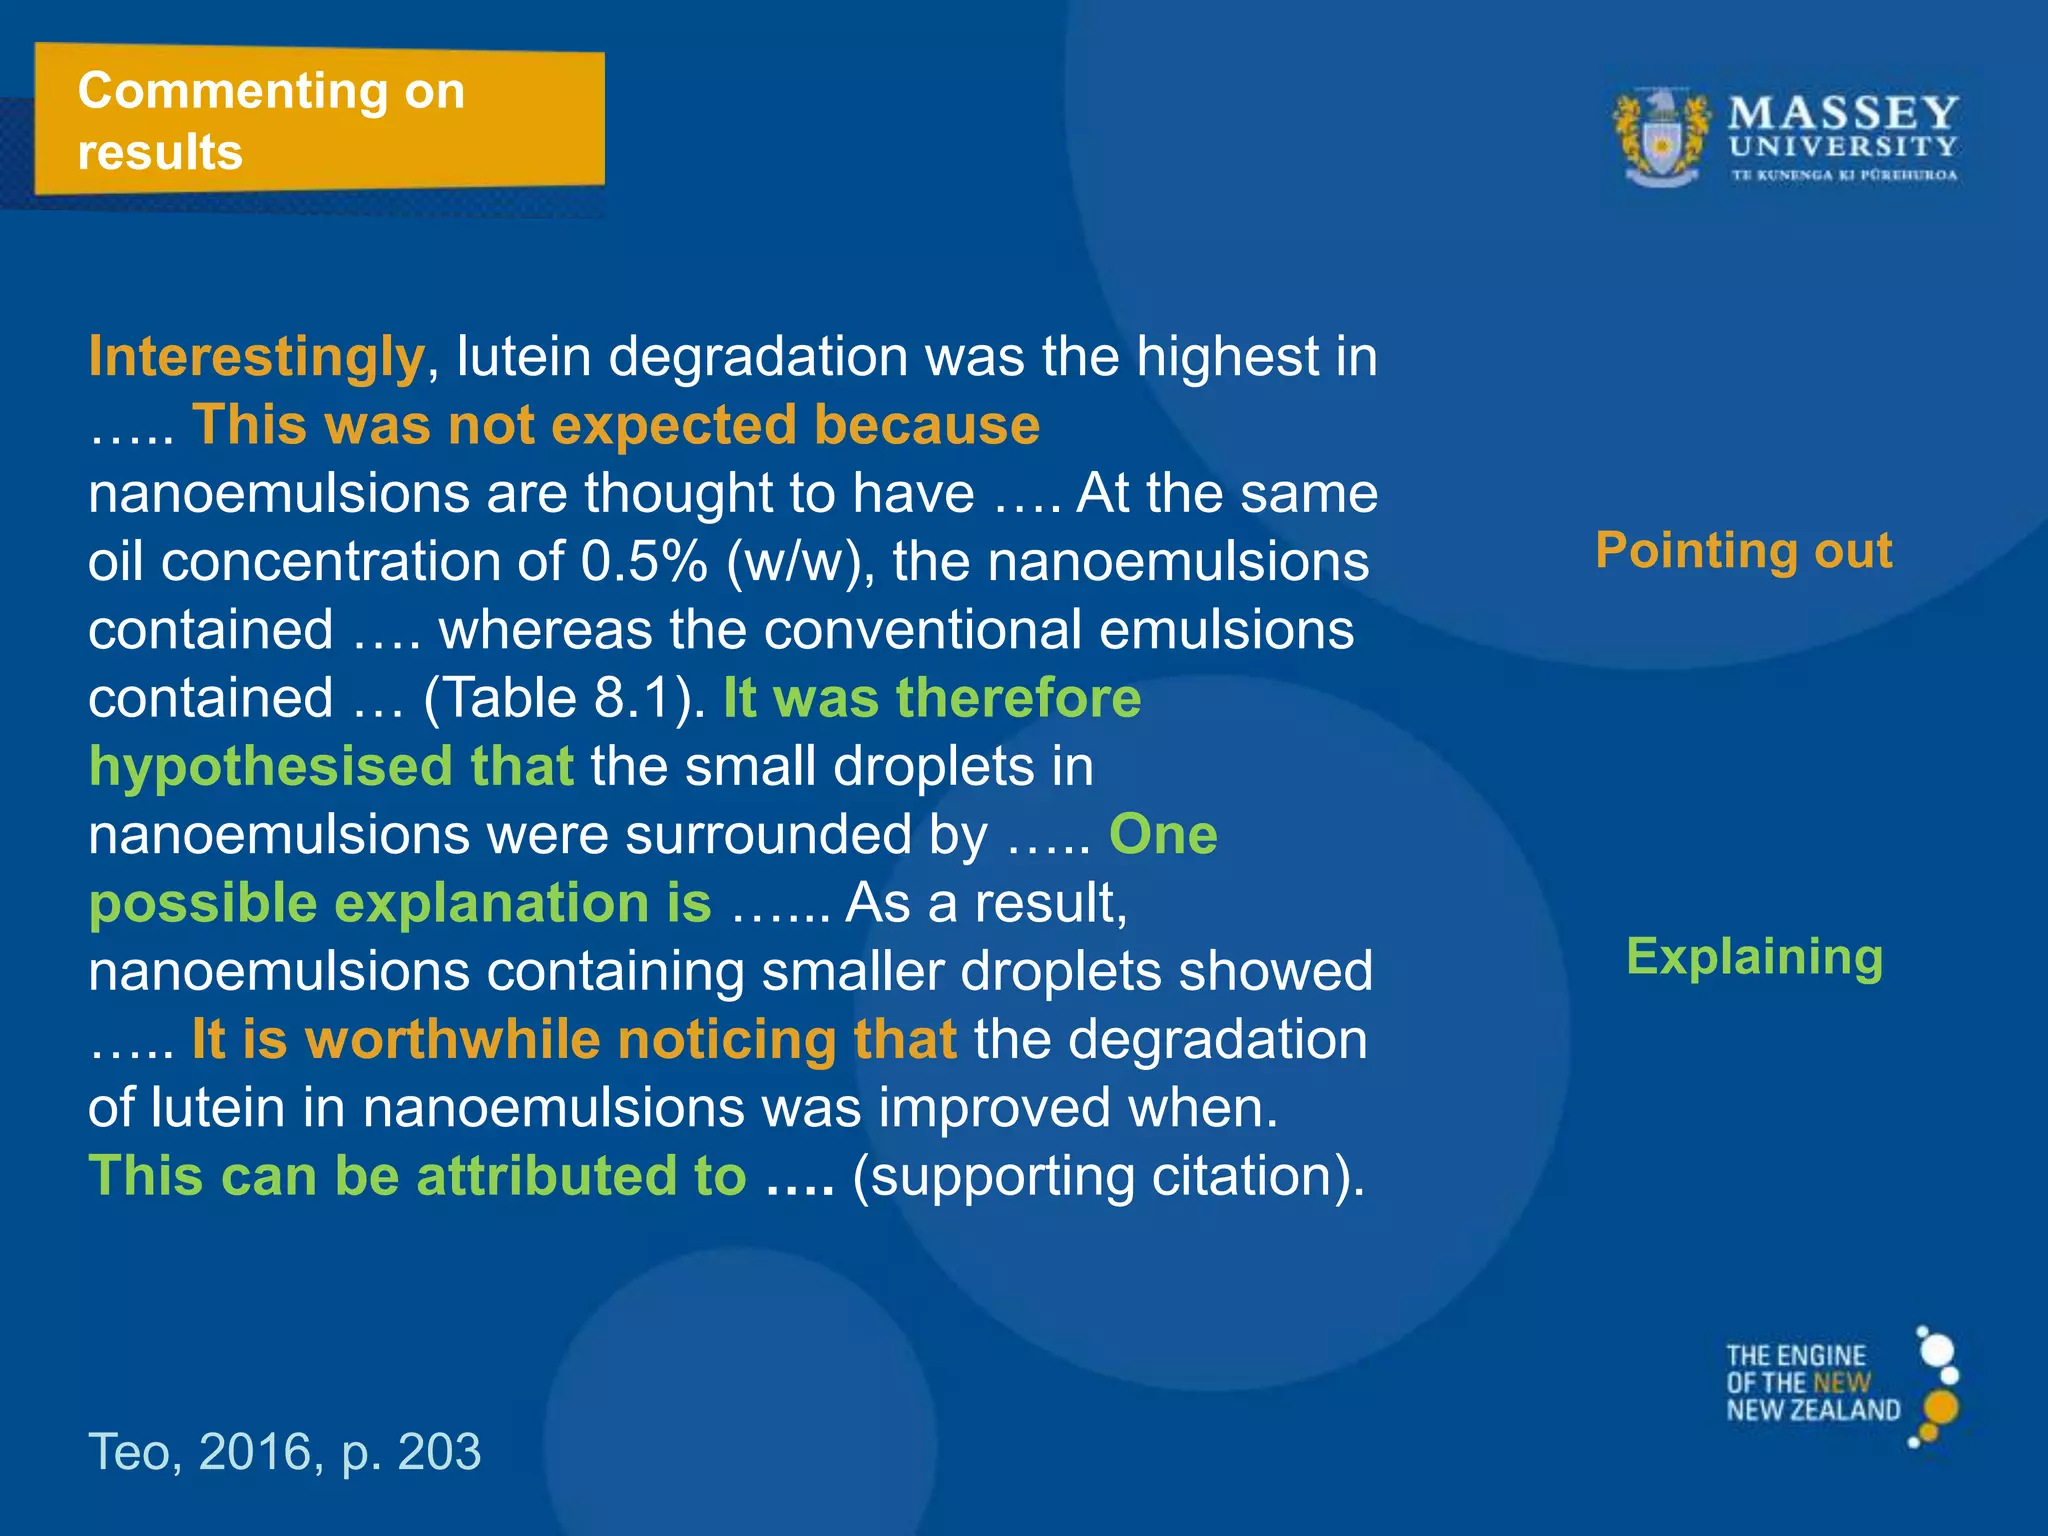
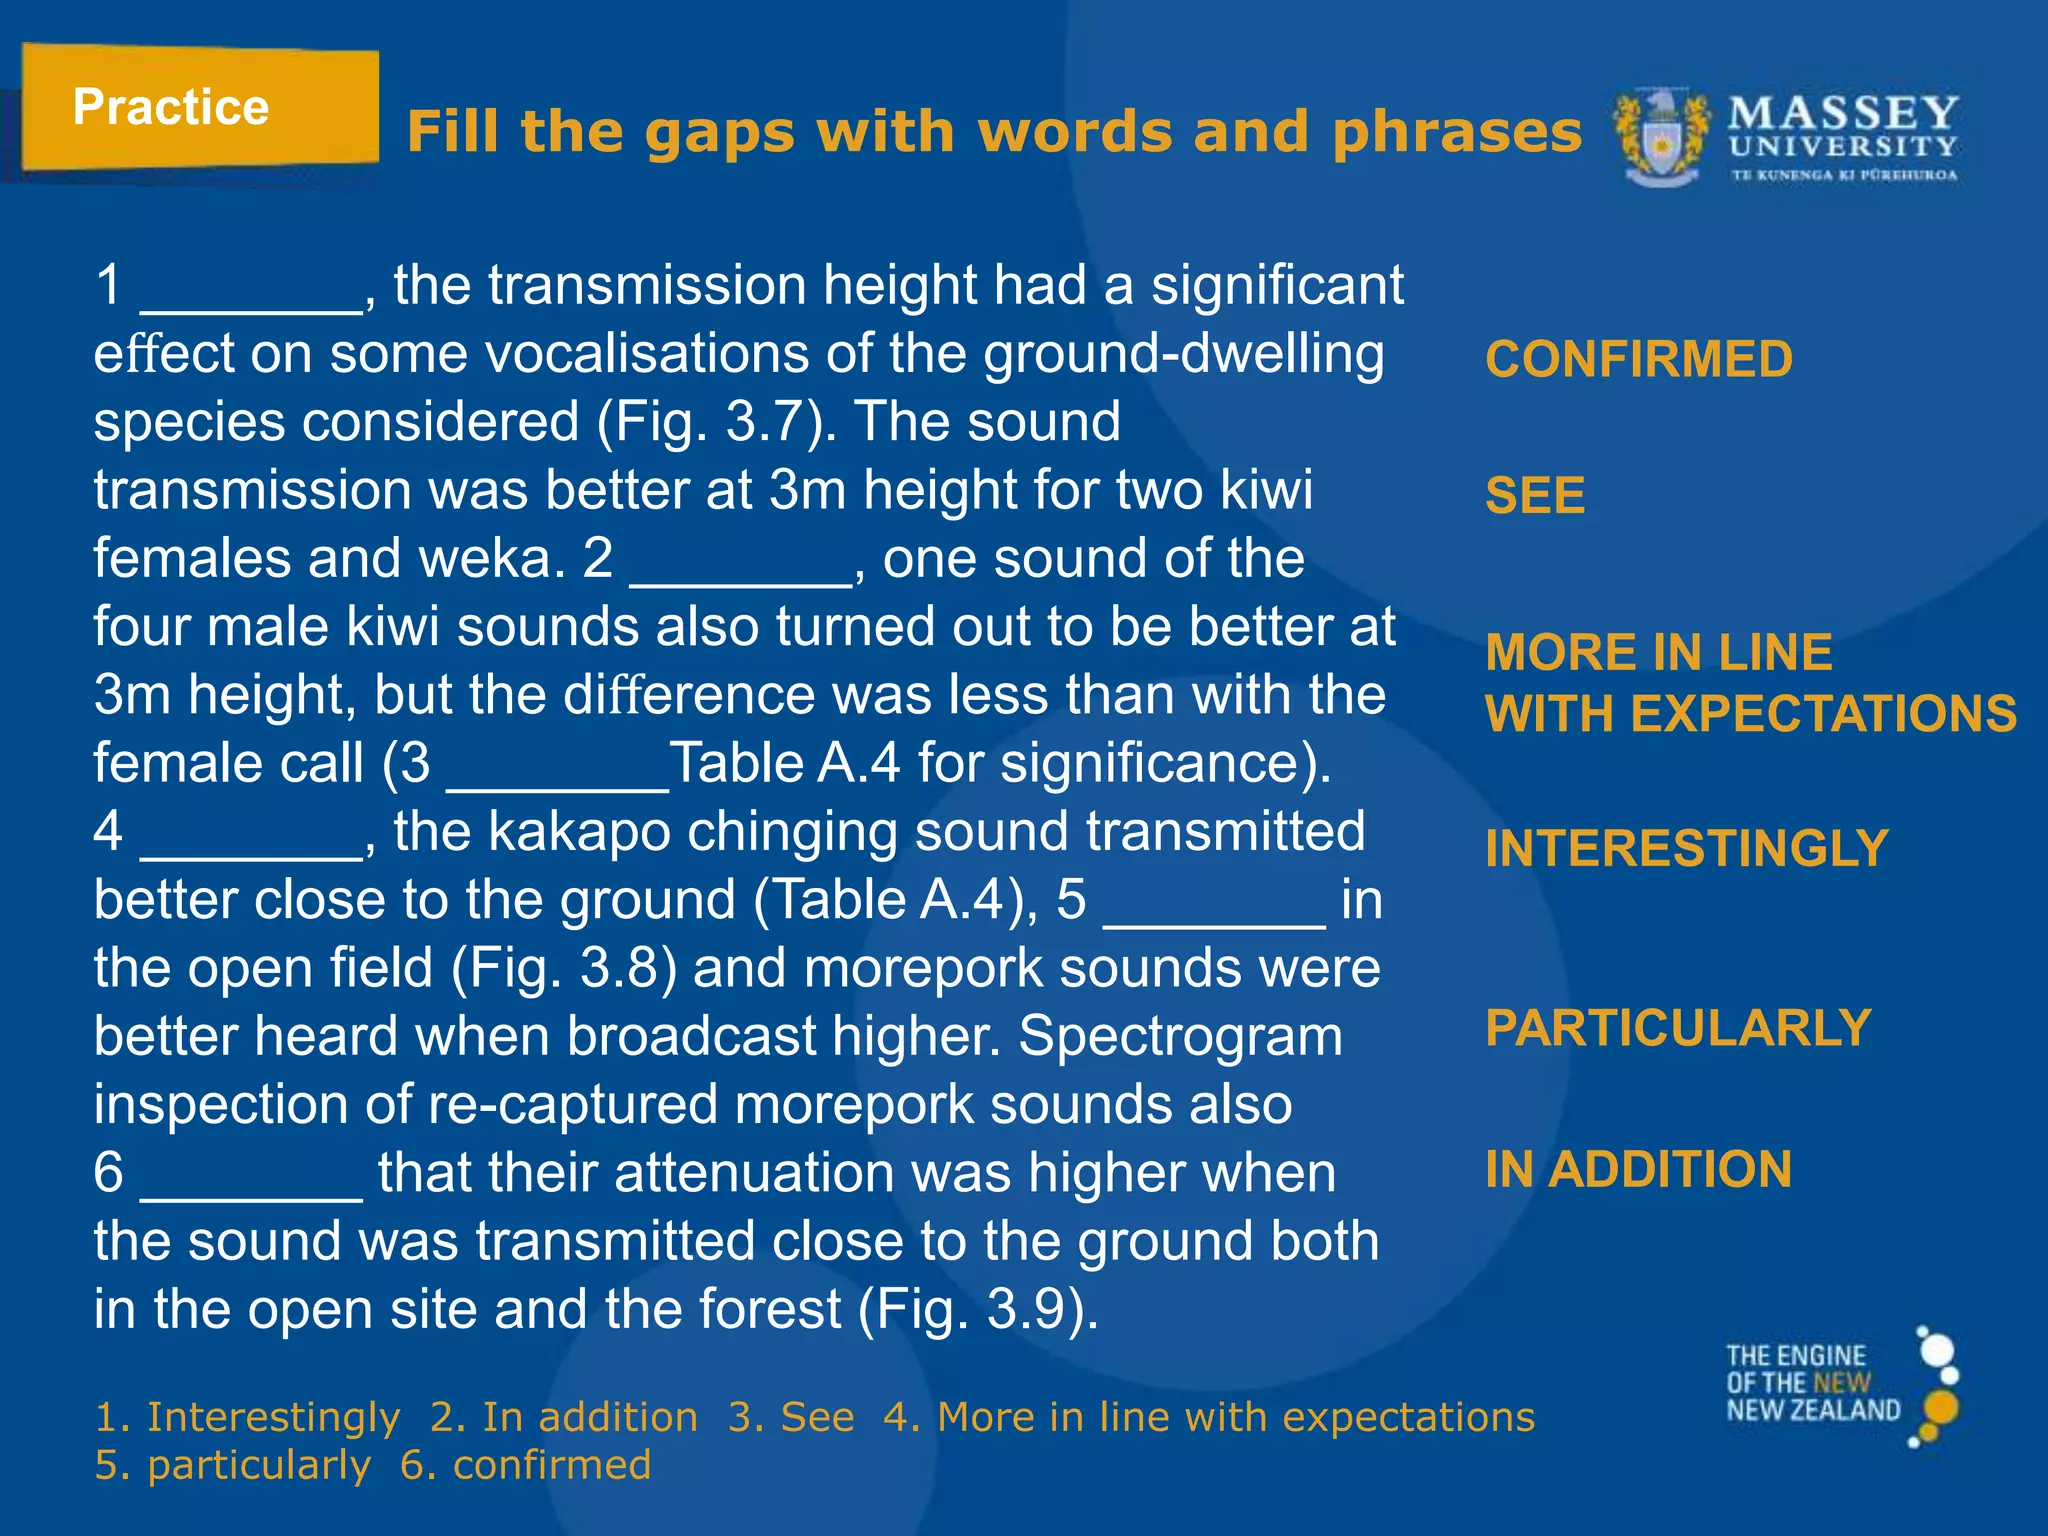
Emphasizes the relationship between text and visuals, methodology comparison, and explaining findings with examples.
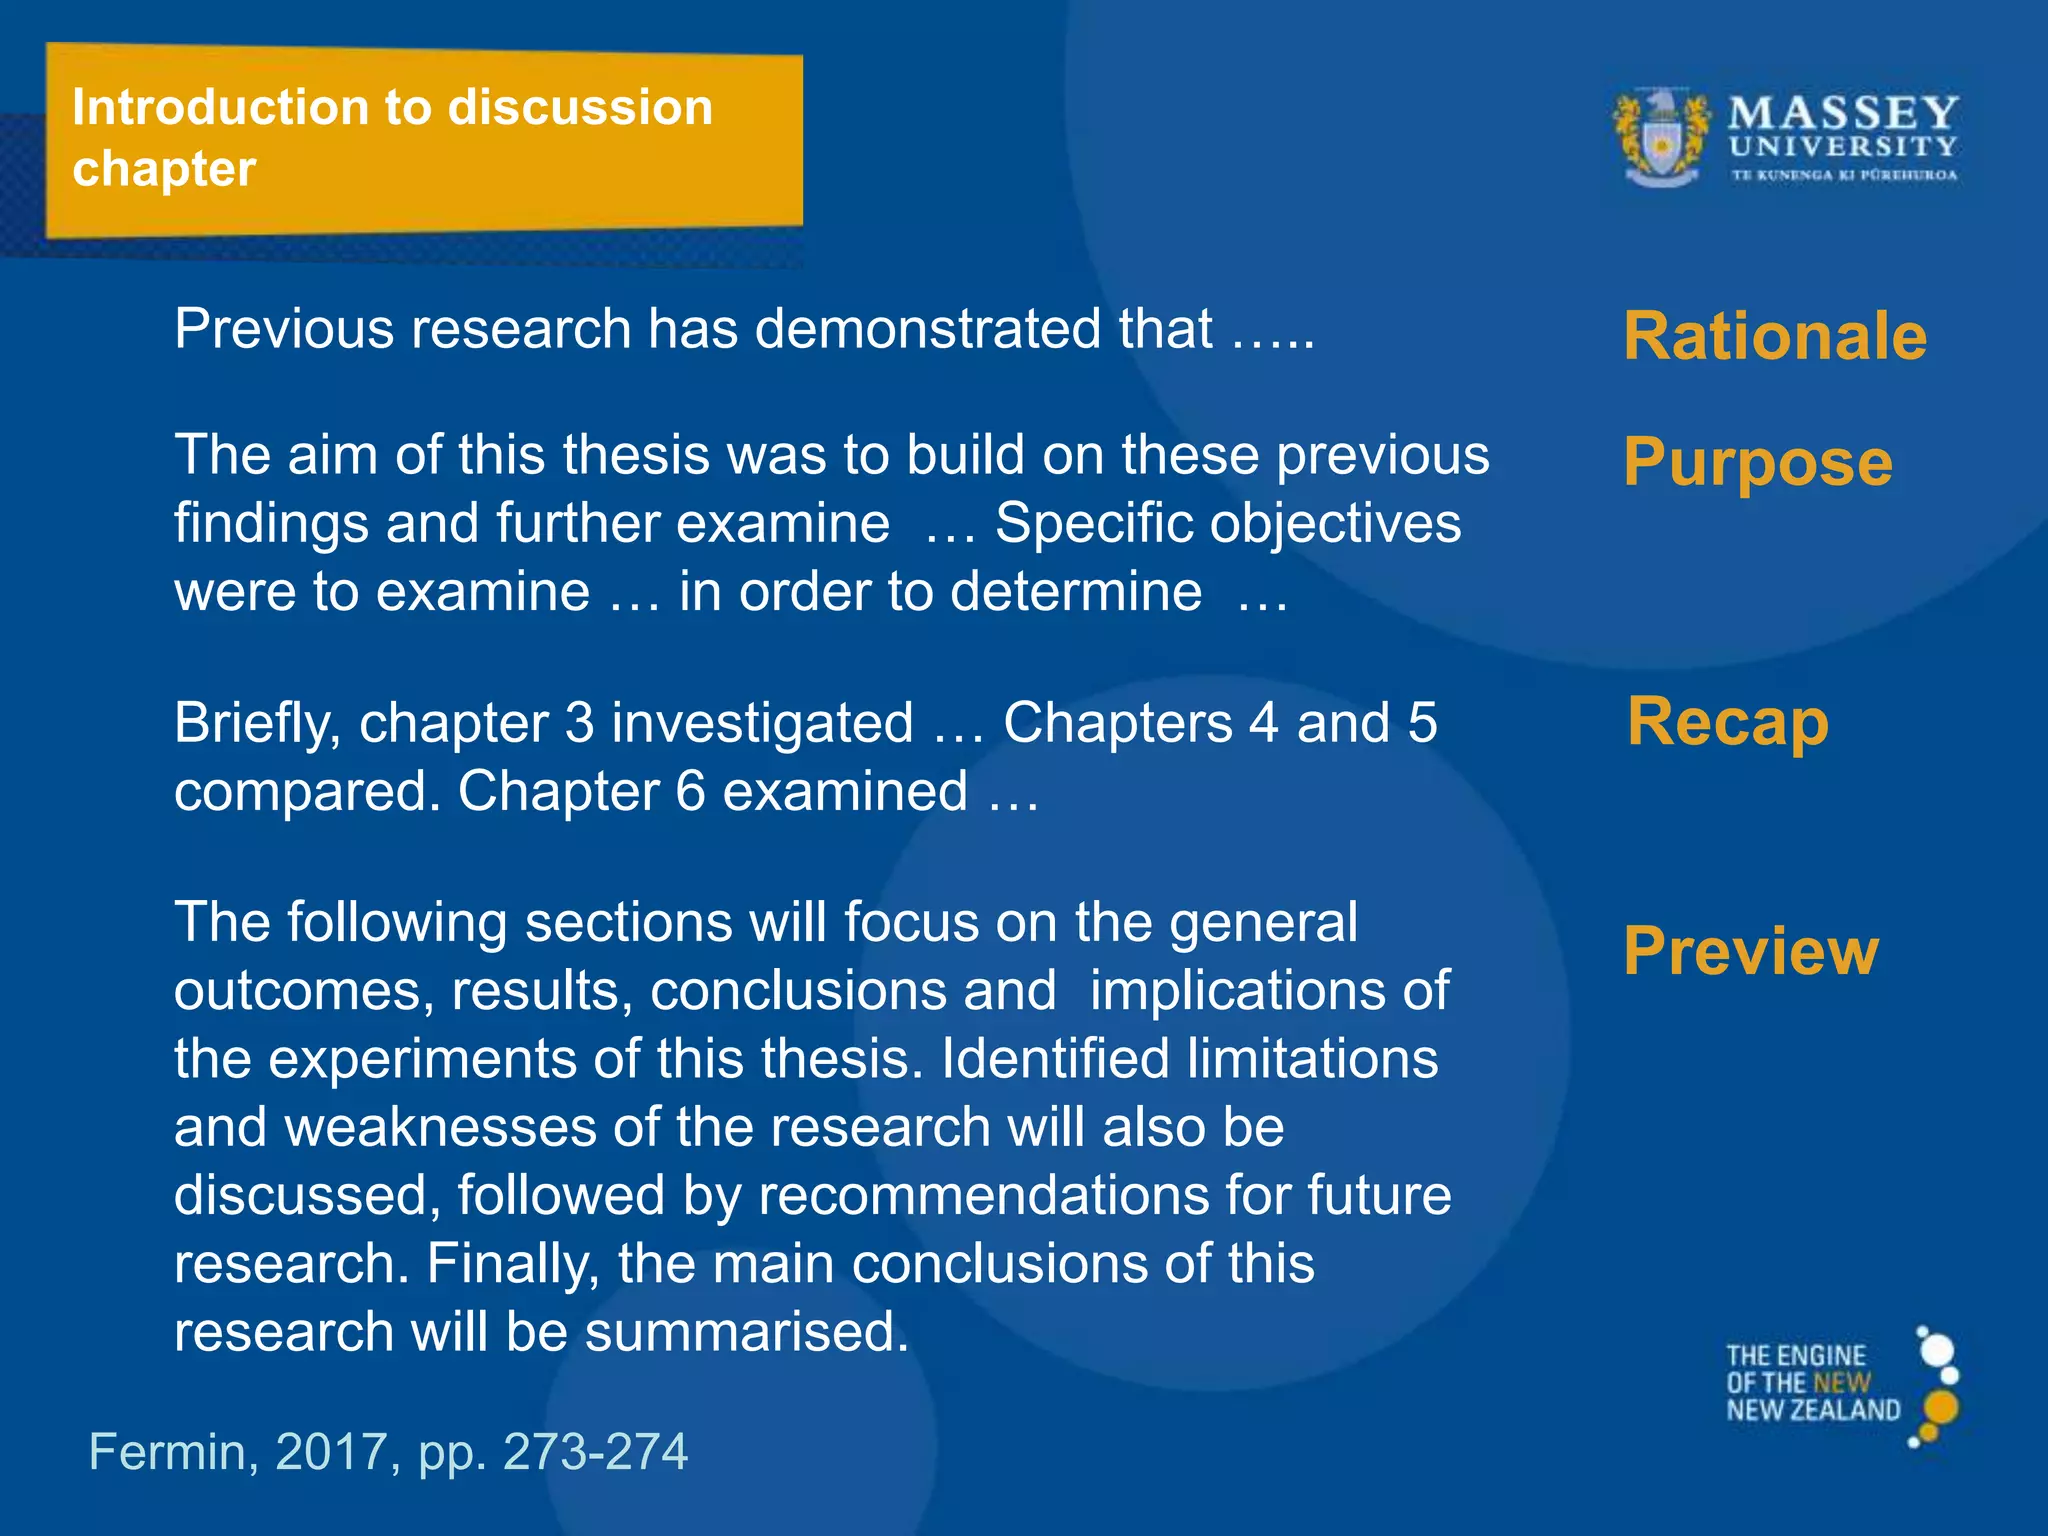
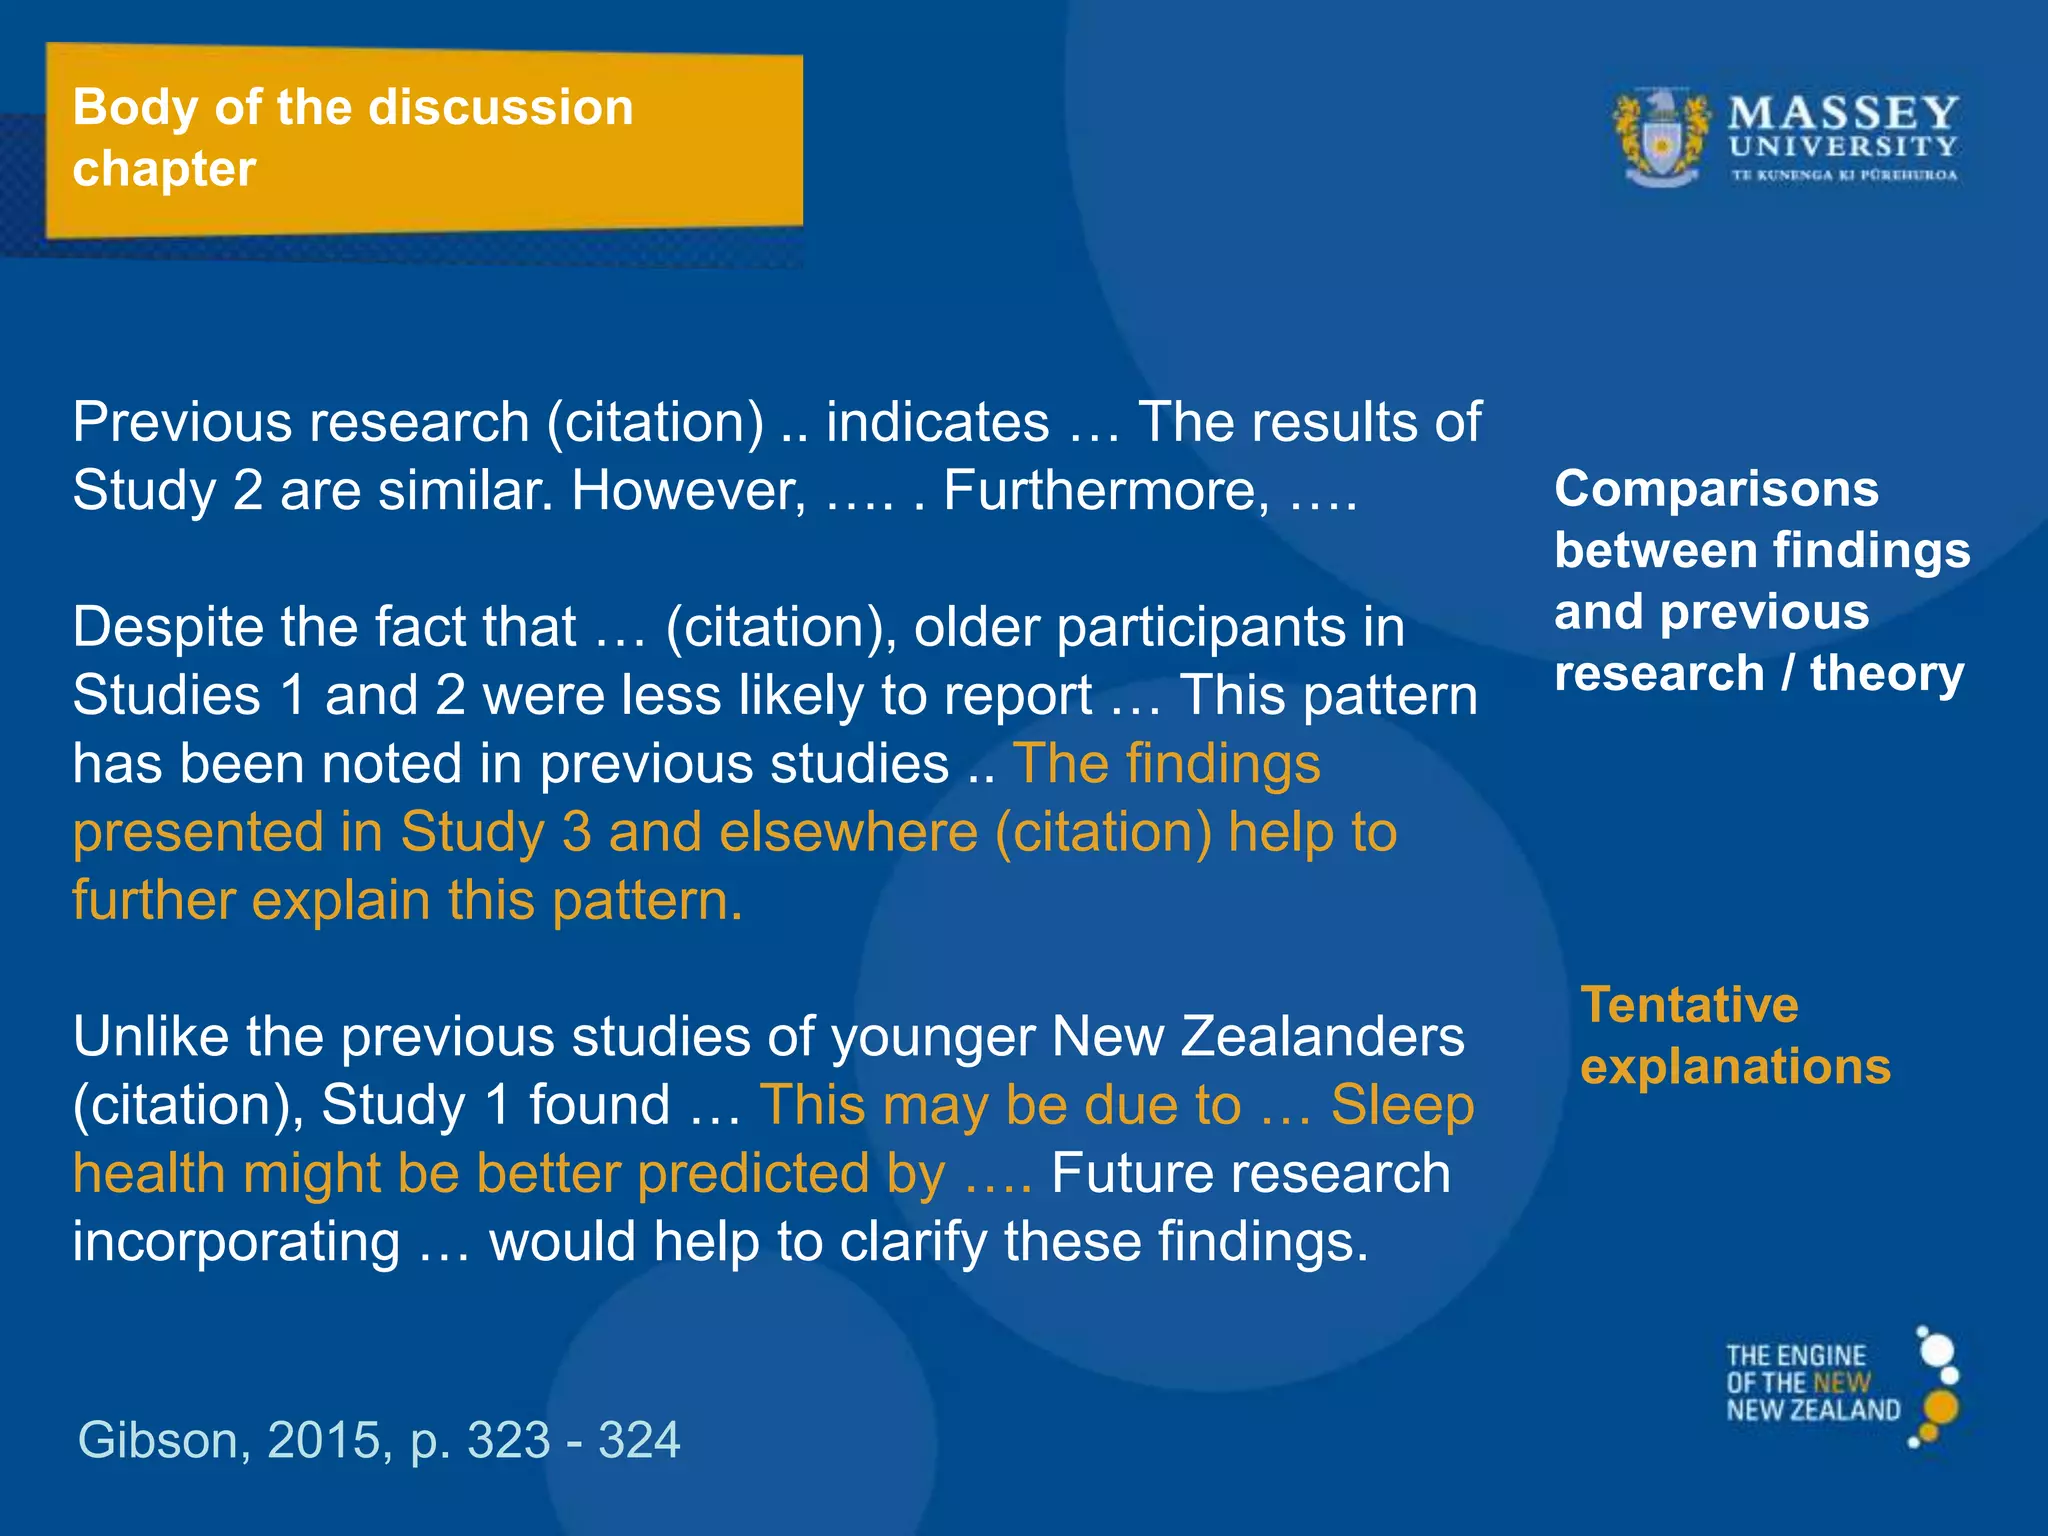
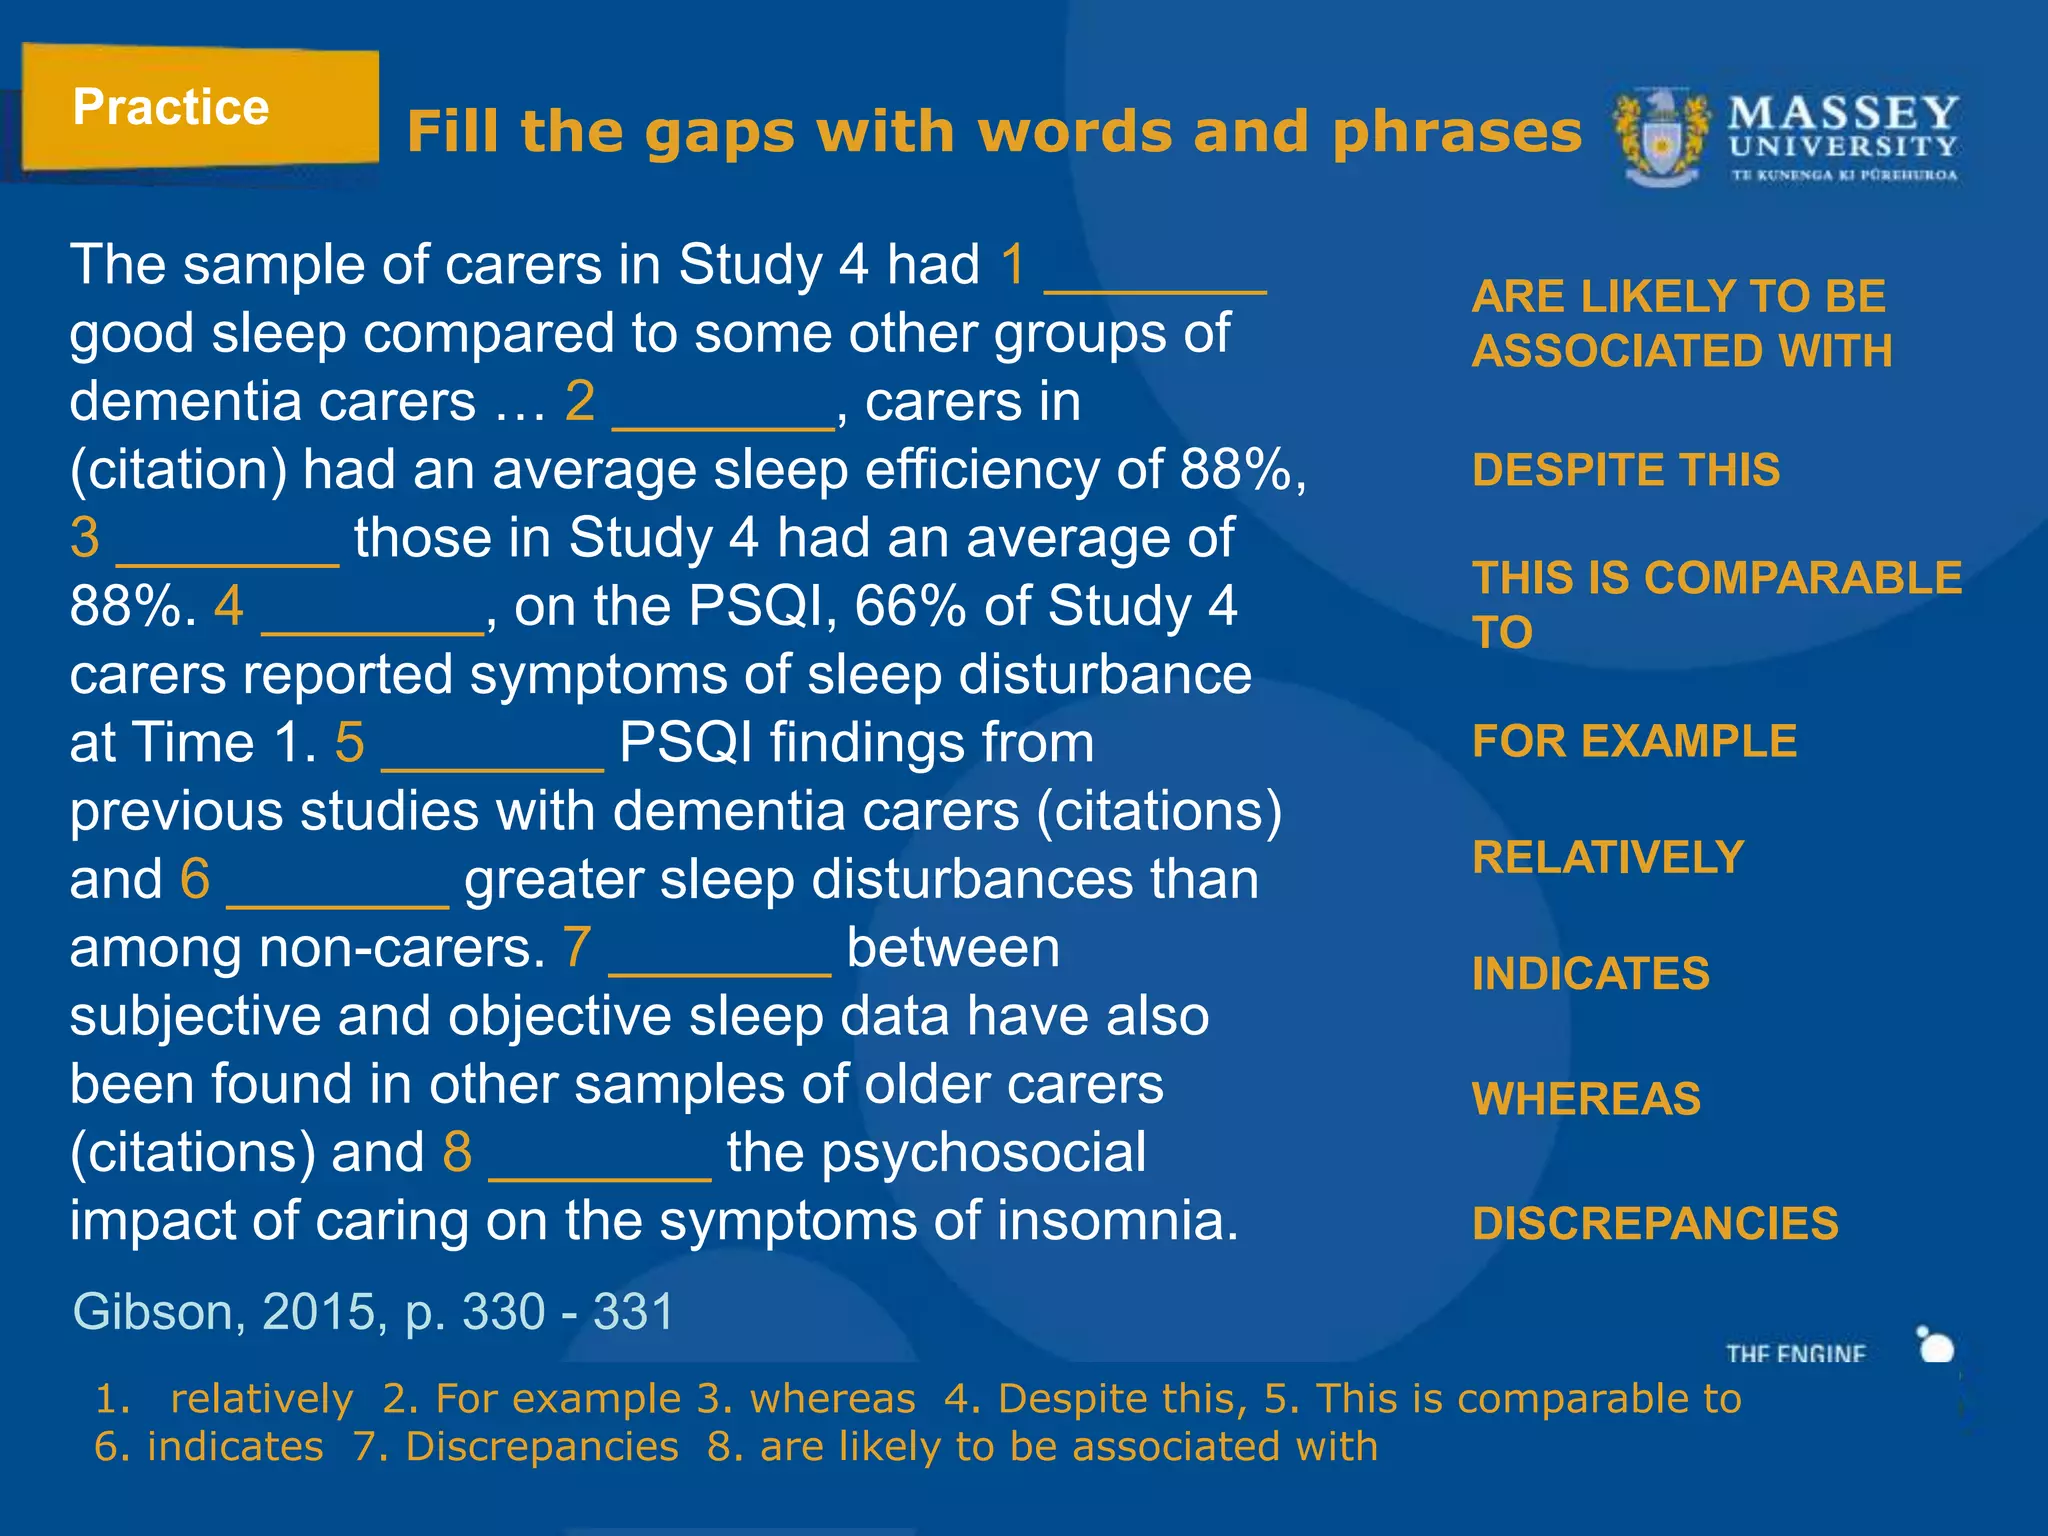
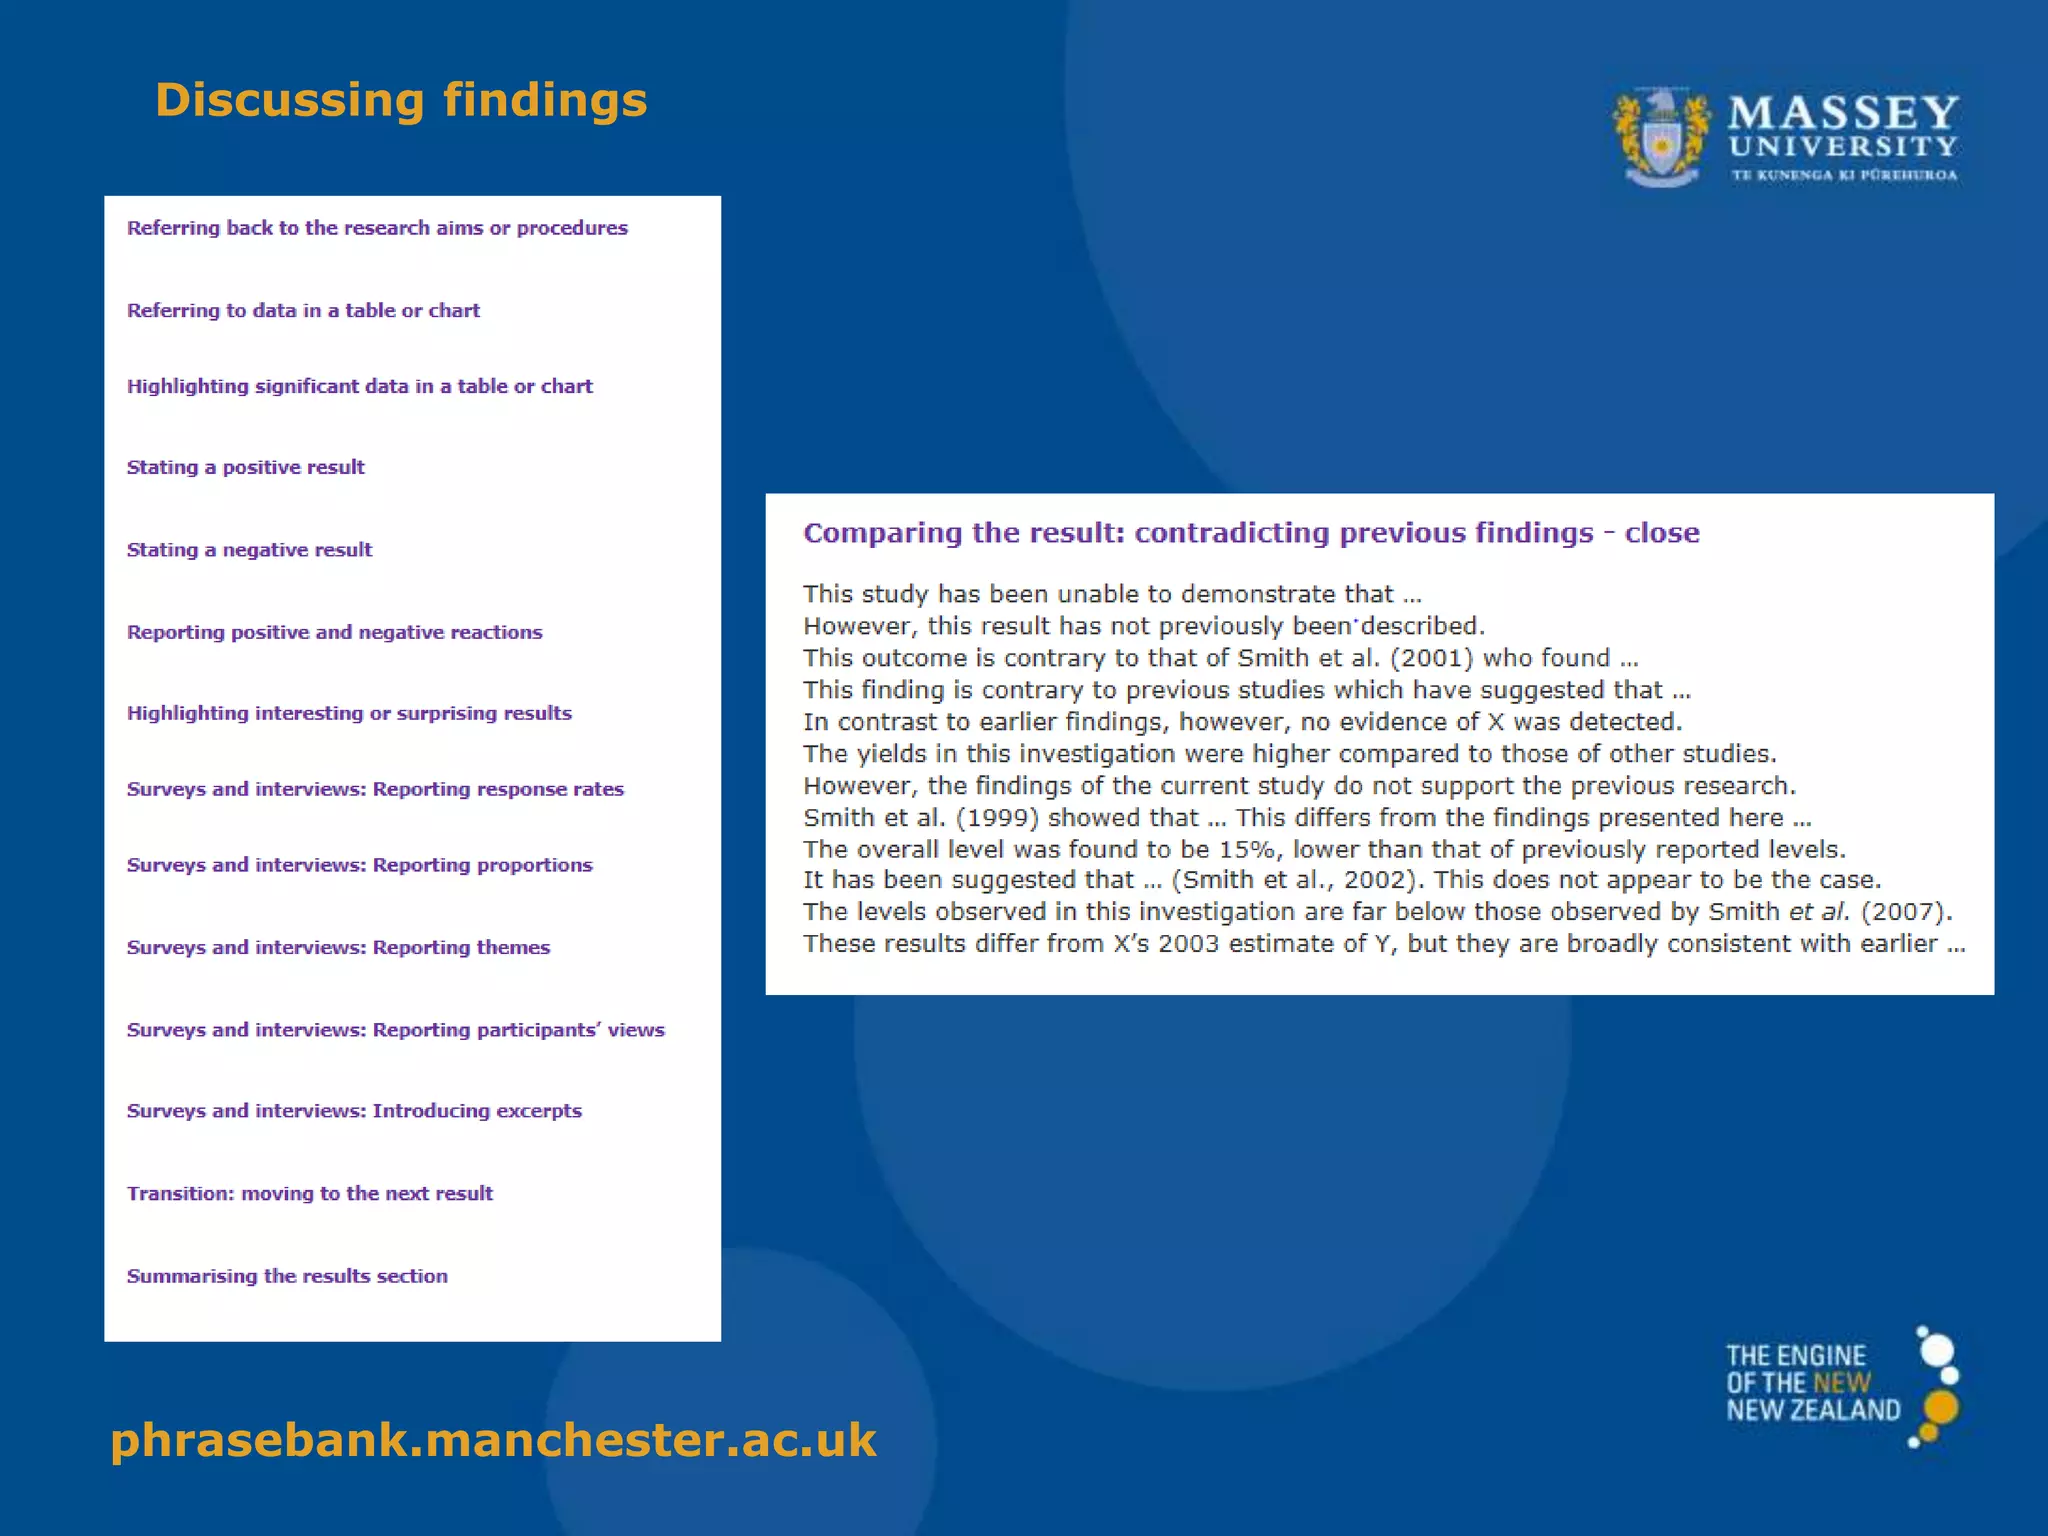
Outlines styles for writing discussions, including referencing previous research and drafting conclusions.
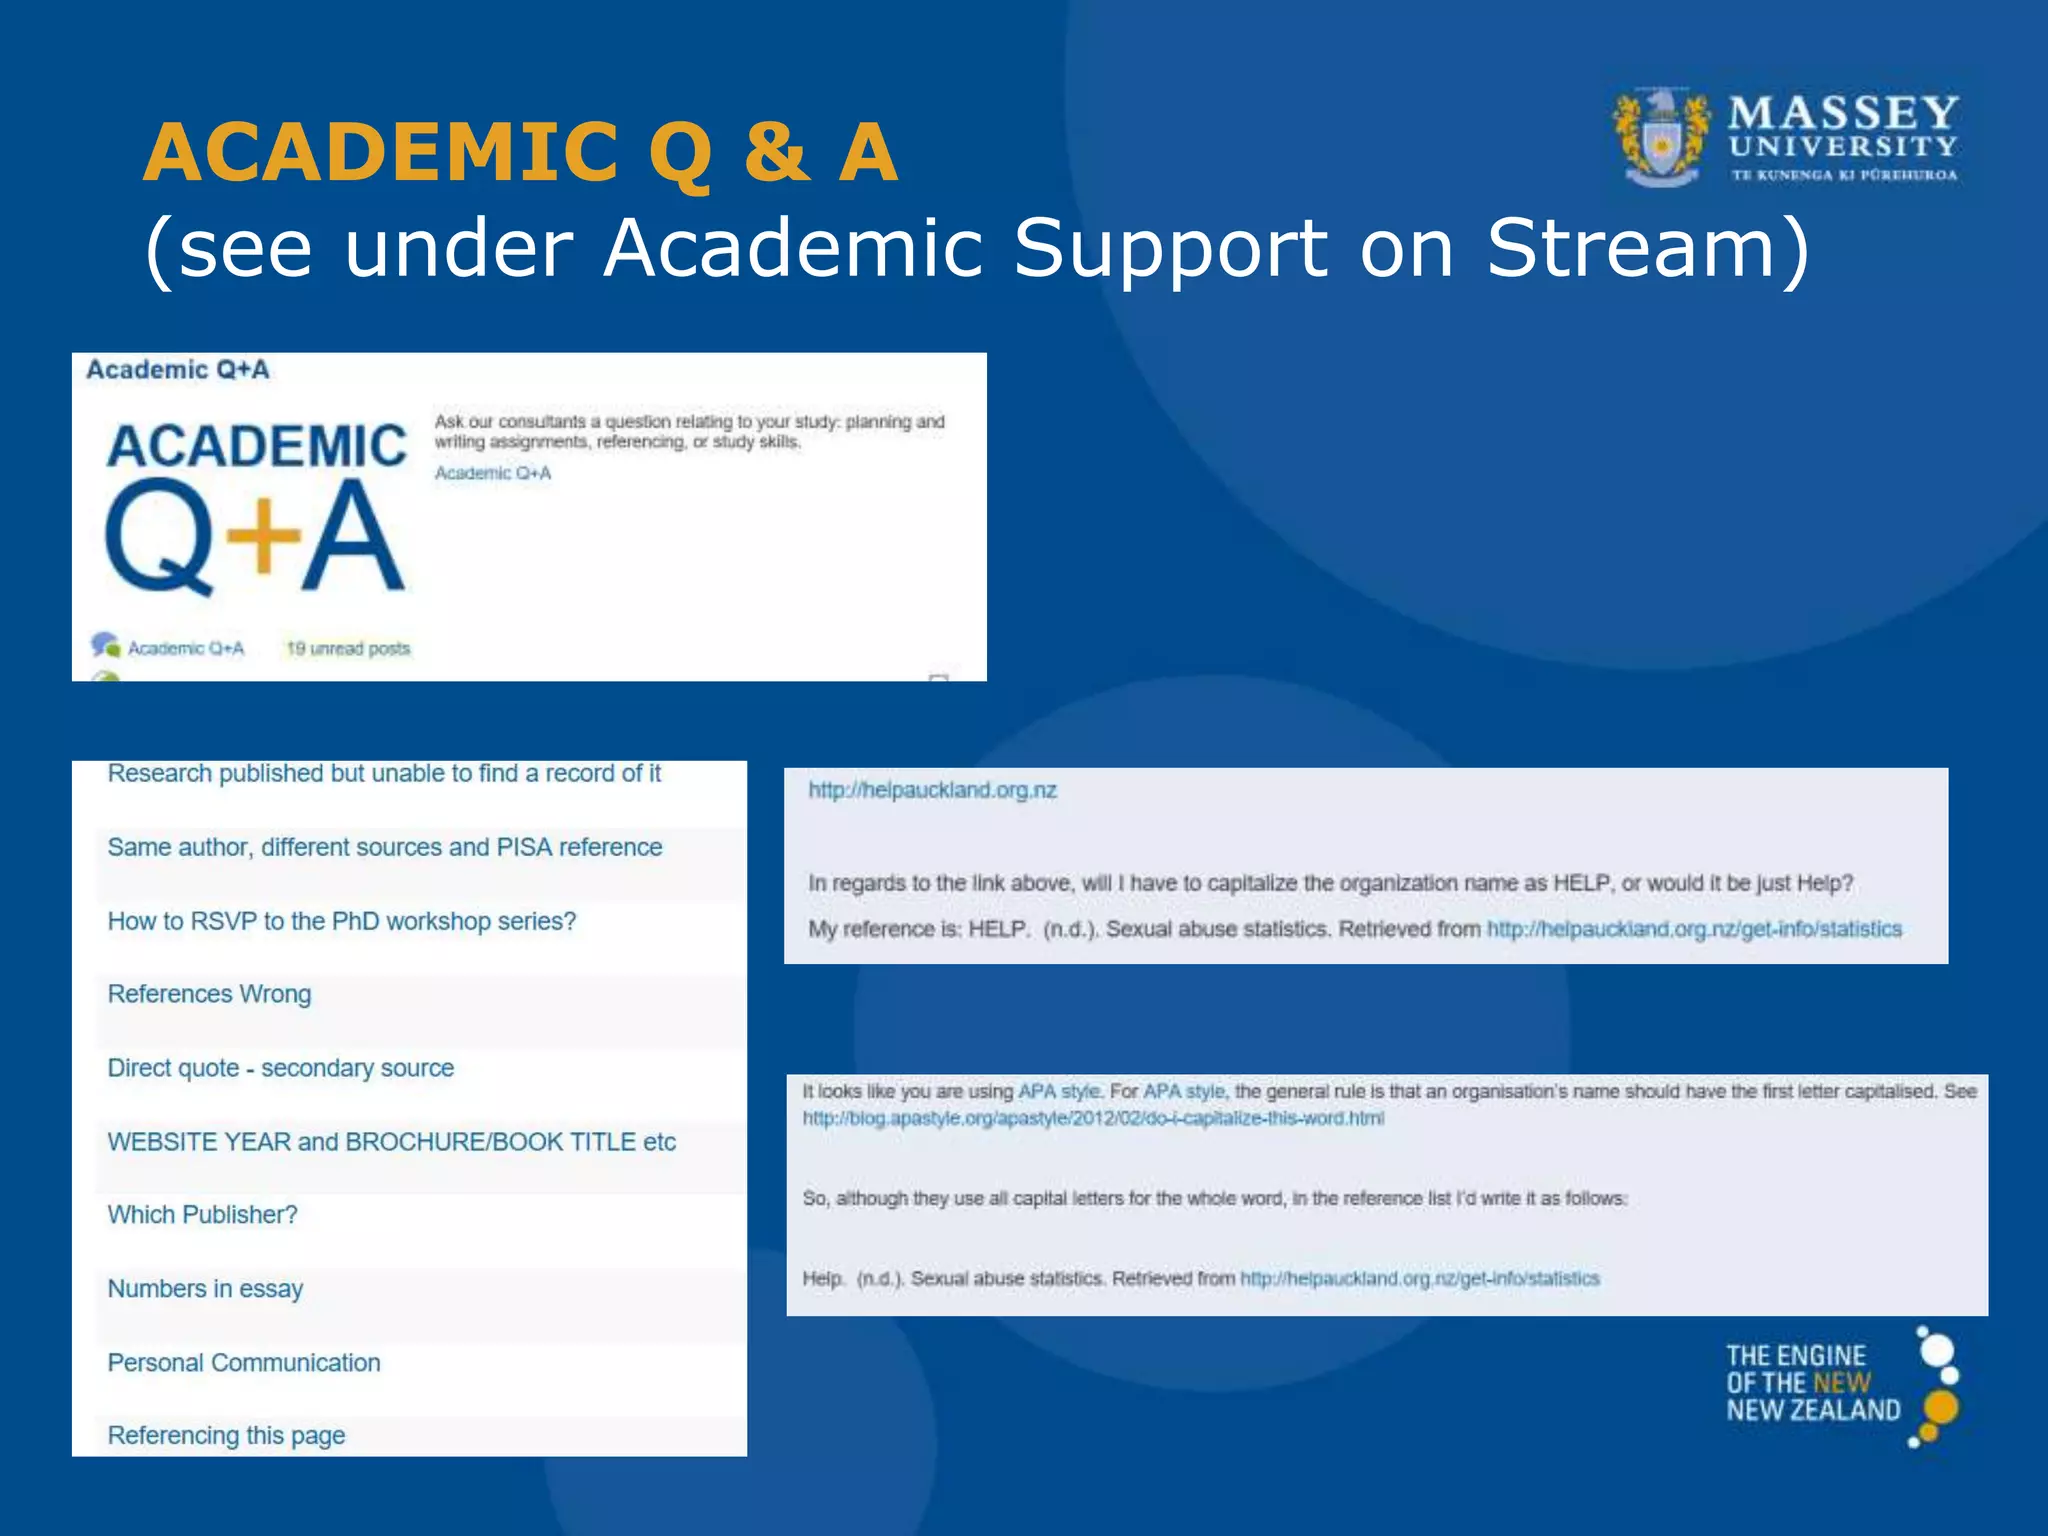
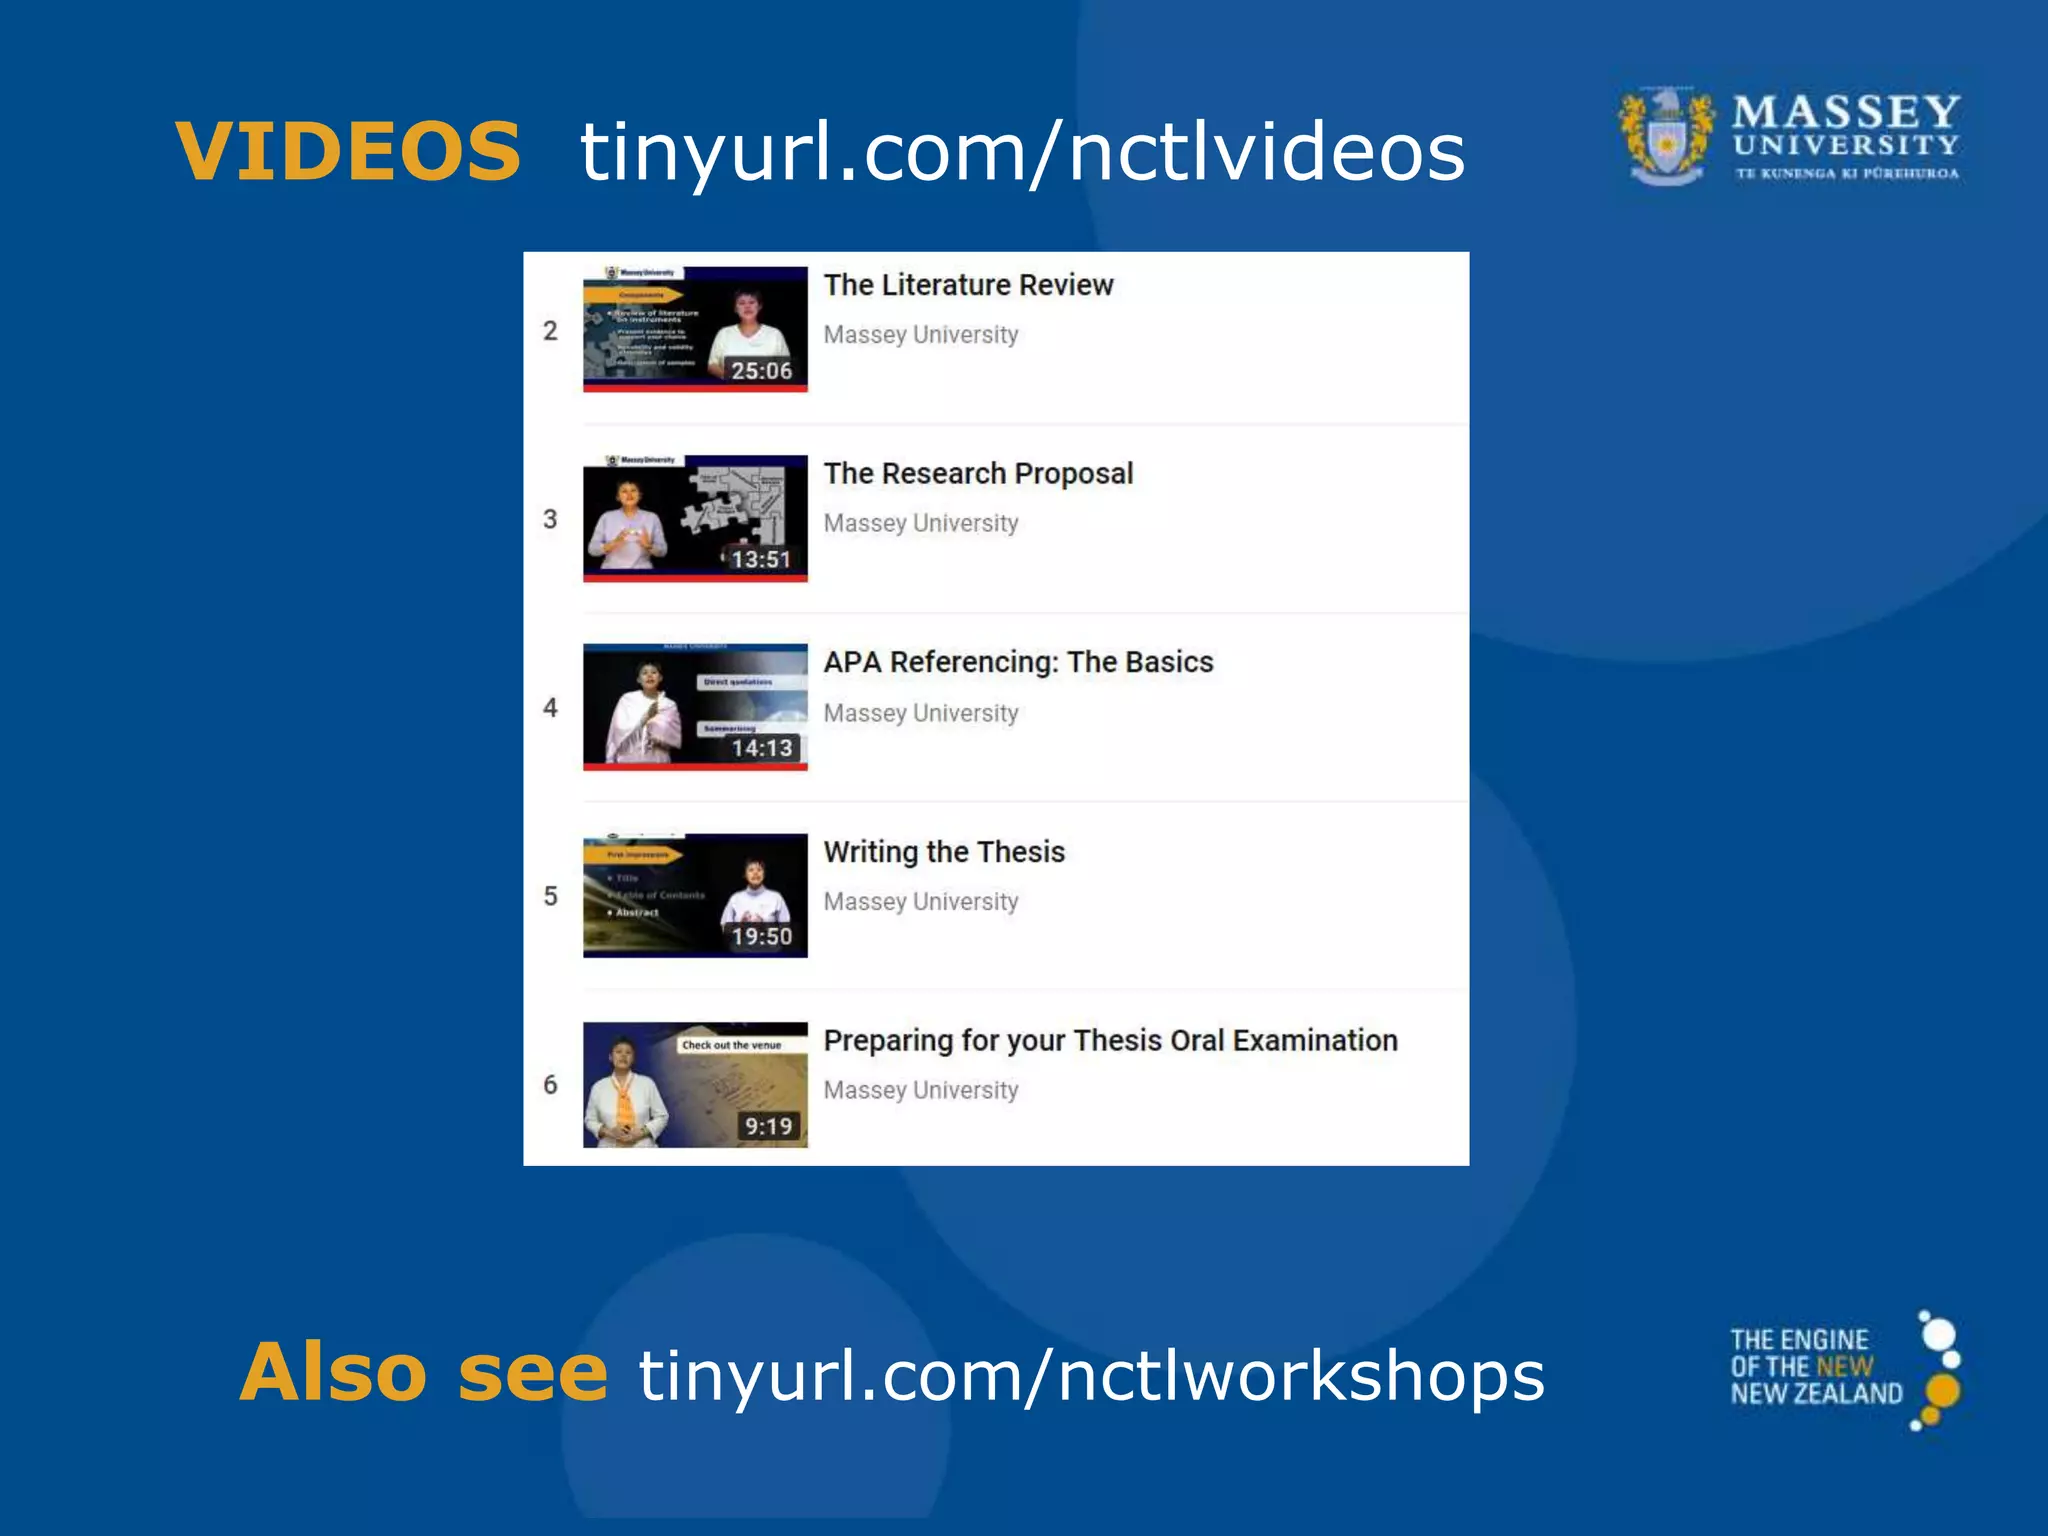
Lists resources available for academic support, including workshops, videos, and library services with links.