Here are the key points about the scope of statistics:
- Statistics is the science of collecting, organizing, summarizing, presenting, analyzing and interpreting data. It deals with data related to populations and samples.
- The scope of statistics is very wide as it is applicable to almost all areas of knowledge like physical, biological and social sciences. It helps in decision making in these fields.
- Some key areas where statistics is applied include business, economics, demography, medicine, public health, psychology, education, agriculture etc. It aids research in these domains.
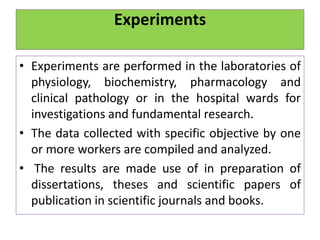
- Statistical techniques help describe, analyze, make inferences and predictions based on data in various applications like surveys, experiments, censuses, records etc. This
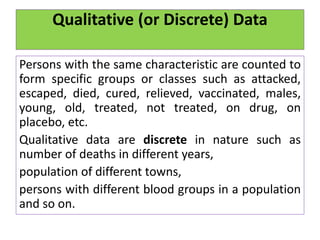
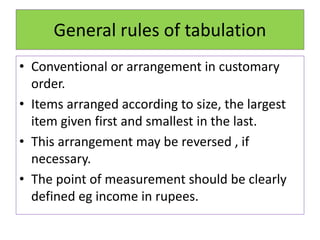
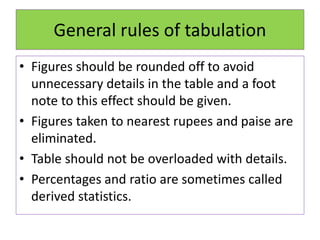
![General rules of tabulation
• The table should suit the size of the paper usually
with more rows than columns.
• In all tables the caption and stubs are arranged in
the systematic order.
• Alphabetical –arrangements according to
alphabet.
• Chronological- arrangement according to time
[historical data] [ review of literature ]
• Geographical- arrangement of data in certain
territorial units such as countries, cities and
districts.](https://image.slidesharecdn.com/frequencydistribution432021-210310090959/85/Frequency-distribution432021-26-320.jpg)
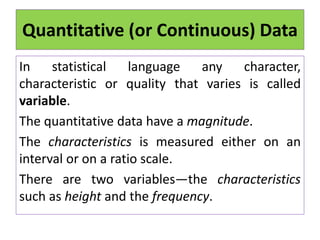
![• Indicate a zero quantity by zero and not by 0
to indicate the information which is not
available. [ not available or by - ]
• Abbreviations should be avoided especially in
titles and headings.
• Do not use ditto mark. If figure is repeated
show it each time. A ditto mark can be
mistaken as number 11.
General rules of tabulation](https://image.slidesharecdn.com/frequencydistribution432021-210310090959/85/Frequency-distribution432021-29-320.jpg)
![i]Simple or one way table](https://image.slidesharecdn.com/frequencydistribution432021-210310090959/85/Frequency-distribution432021-31-320.jpg)
![ii] Two way table](https://image.slidesharecdn.com/frequencydistribution432021-210310090959/85/Frequency-distribution432021-32-320.jpg)
![iii]Higher order table
• When three or more characteristics are
represented in the same table, such table is
called a high order table.
• Number of characteristics represented
increases the table become more and more
confusing.](https://image.slidesharecdn.com/frequencydistribution432021-210310090959/85/Frequency-distribution432021-33-320.jpg)