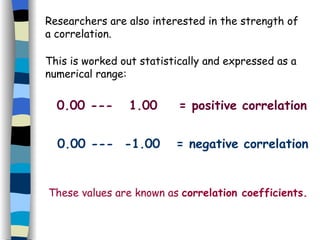
Correlation A descriptive statistical technique that measures the relationships between variables. The purpose is to see whether there is a trend or a pattern between variables  i.e. if changes in one variable are related to changes in the other variable.
Positive Correlation The variables rise and fall in direct relationship.  Measures the extent to which: High values on one variable are associated with high values on another.   OR Low values on one variable are associated with low values on another.
Negative Correlation As one variable rises another falls and vice versa Measures the extent to which: High values on one variable are associated with low values on another.   OR Low values on one variable are associated with high values on another. This is known as the  direction  of correlation.
Activity: Caldwell AS level page 242. -Write the headings Positive Correlation and Negative Correlation. -Write out correlations 1-10 fully under the correct headings.
Activity: Using Higher text book pages 137-138 -describe Directional /non-directional correlation hypotheses (with examples). -describe the appropriate null correlation hypotheses. produce three scattergrams typical of:  zero correlation positive correlation negative correlation
Researchers are also interested in the strength of a correlation. This is worked out statistically and expressed as a numerical range: 0.00 ---  1.00  = positive correlation 0.00 ---  -1.00  = negative correlation These values are known as  correlation coefficients.
Activity: Using the Higher Text book page 144-5 - Evaluate the use of correlation designs. Unit 2: Summary so far… Make a ‘contents style’ page for all the topics we have covered so far. e.g.  Variables -IV, DV, Conditions etc   Hypotheses Directional, non directional, null   Experiments Laboratory…etc.

7. Correlation

  • 1.
    Correlation A descriptivestatistical technique that measures the relationships between variables. The purpose is to see whether there is a trend or a pattern between variables i.e. if changes in one variable are related to changes in the other variable.
  • 2.
    Positive Correlation Thevariables rise and fall in direct relationship. Measures the extent to which: High values on one variable are associated with high values on another. OR Low values on one variable are associated with low values on another.
  • 3.
    Negative Correlation Asone variable rises another falls and vice versa Measures the extent to which: High values on one variable are associated with low values on another. OR Low values on one variable are associated with high values on another. This is known as the direction of correlation.
  • 4.
    Activity: Caldwell ASlevel page 242. -Write the headings Positive Correlation and Negative Correlation. -Write out correlations 1-10 fully under the correct headings.
  • 5.
    Activity: Using Highertext book pages 137-138 -describe Directional /non-directional correlation hypotheses (with examples). -describe the appropriate null correlation hypotheses. produce three scattergrams typical of: zero correlation positive correlation negative correlation
  • 6.
    Researchers are alsointerested in the strength of a correlation. This is worked out statistically and expressed as a numerical range: 0.00 --- 1.00 = positive correlation 0.00 --- -1.00 = negative correlation These values are known as correlation coefficients.
  • 7.
    Activity: Using theHigher Text book page 144-5 - Evaluate the use of correlation designs. Unit 2: Summary so far… Make a ‘contents style’ page for all the topics we have covered so far. e.g. Variables -IV, DV, Conditions etc Hypotheses Directional, non directional, null Experiments Laboratory…etc.