Downloaded 98 times
![ Rho or e = 1- [ (6∑D2 ) / n(n2 – 1) ]
D= difference between X,Y ranks
assigned to the object.
n= number of observation](https://image.slidesharecdn.com/measuresofrelationships-140506114618-phpapp02/75/Measures-of-relationships-17-2048.jpg)
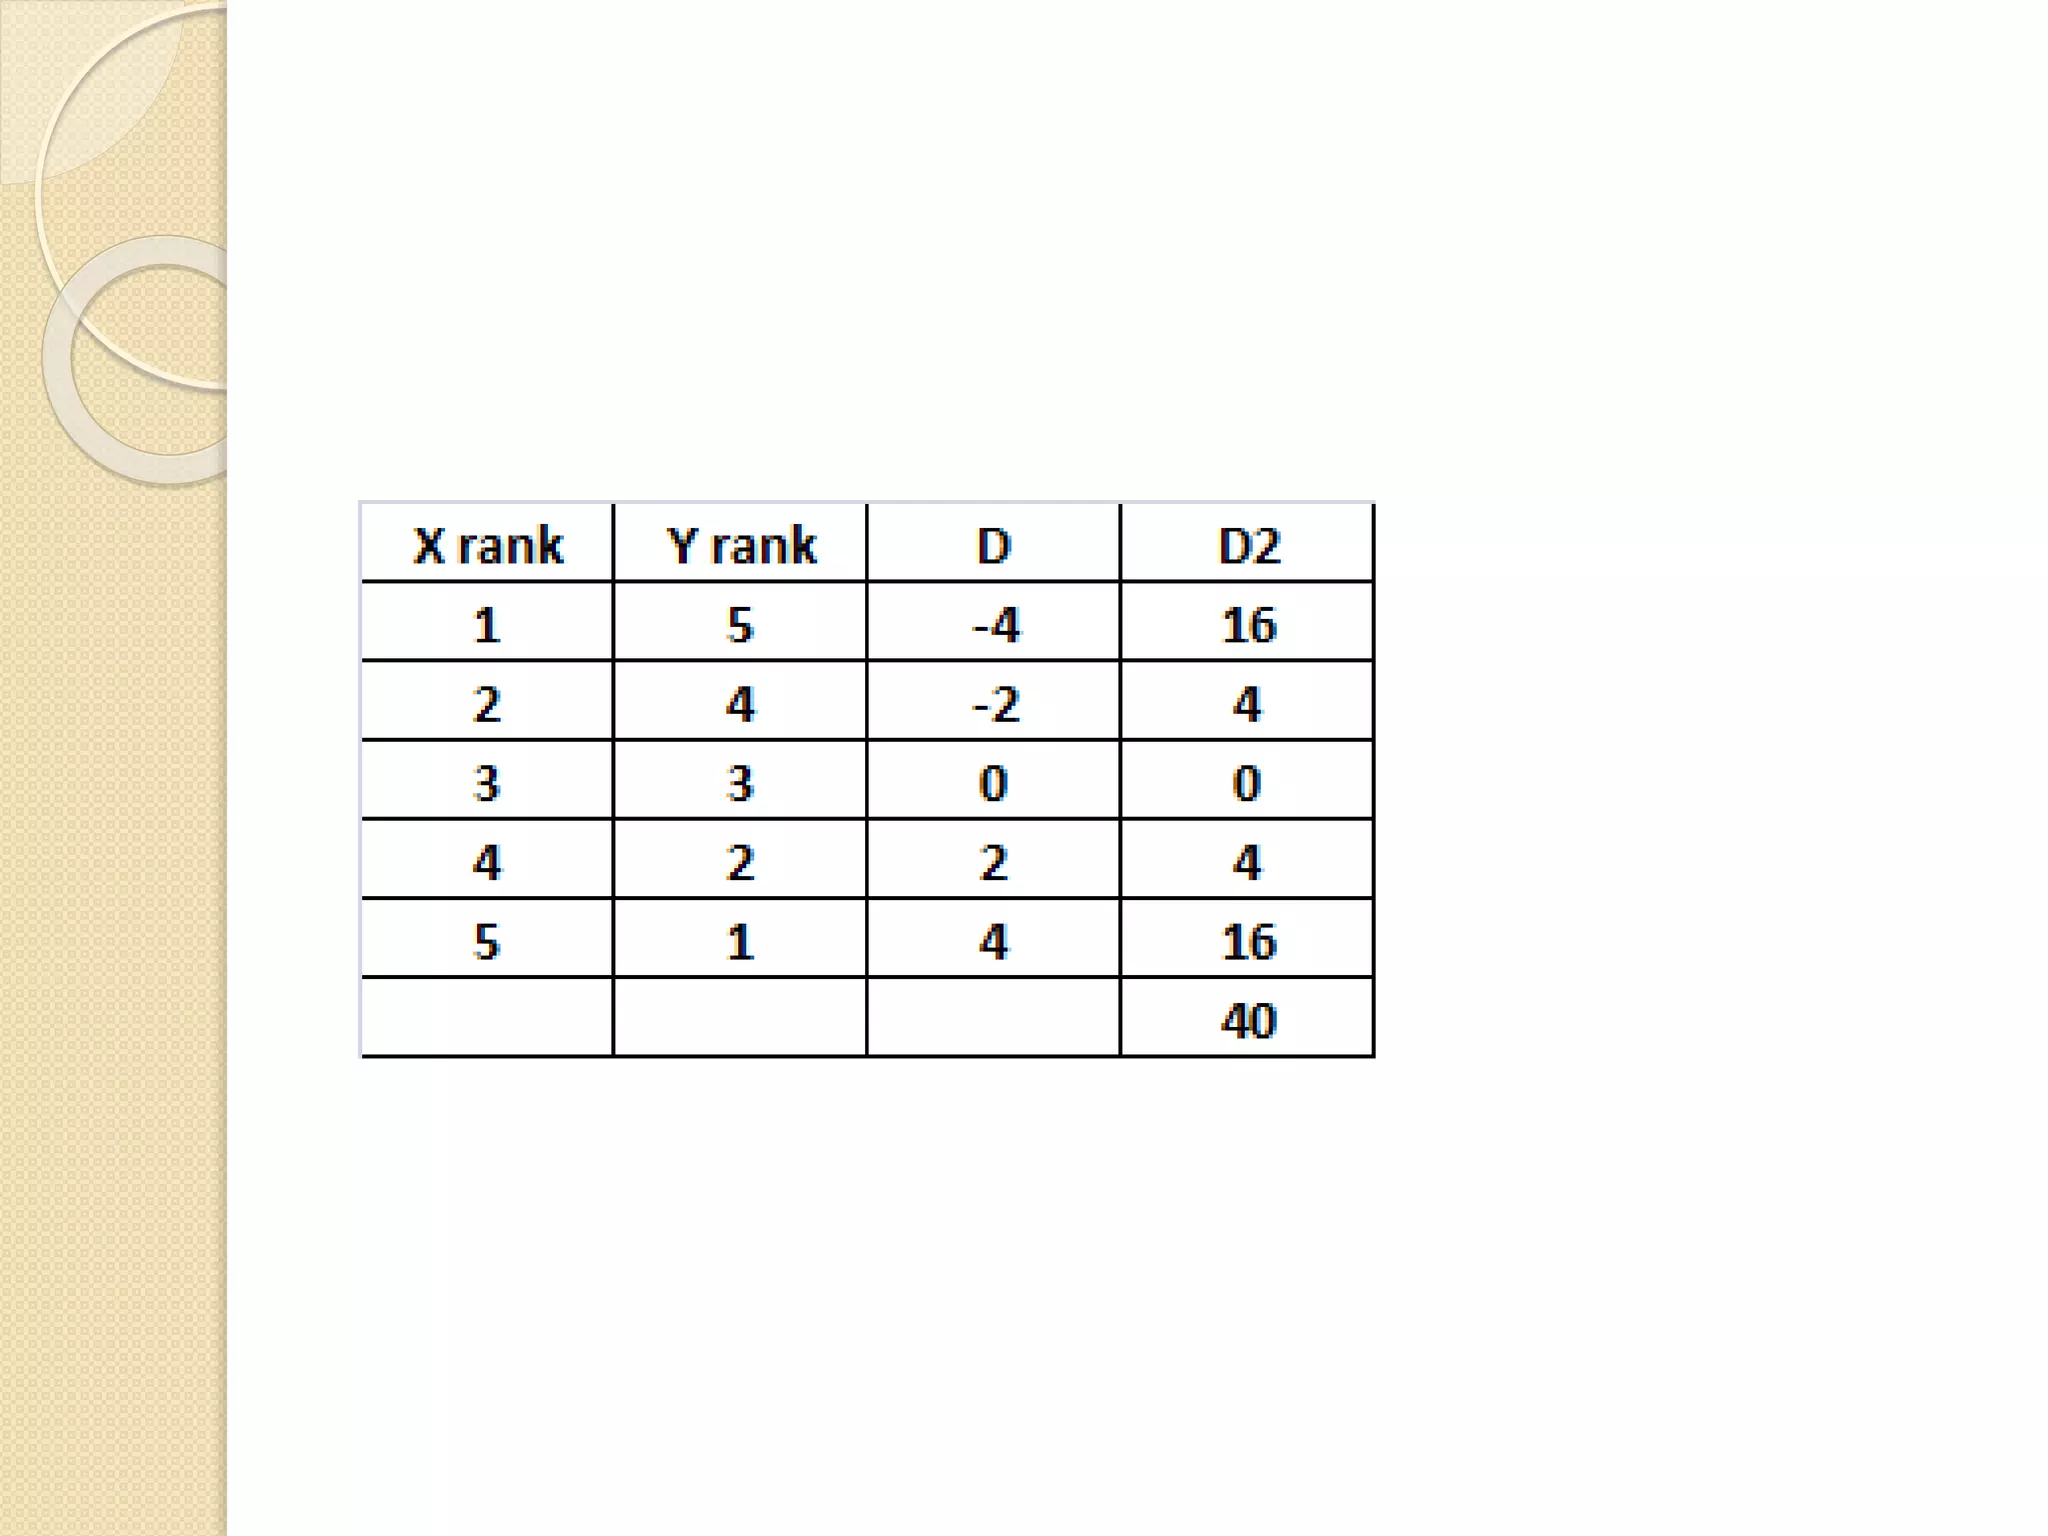
![ e= 1- [ (6∑D2 ) / n(n2 – 1) ]
=1-[(6*40)/ 5(52- 1) ]
= -1.0
This value – 1 indicates that there is perfect
negative association between the two sets
of ranks.](https://image.slidesharecdn.com/measuresofrelationships-140506114618-phpapp02/75/Measures-of-relationships-19-2048.jpg)


This document discusses different methods for measuring relationships between variables, including cross tabulation, percentage difference, Gamma, and Spearman's rank order correlation coefficient. It provides examples of each method and explains how to calculate and interpret them. Cross tabulation involves creating a two-way table to examine relationships between categorical variables. Gamma and Spearman's rank order correlation examine relationships between ordinal variables by comparing pairs of ranks. Pearson's correlation coefficient measures both the direction and strength of linear relationships between variables.
Covers the concept of assessing relationships between variables using methods like cross-tabulation, Gamma, and Spearman's correlation.
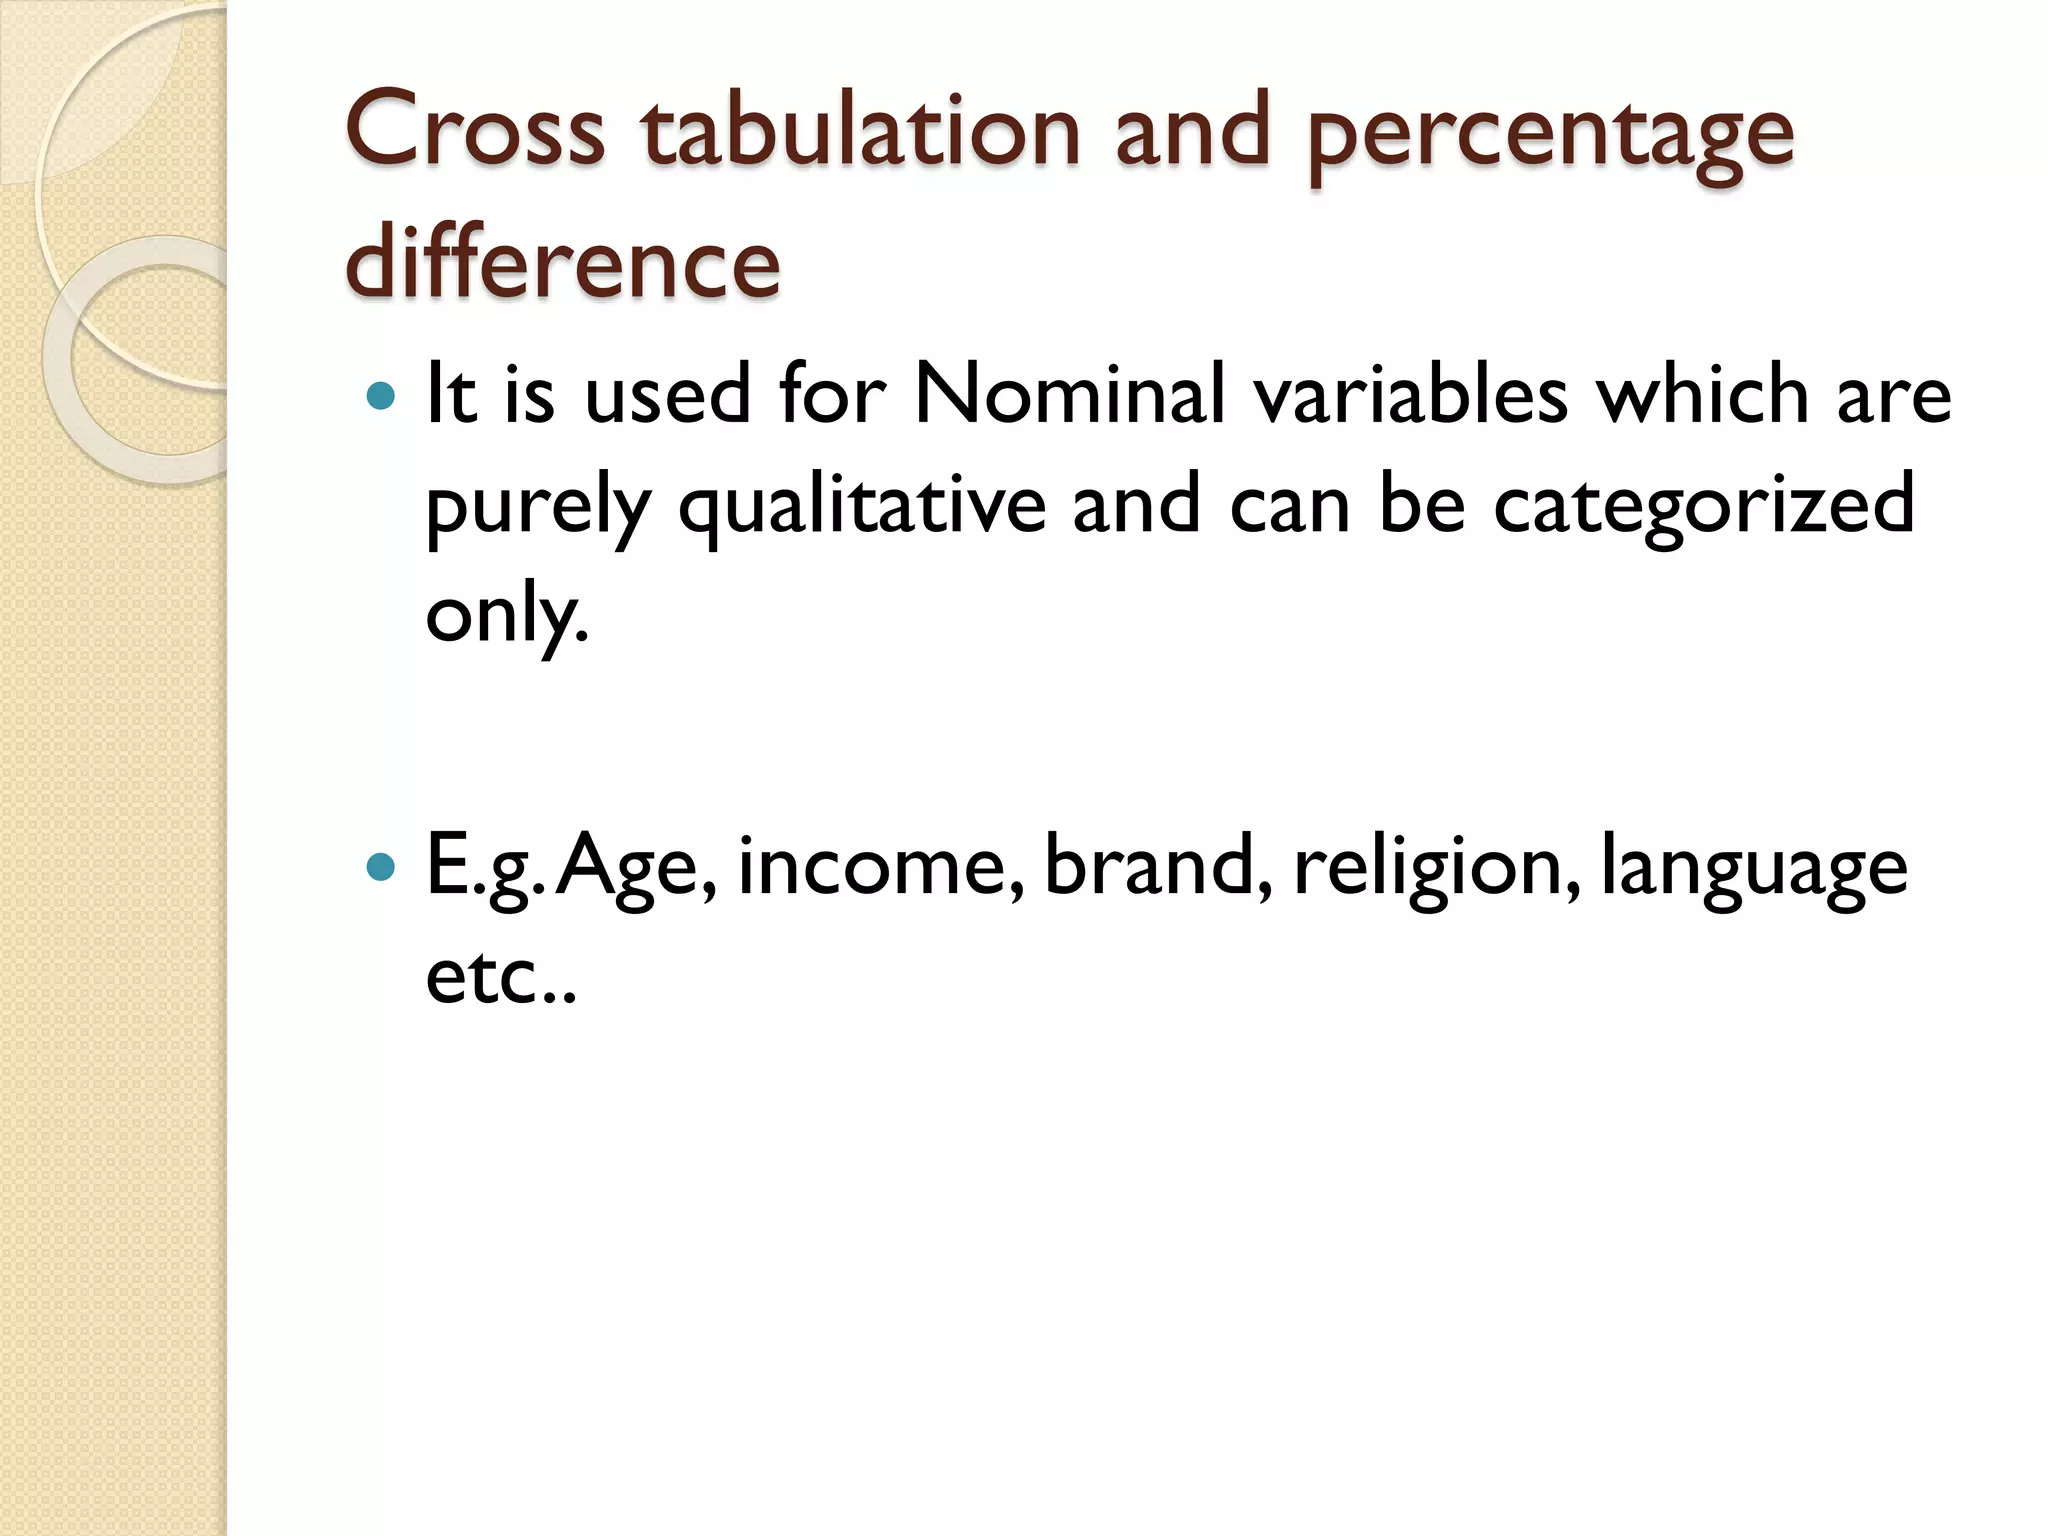
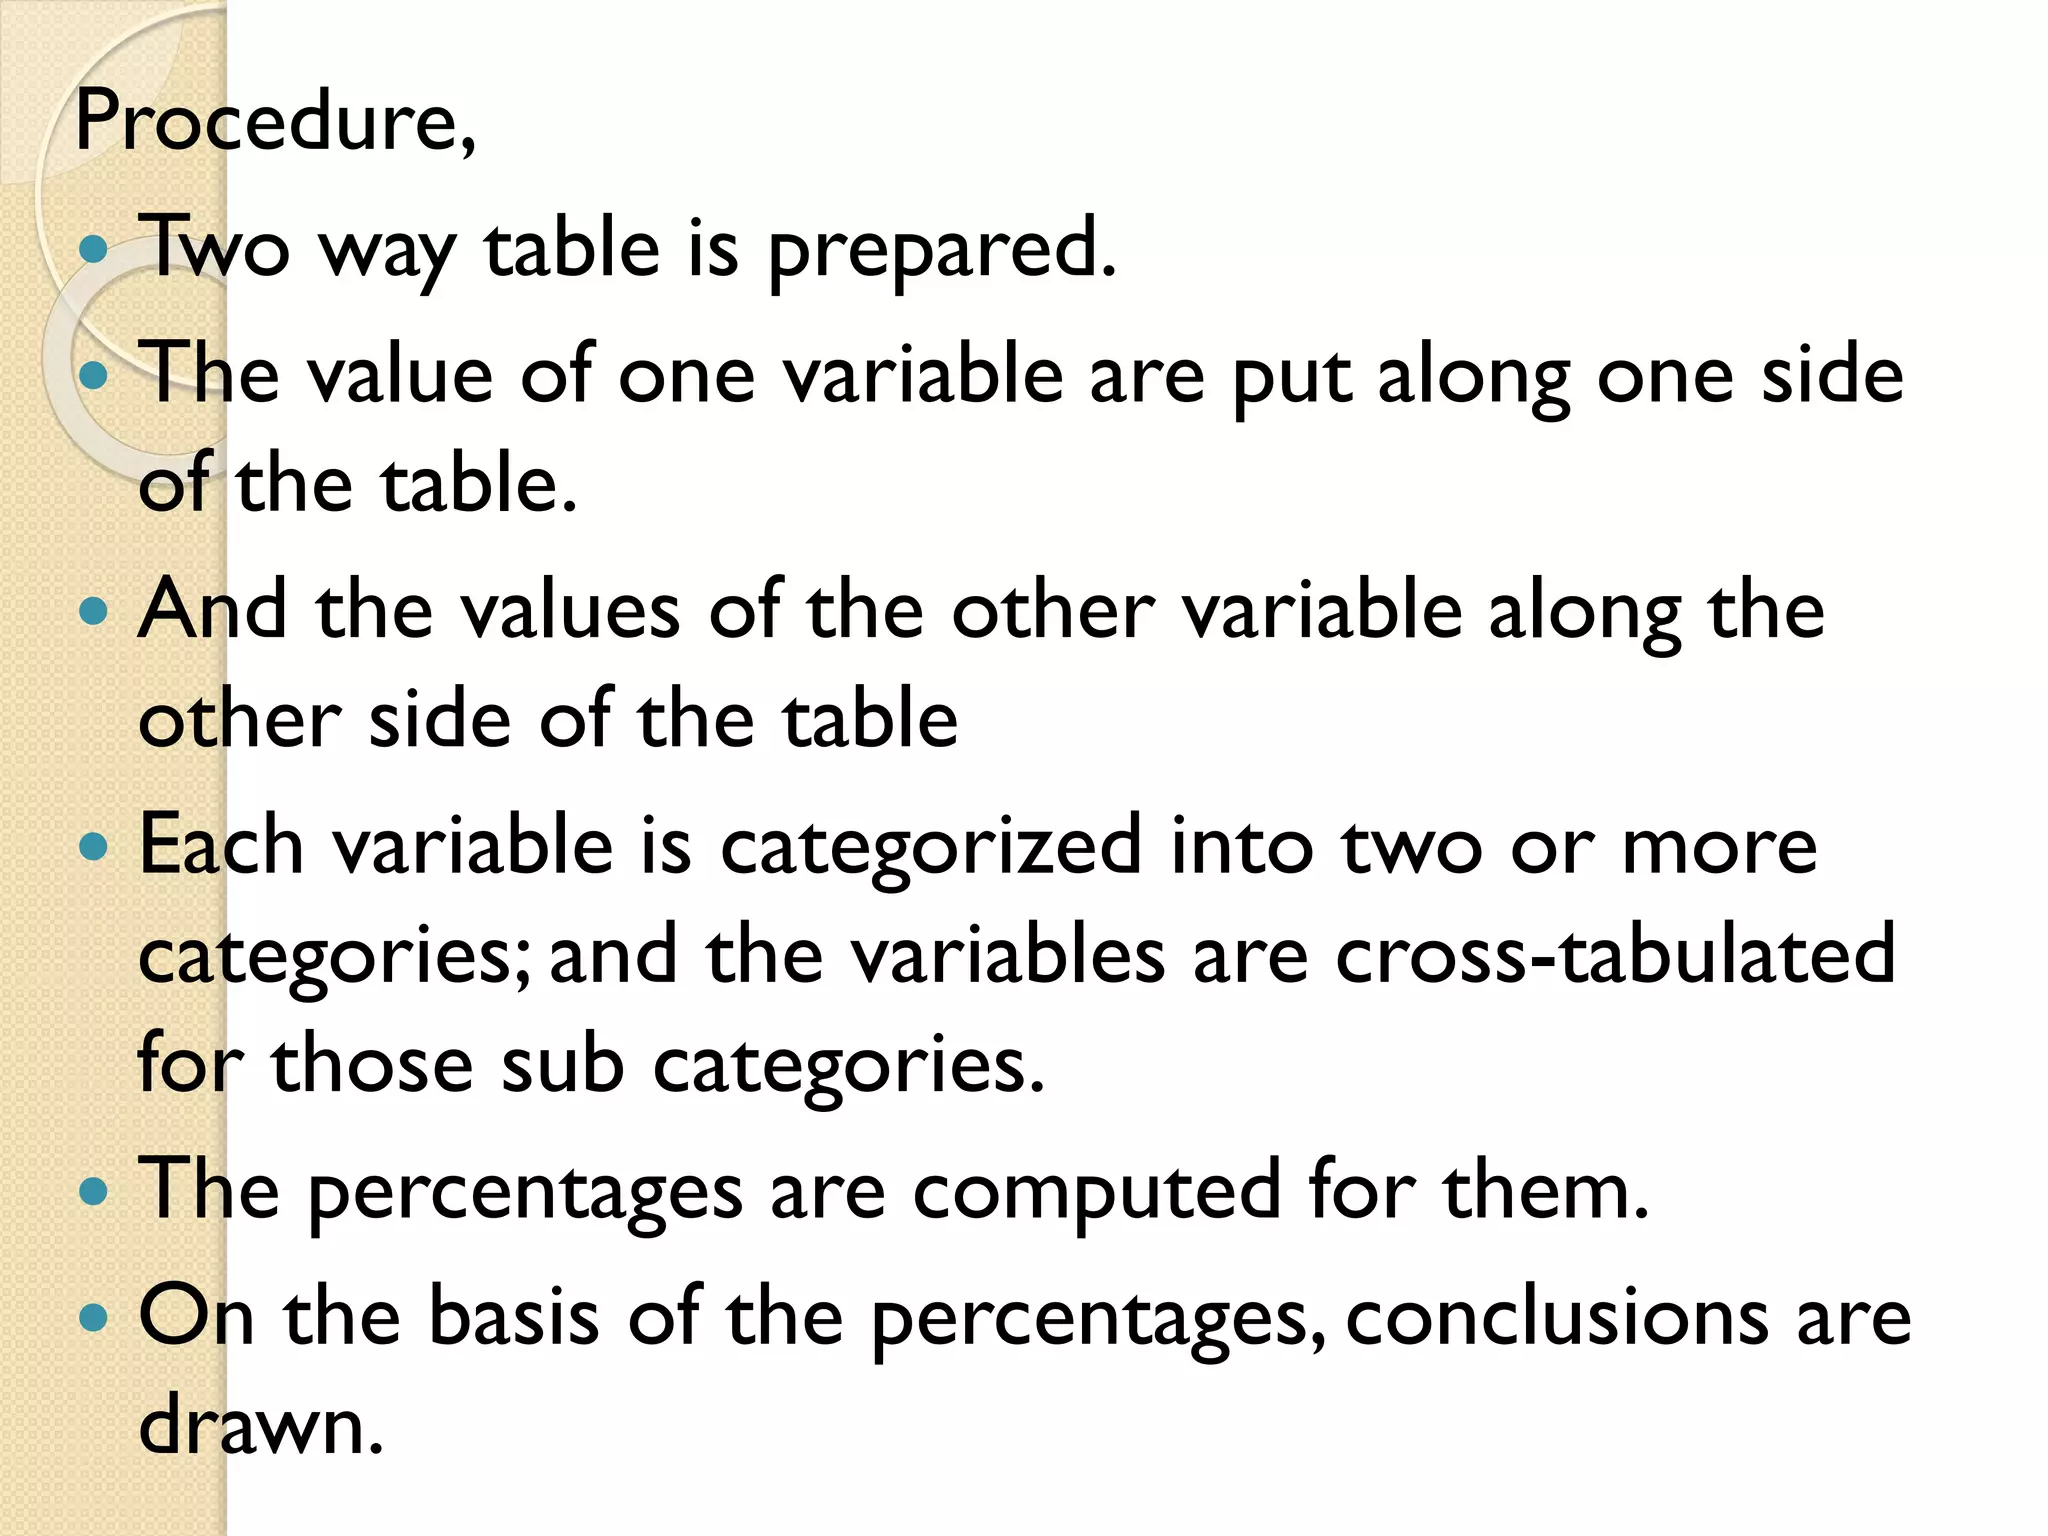
Explains cross tabulation for nominal data, detailing how to categorize variables and draw conclusions based on computed percentages.
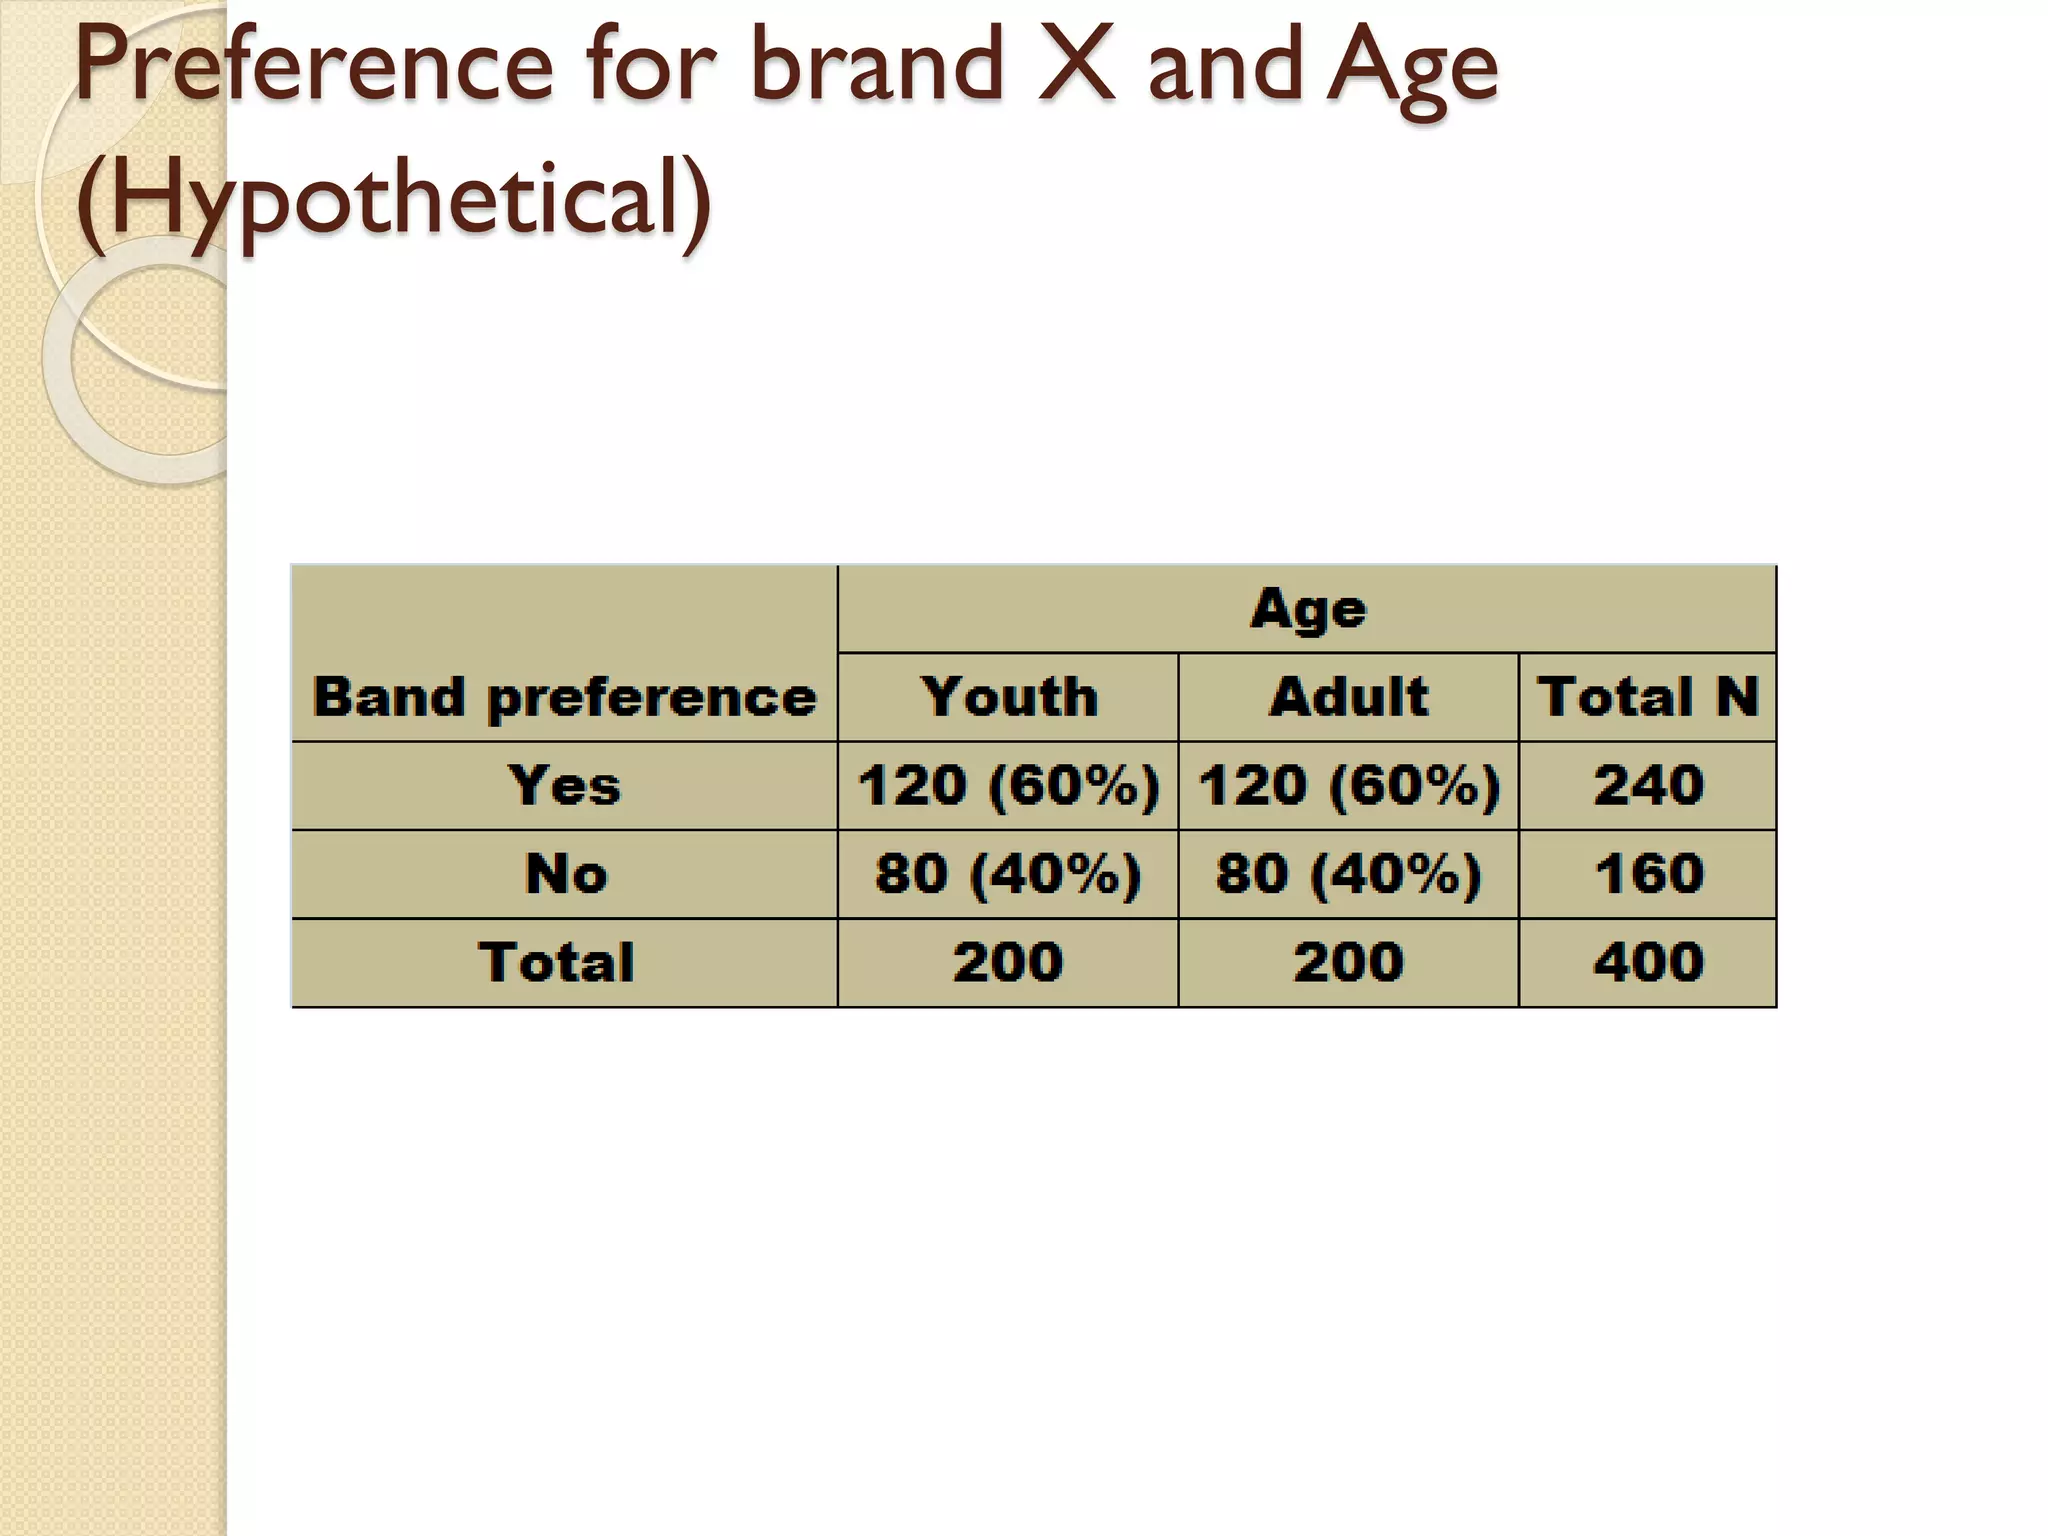
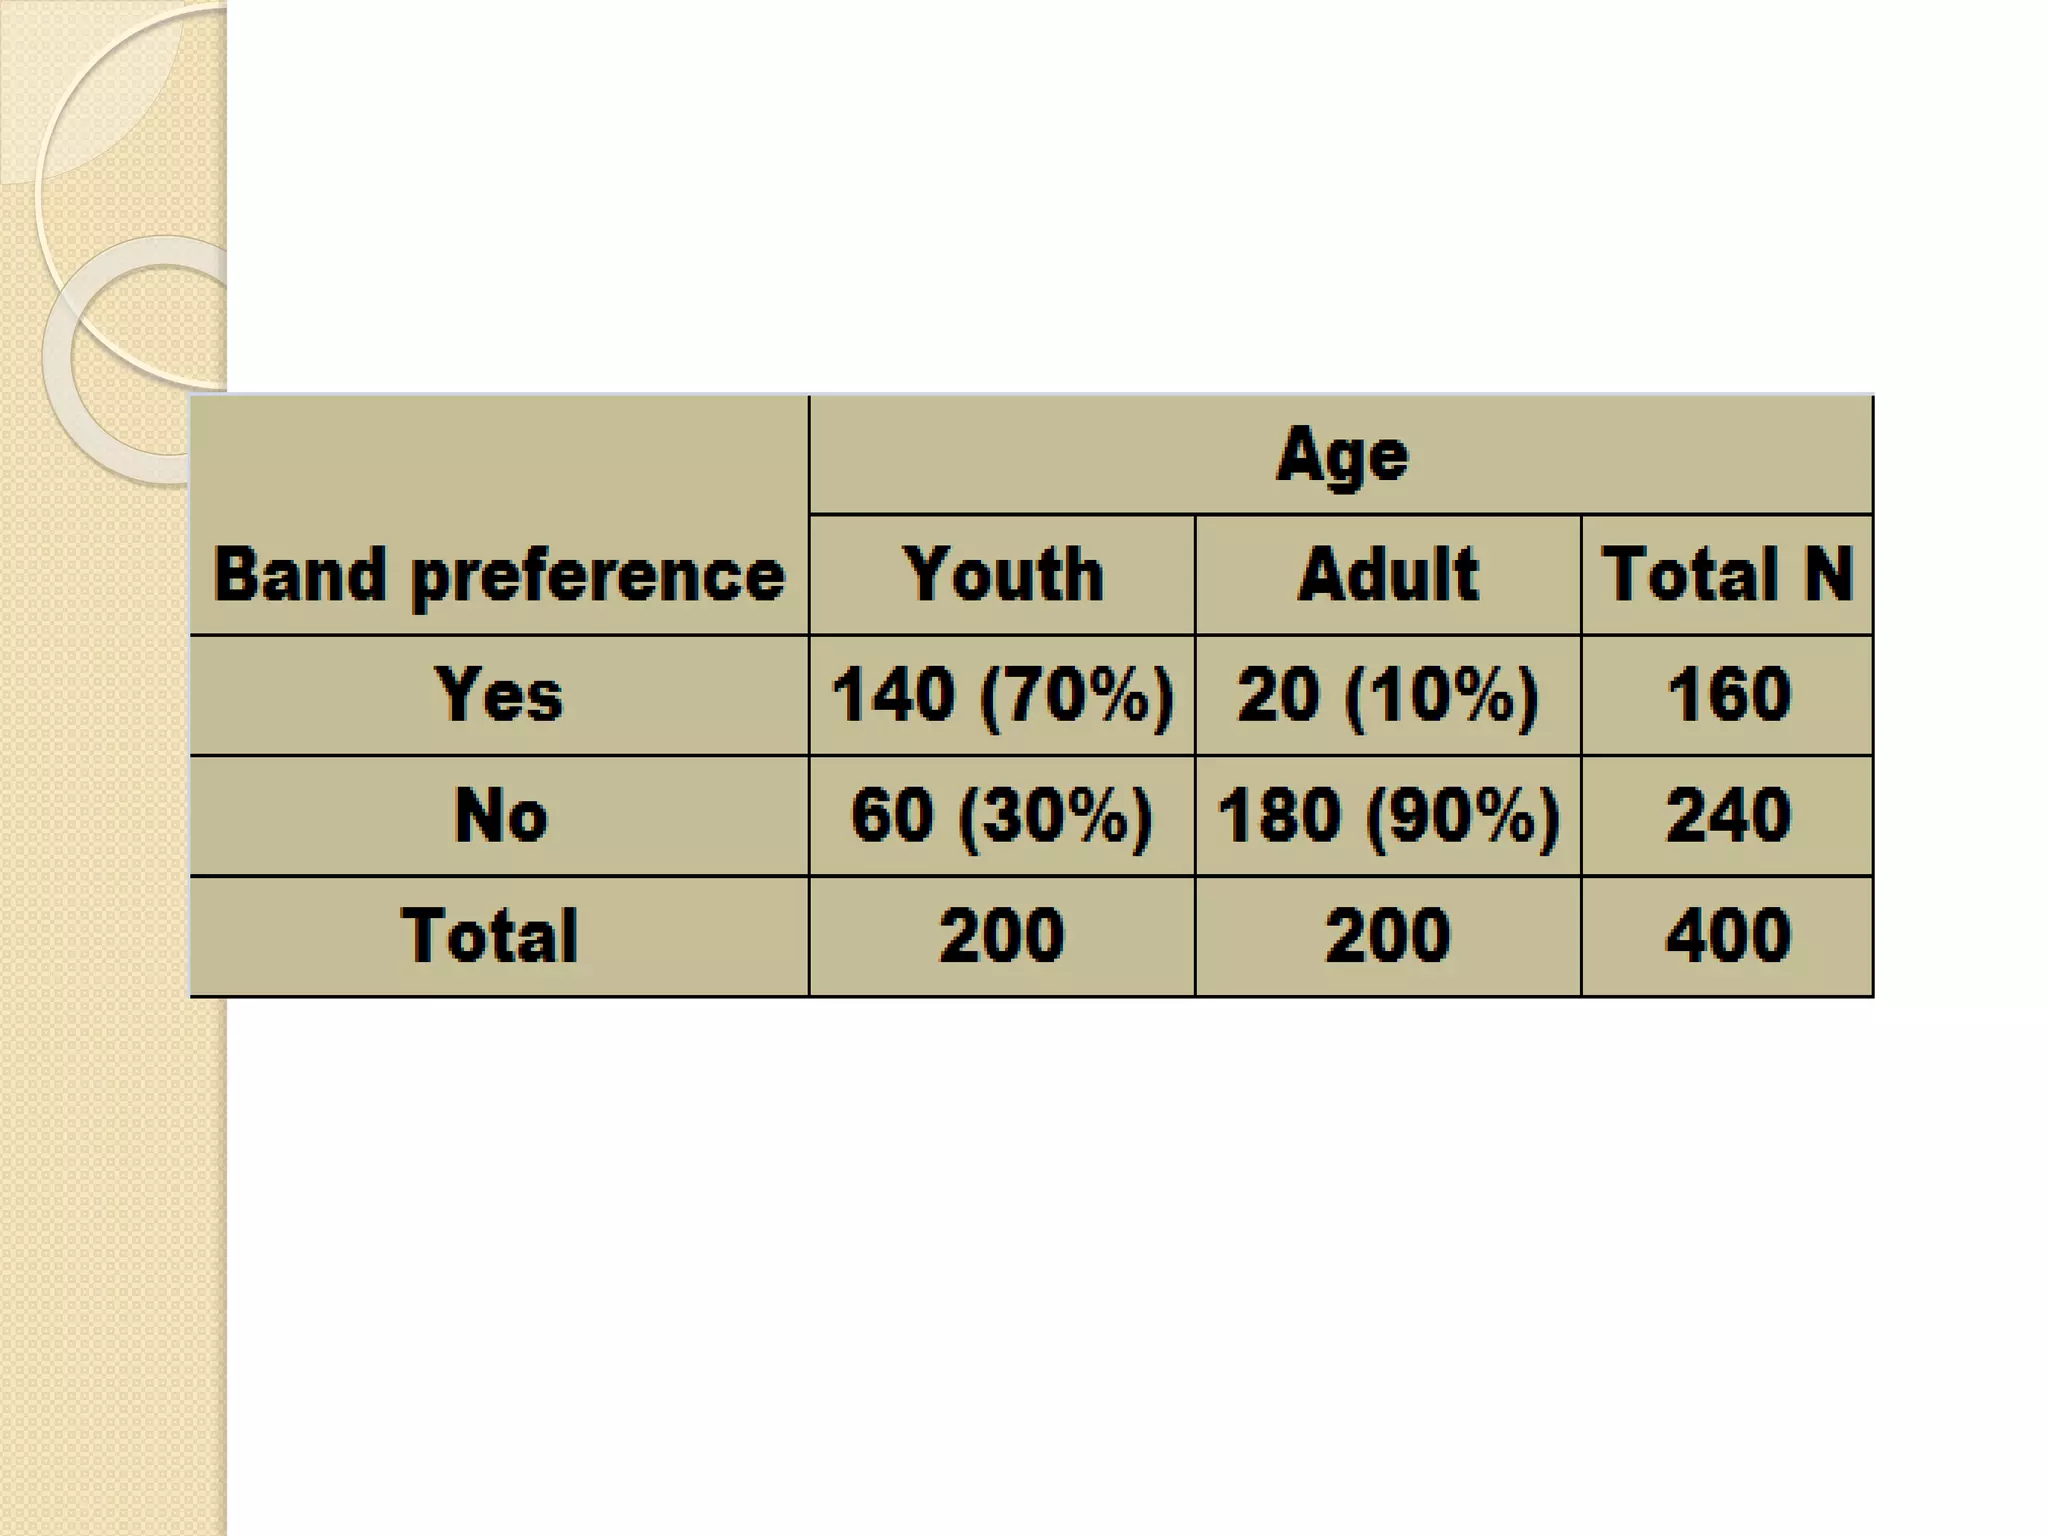
Introduces a hypothetical example analyzing brand preferences across different age groups.
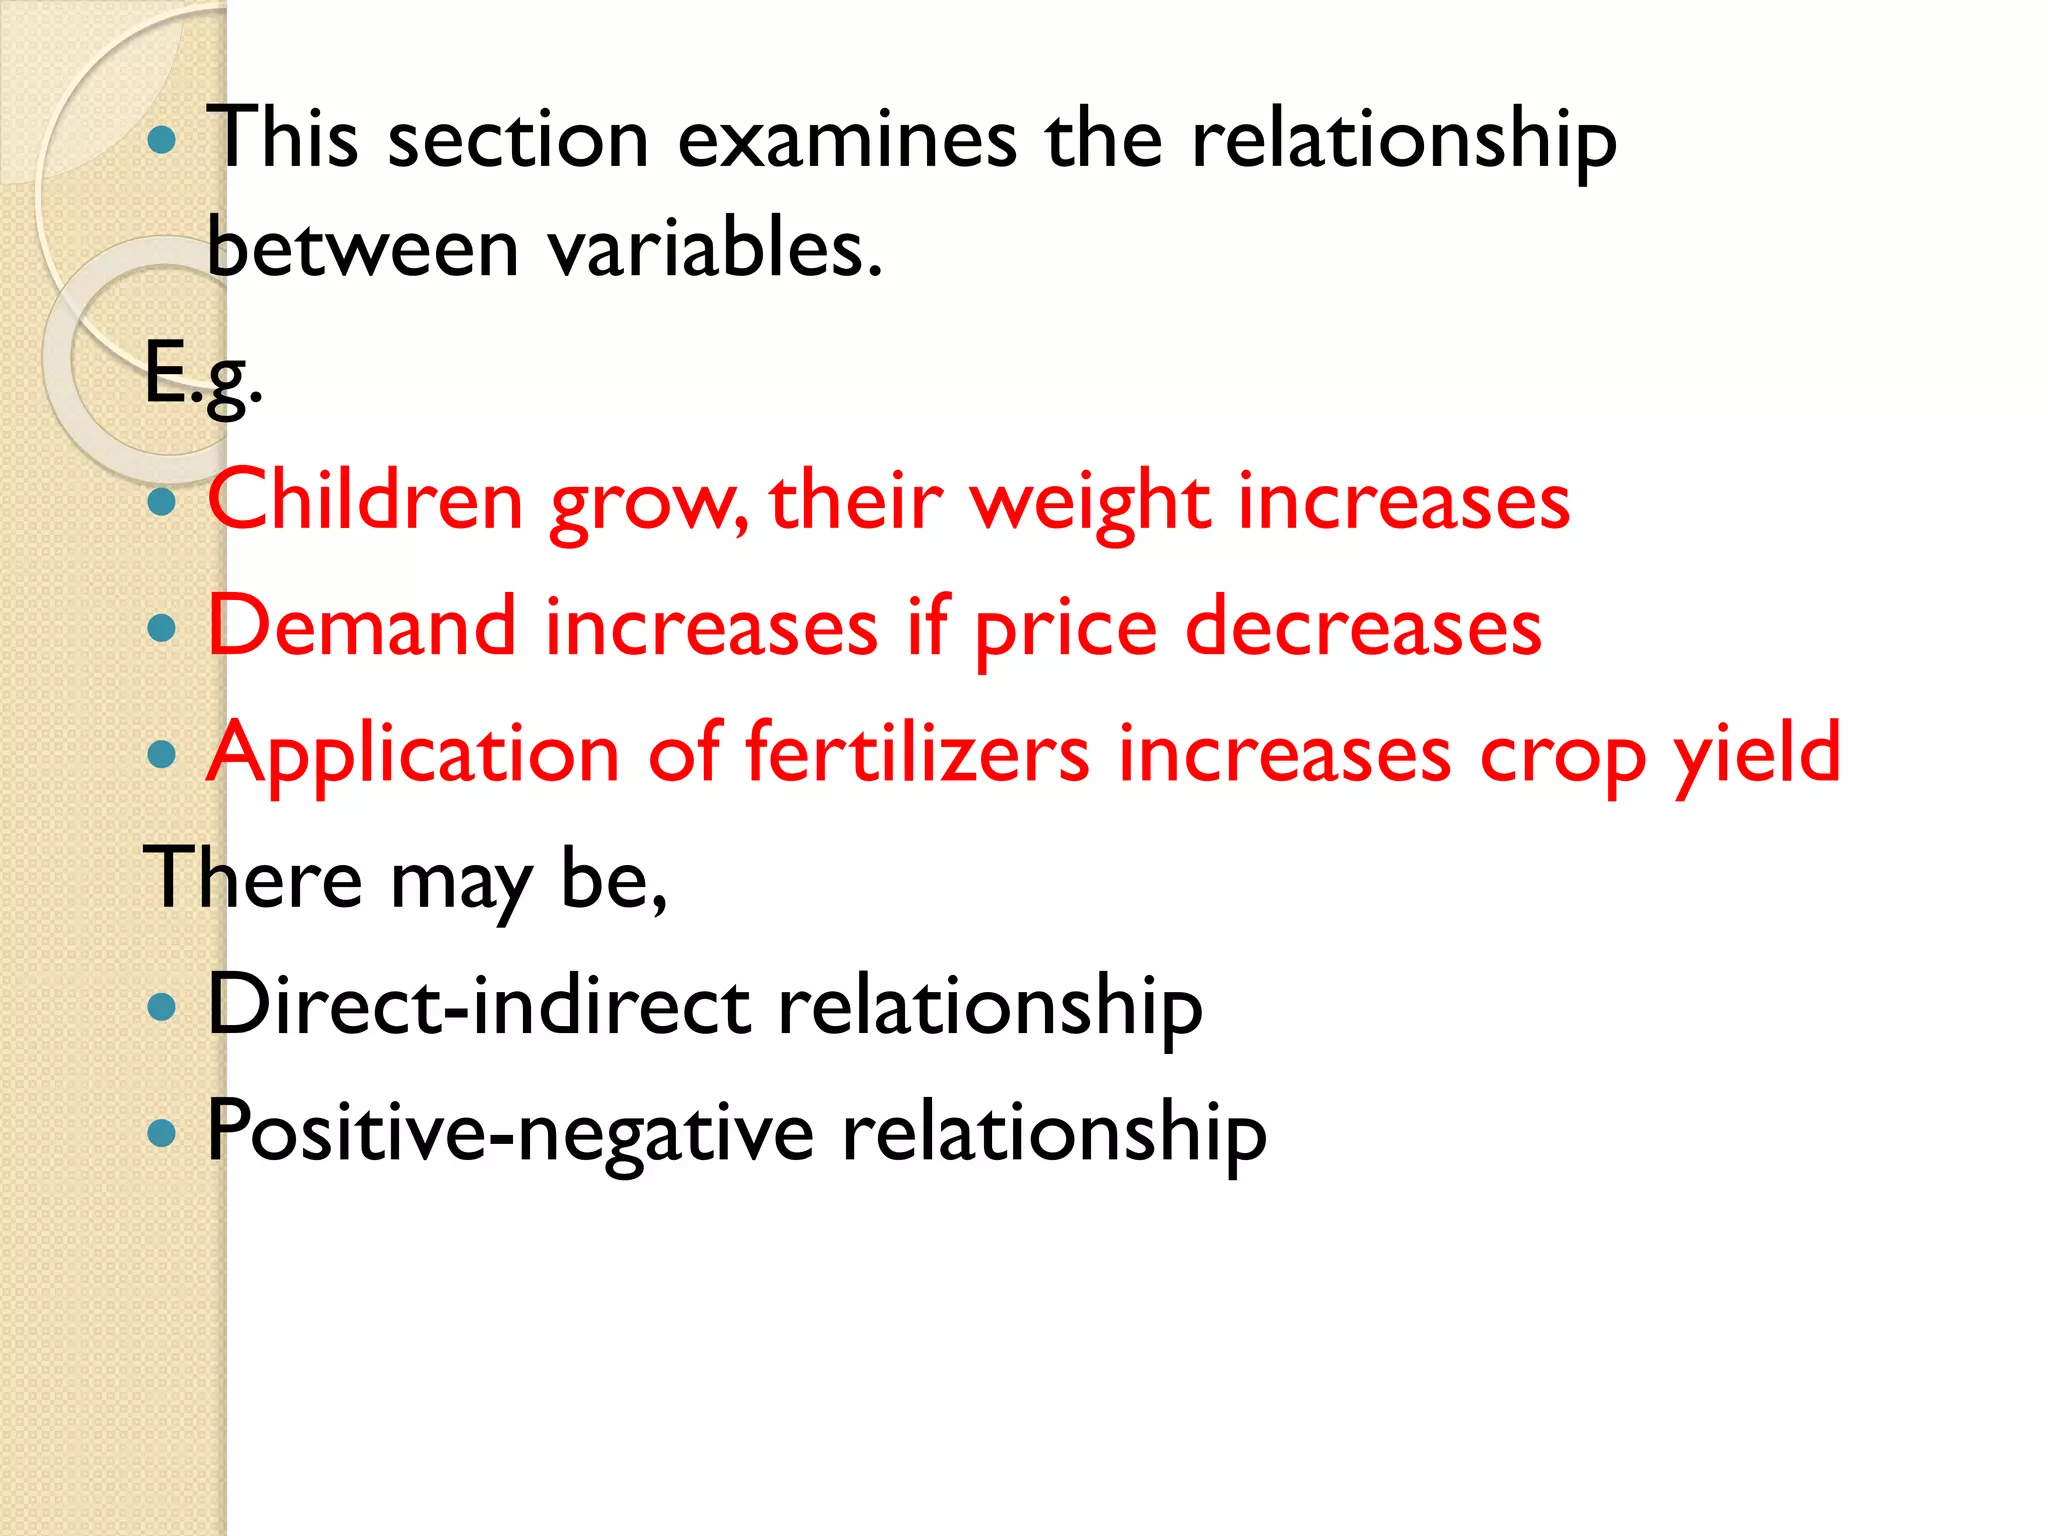
Discusses how to determine the strength of relationships through patterns in variable values.
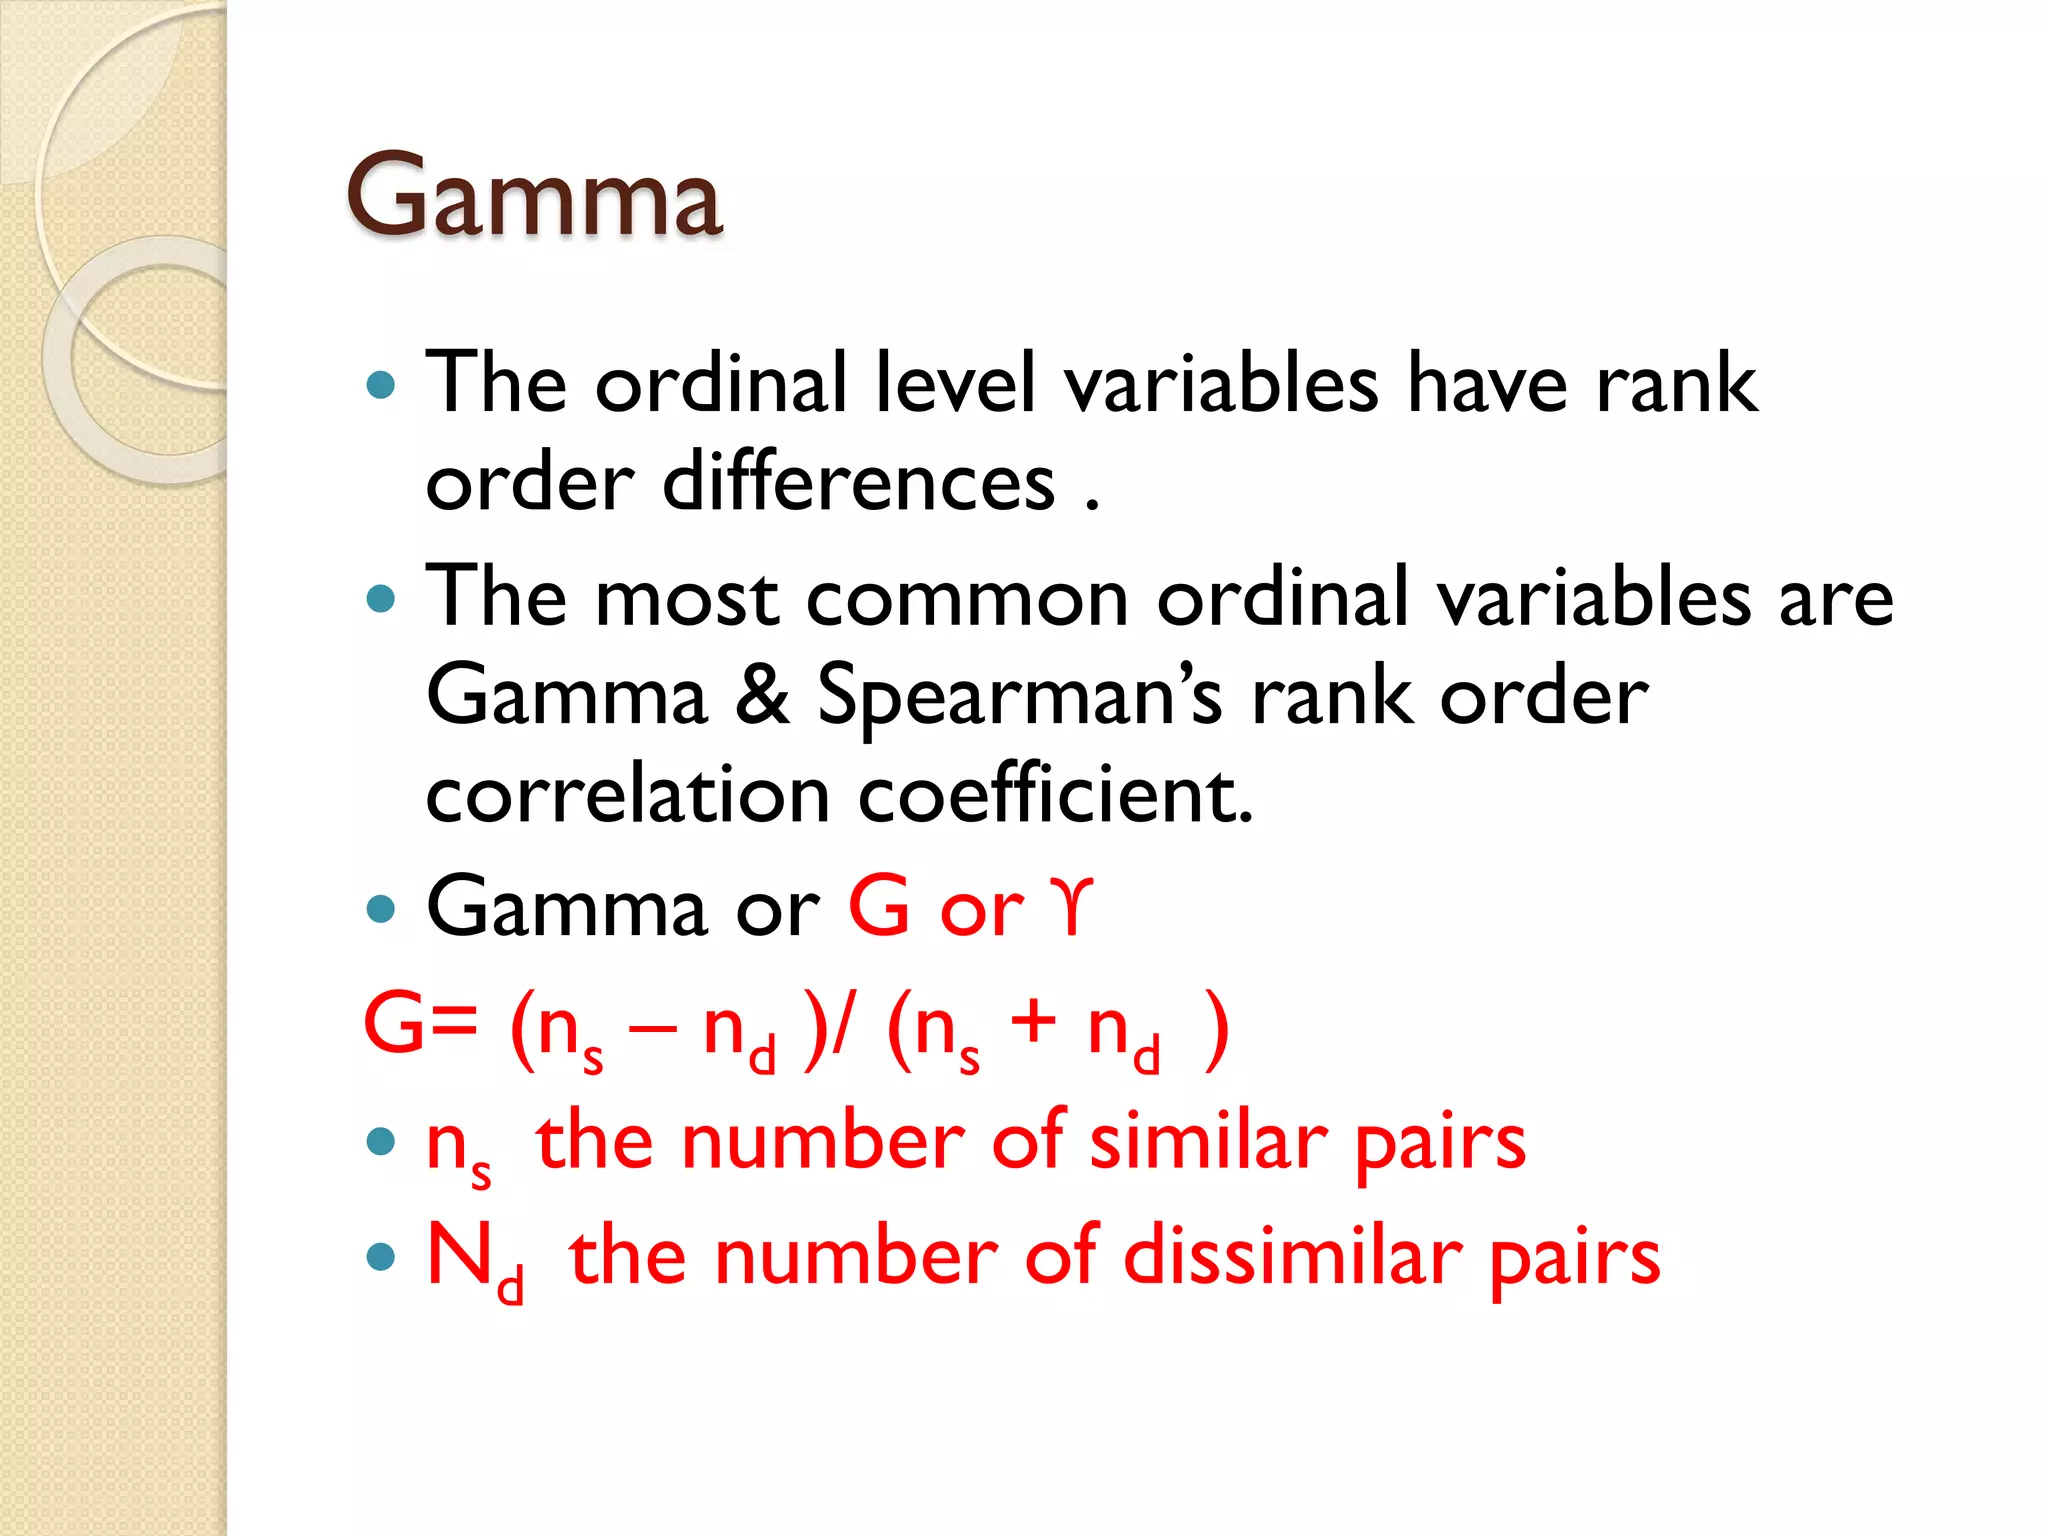
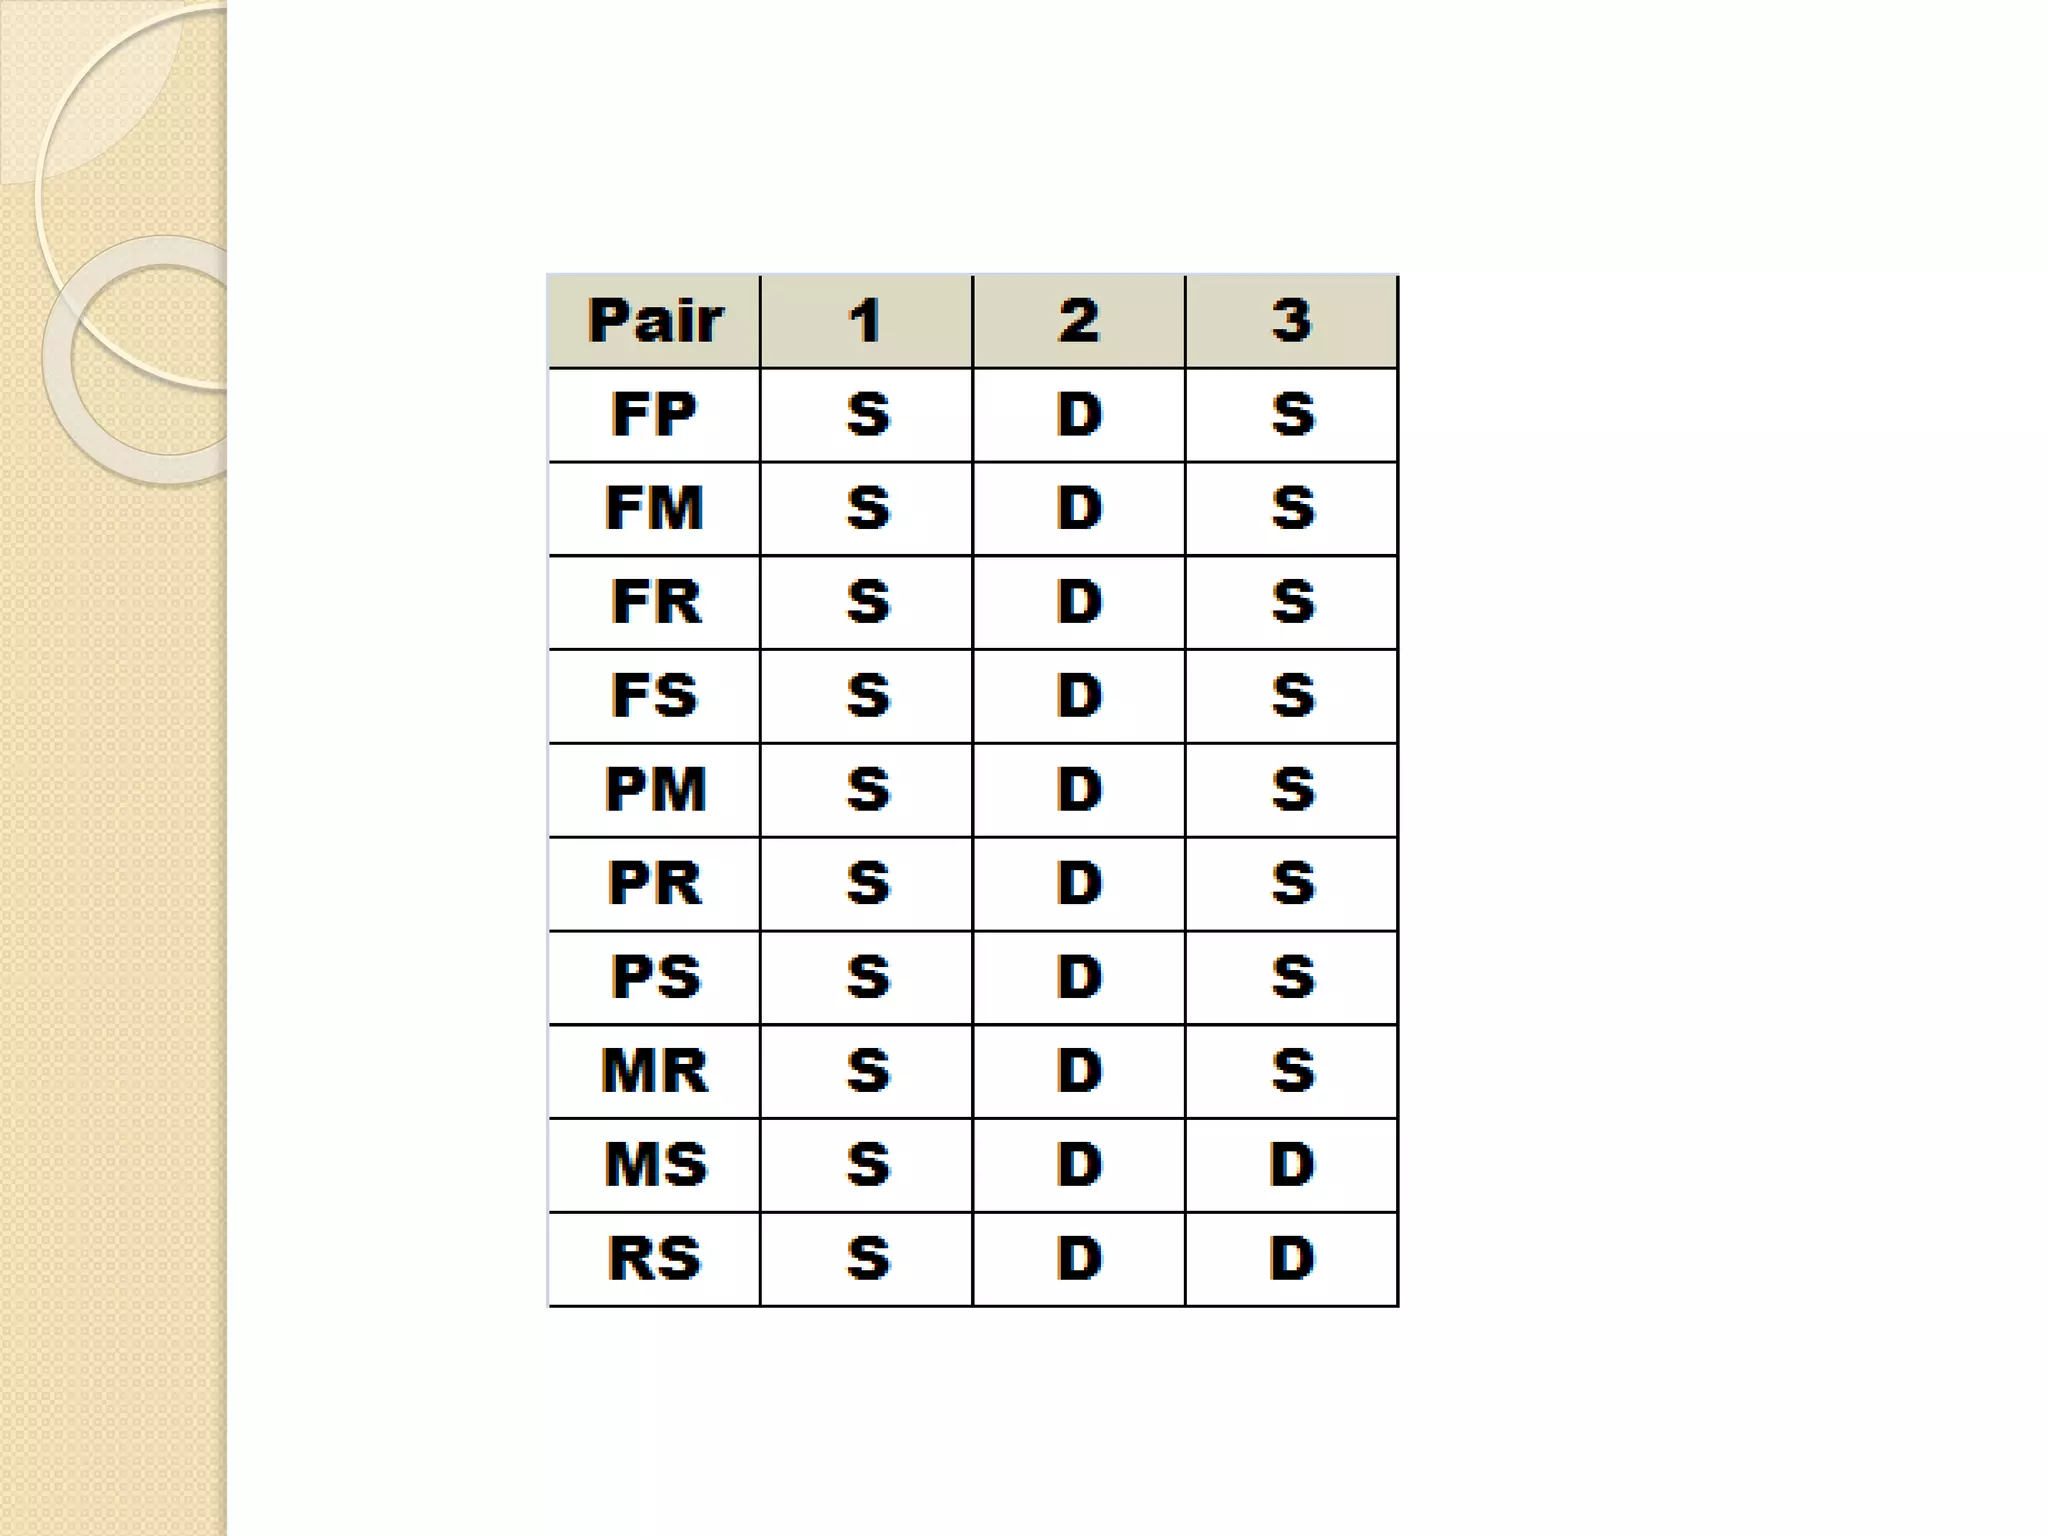
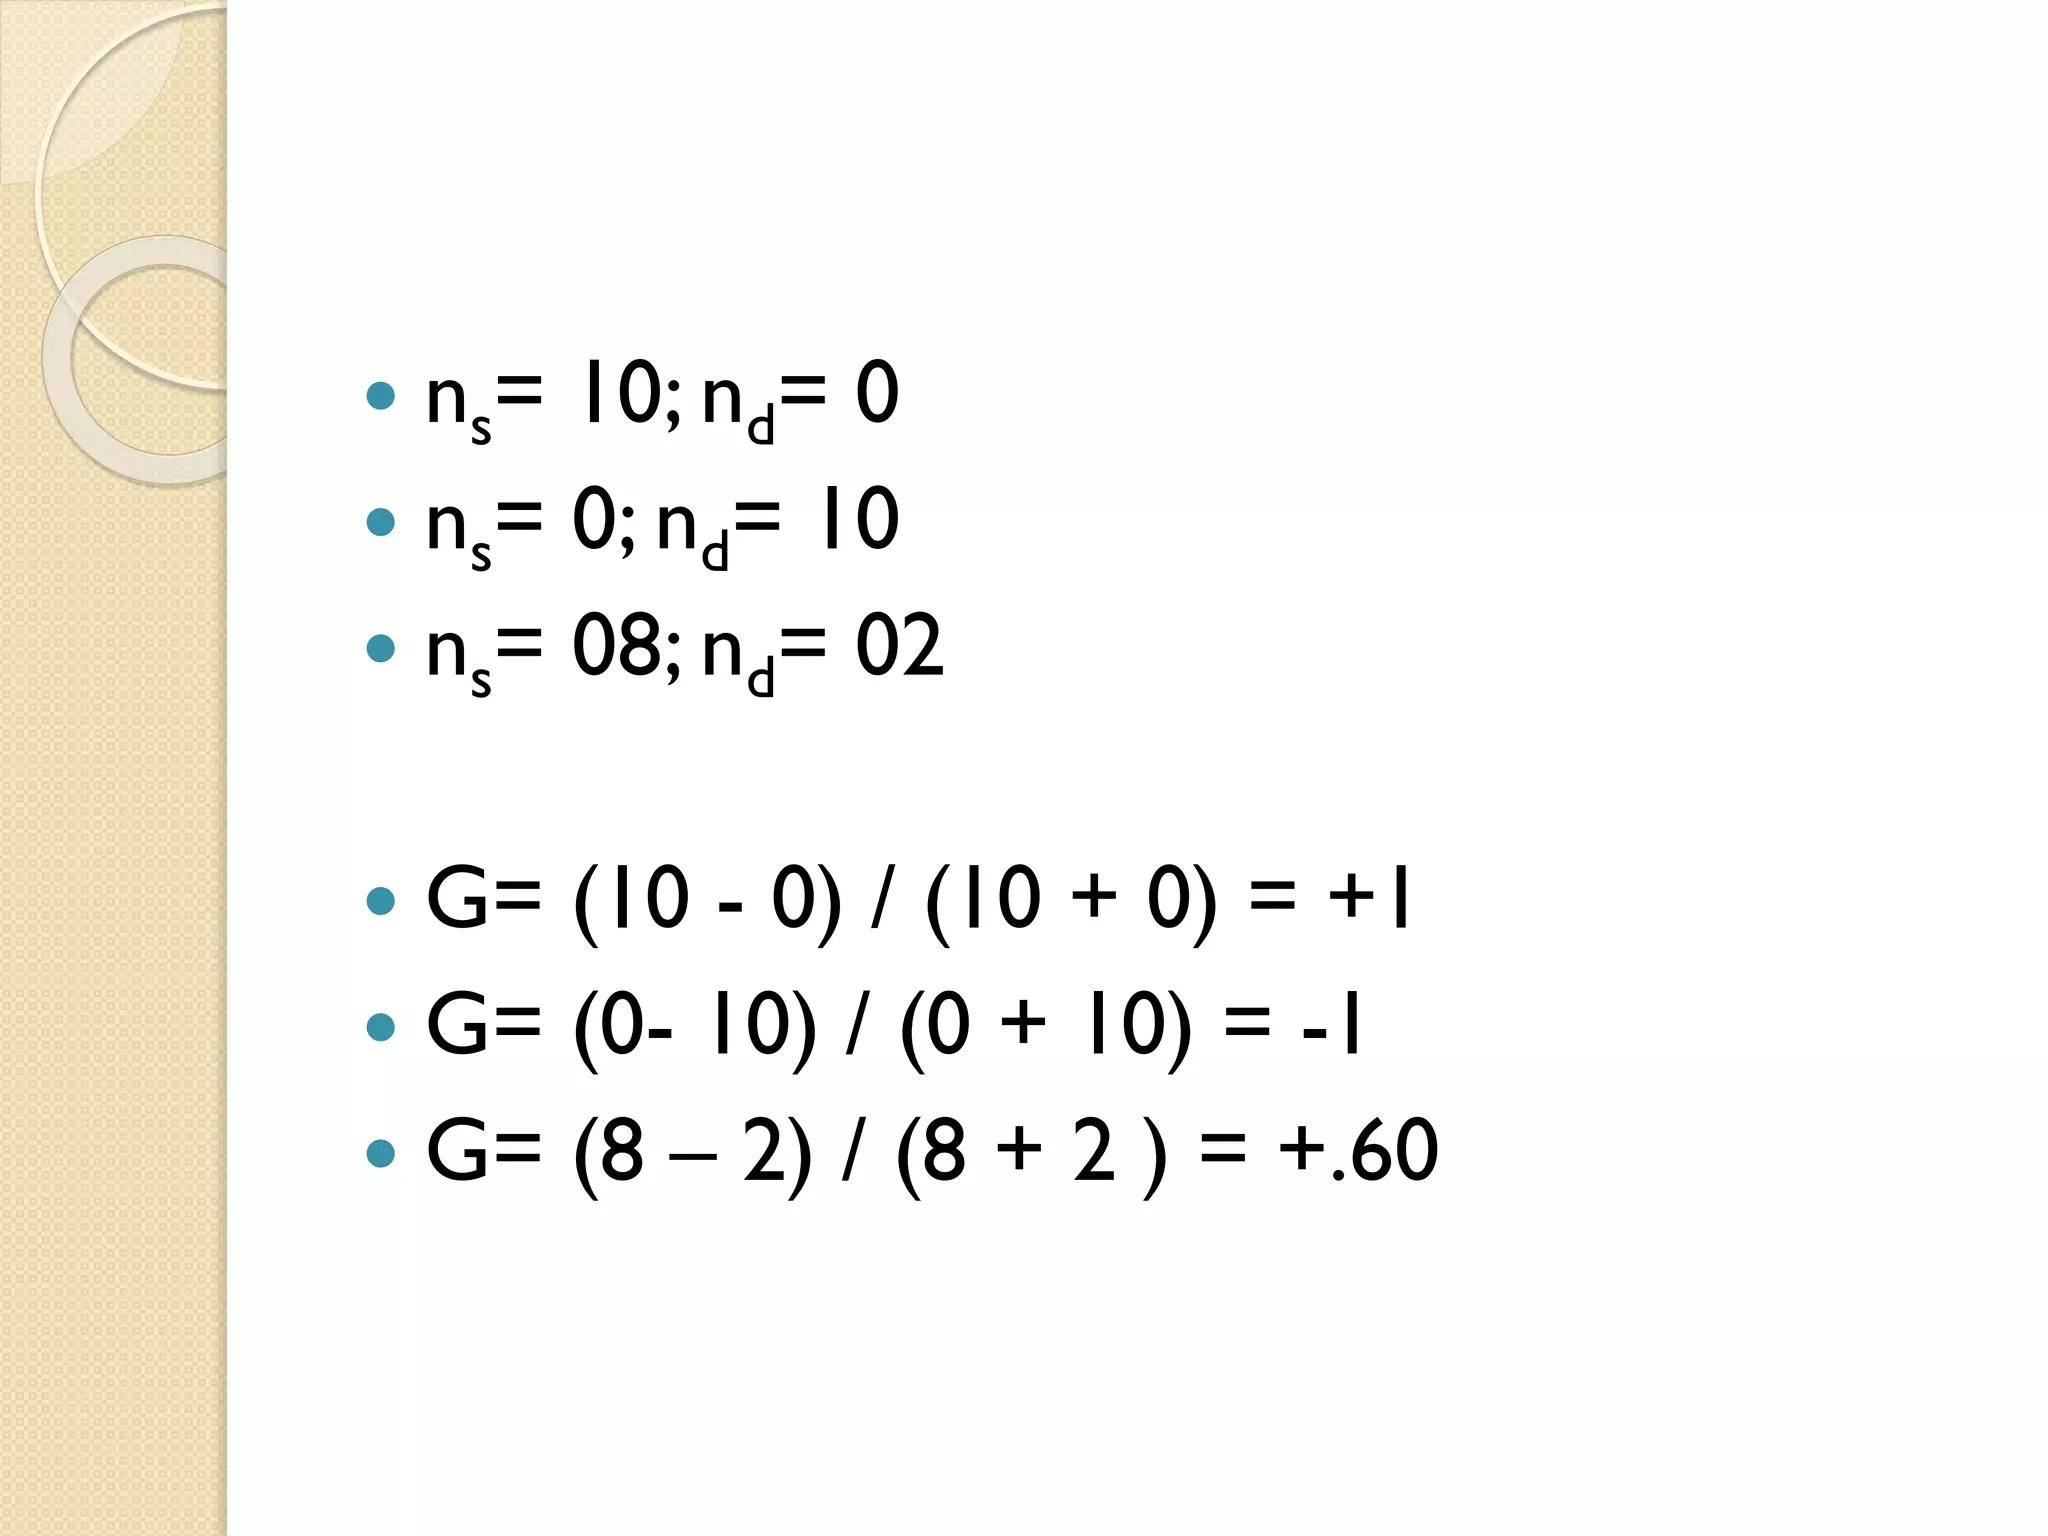
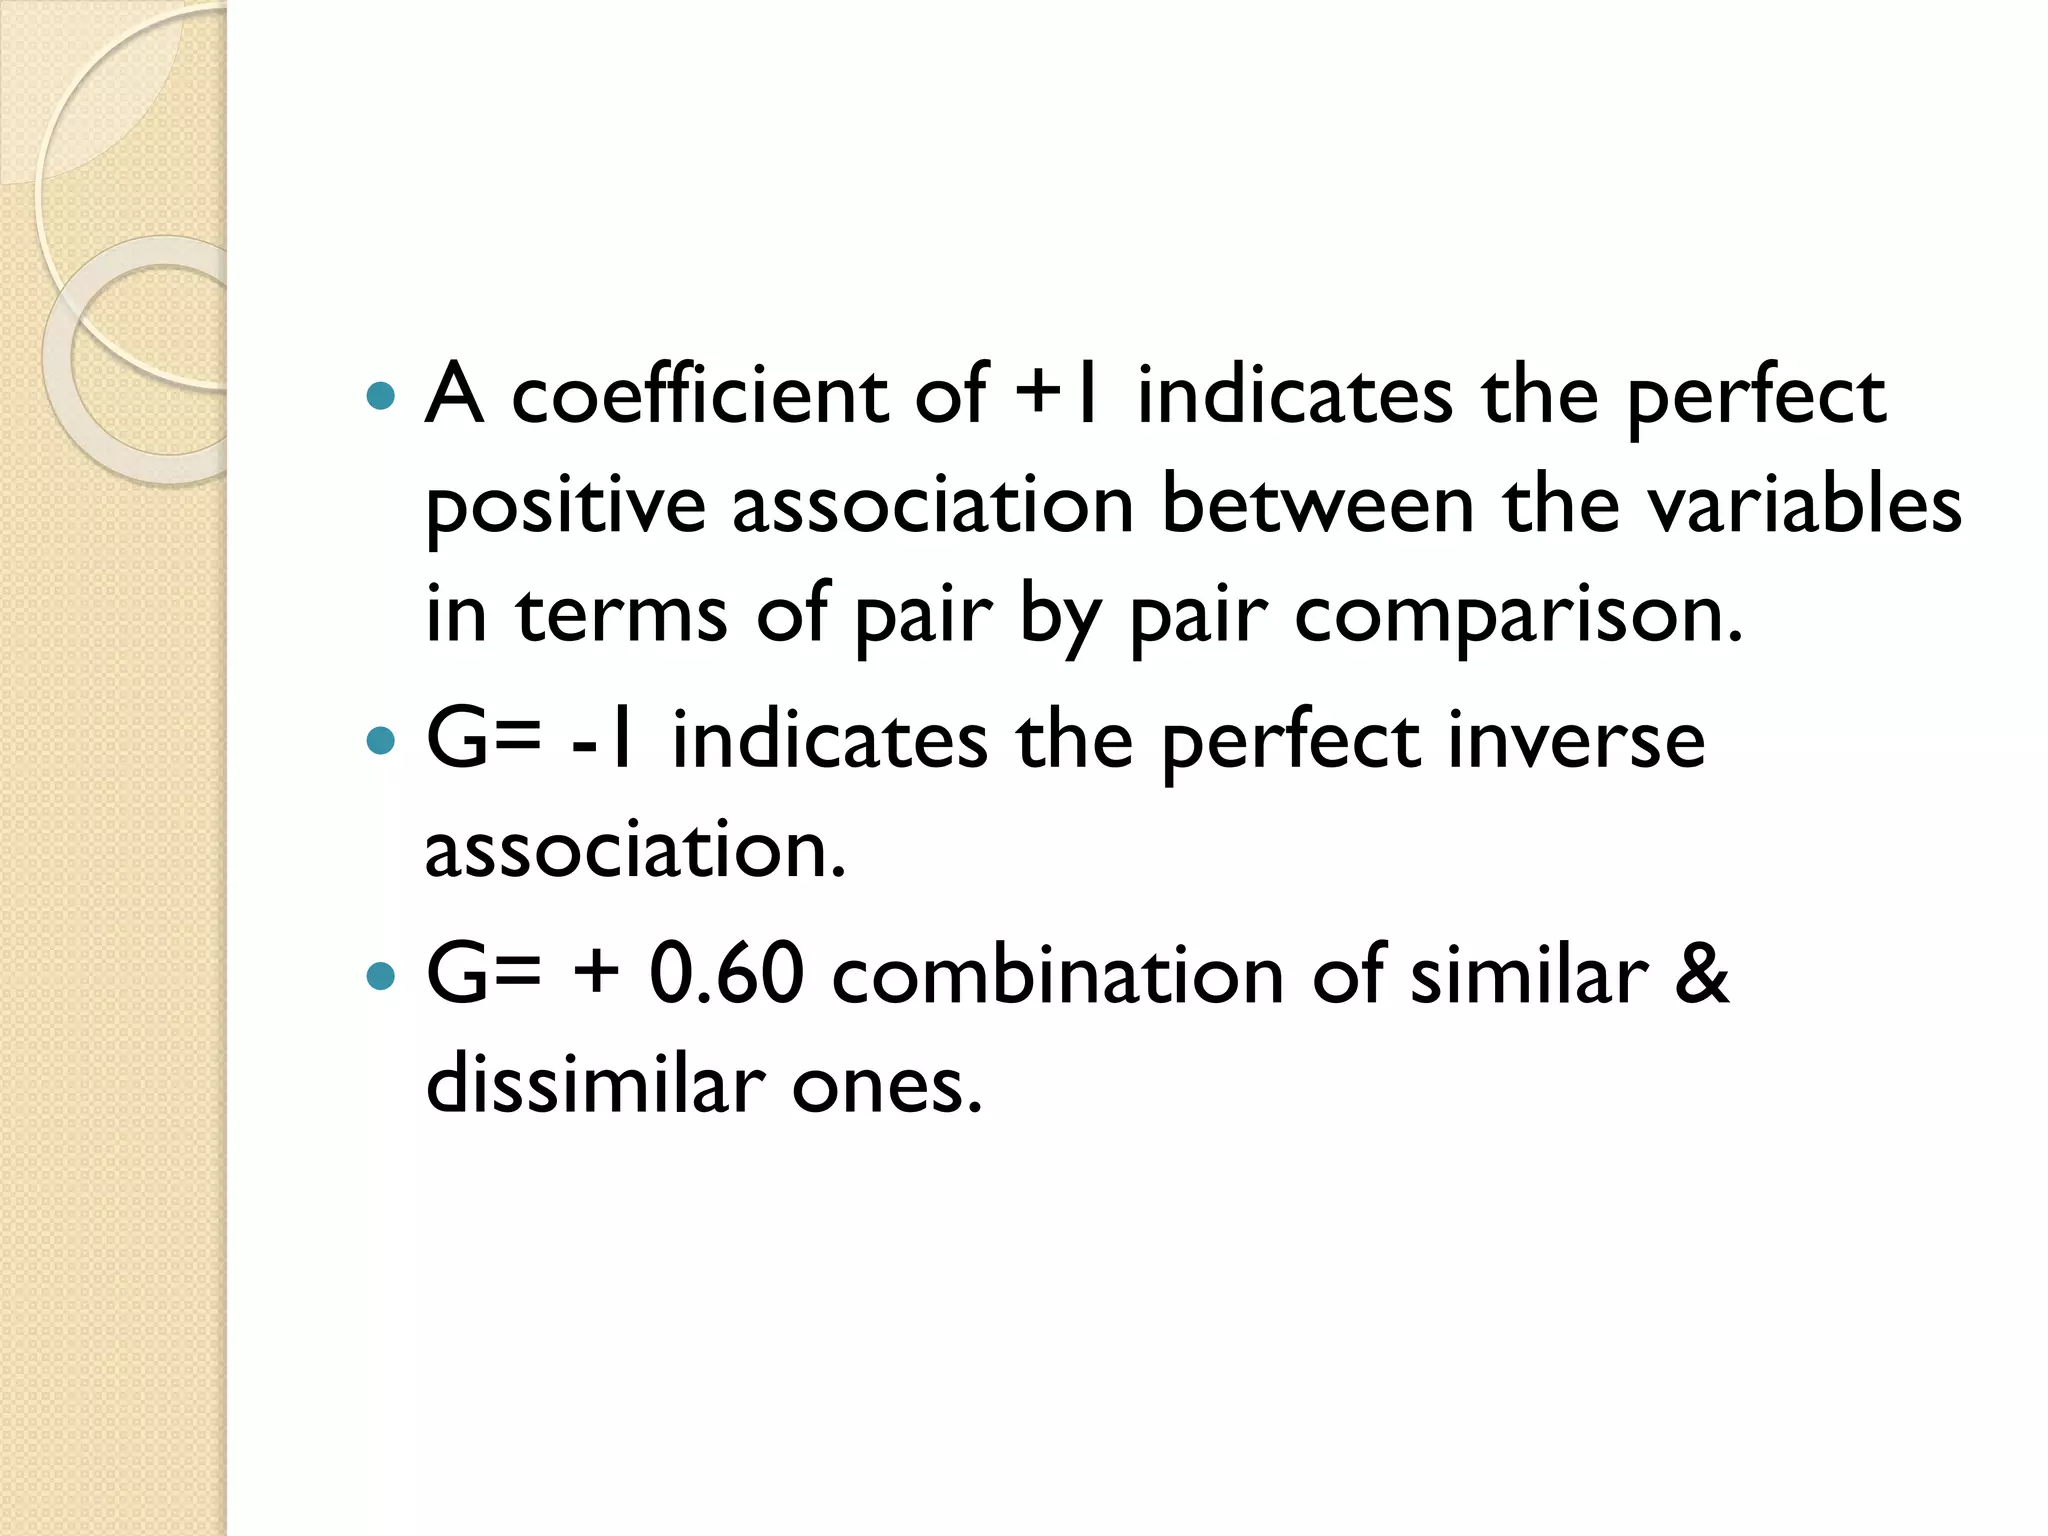
Describes Gamma as a measure for ordinal variables and explains its calculation and application through pair comparisons.
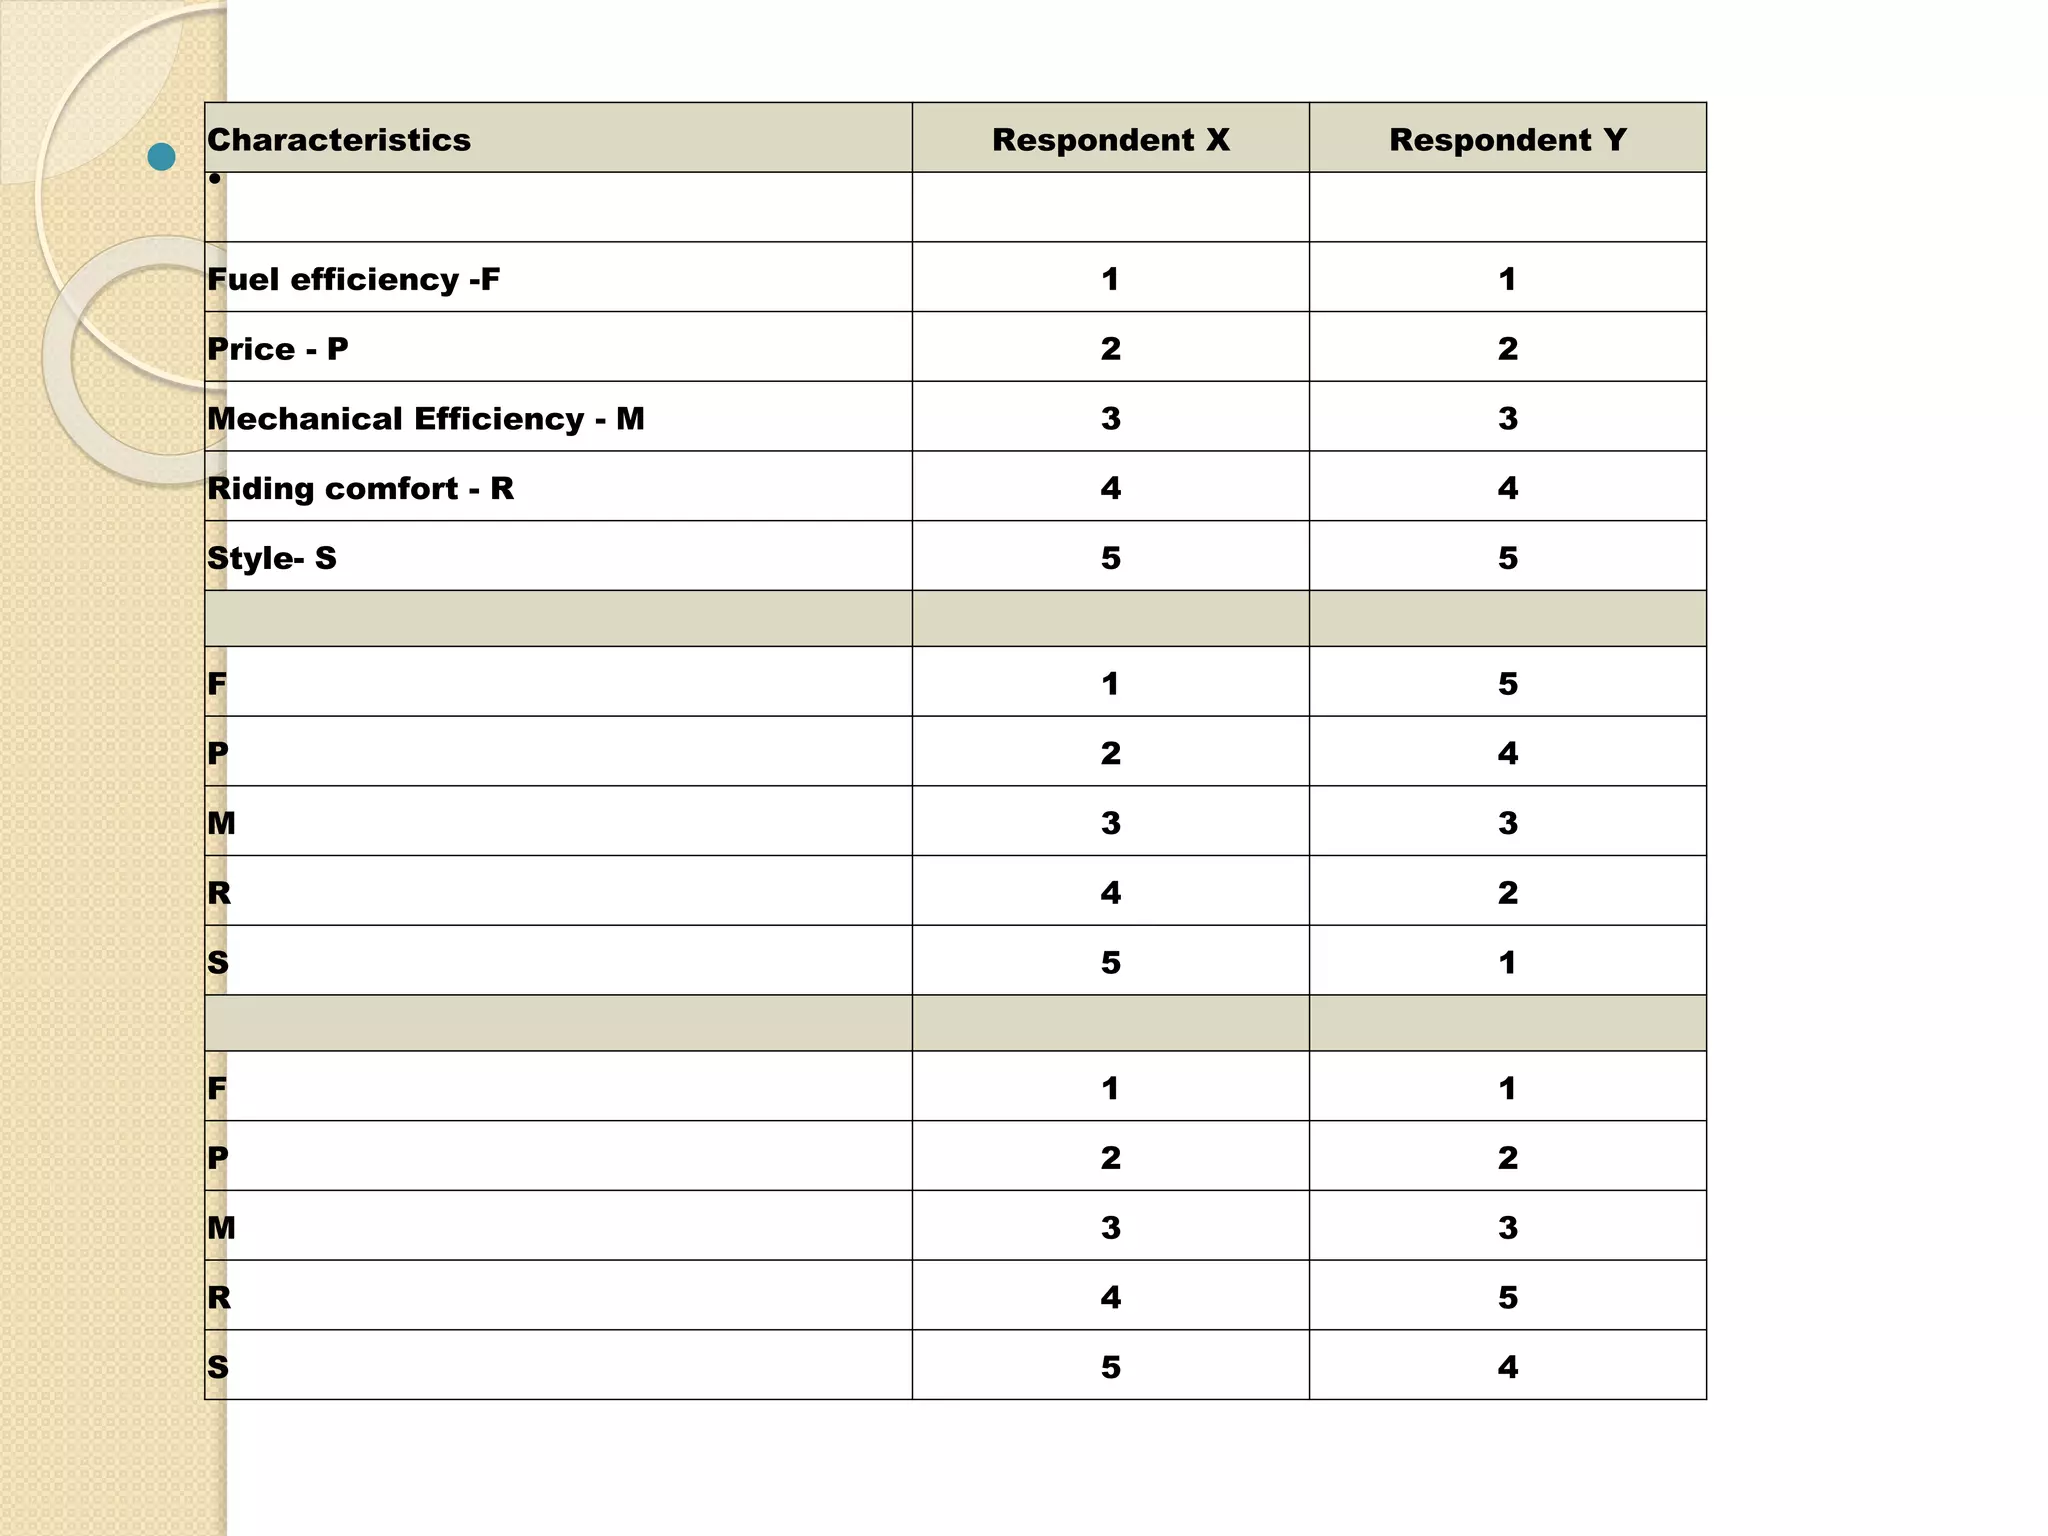
Illustrates how to compare characteristics rankings through respondents, detailing calculations of similarity (ns) and dissimilarity (nd) pairs.
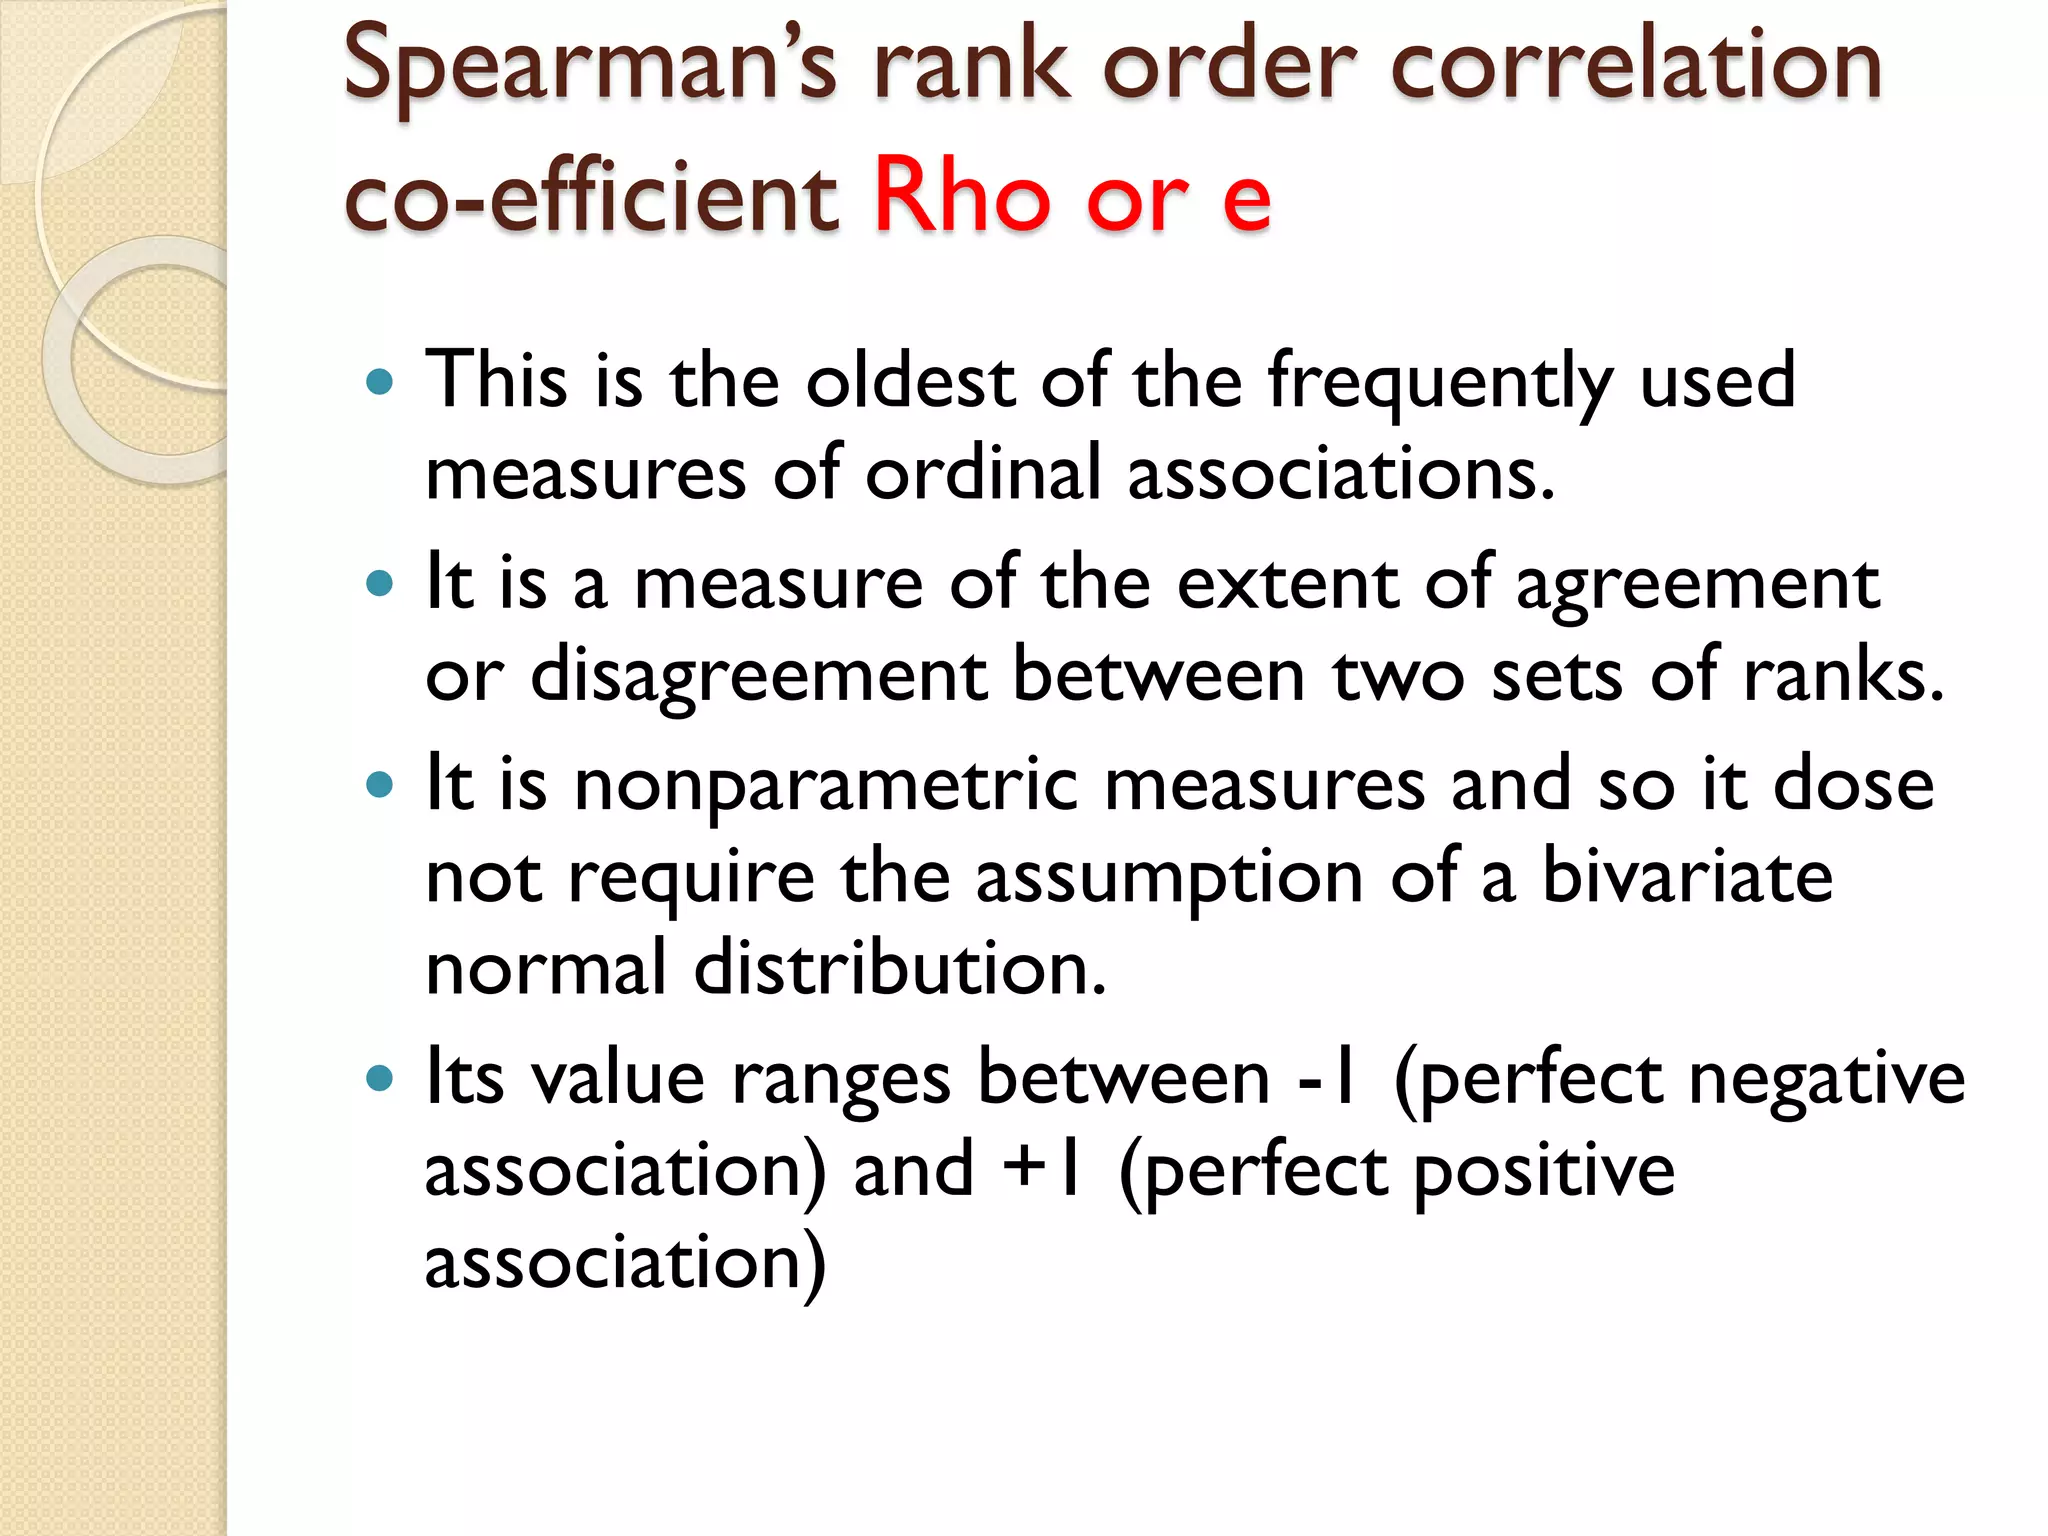
Introduces Spearman’s Rho as an ordinal association measure, with calculations showing perfect negative or positive relationships.
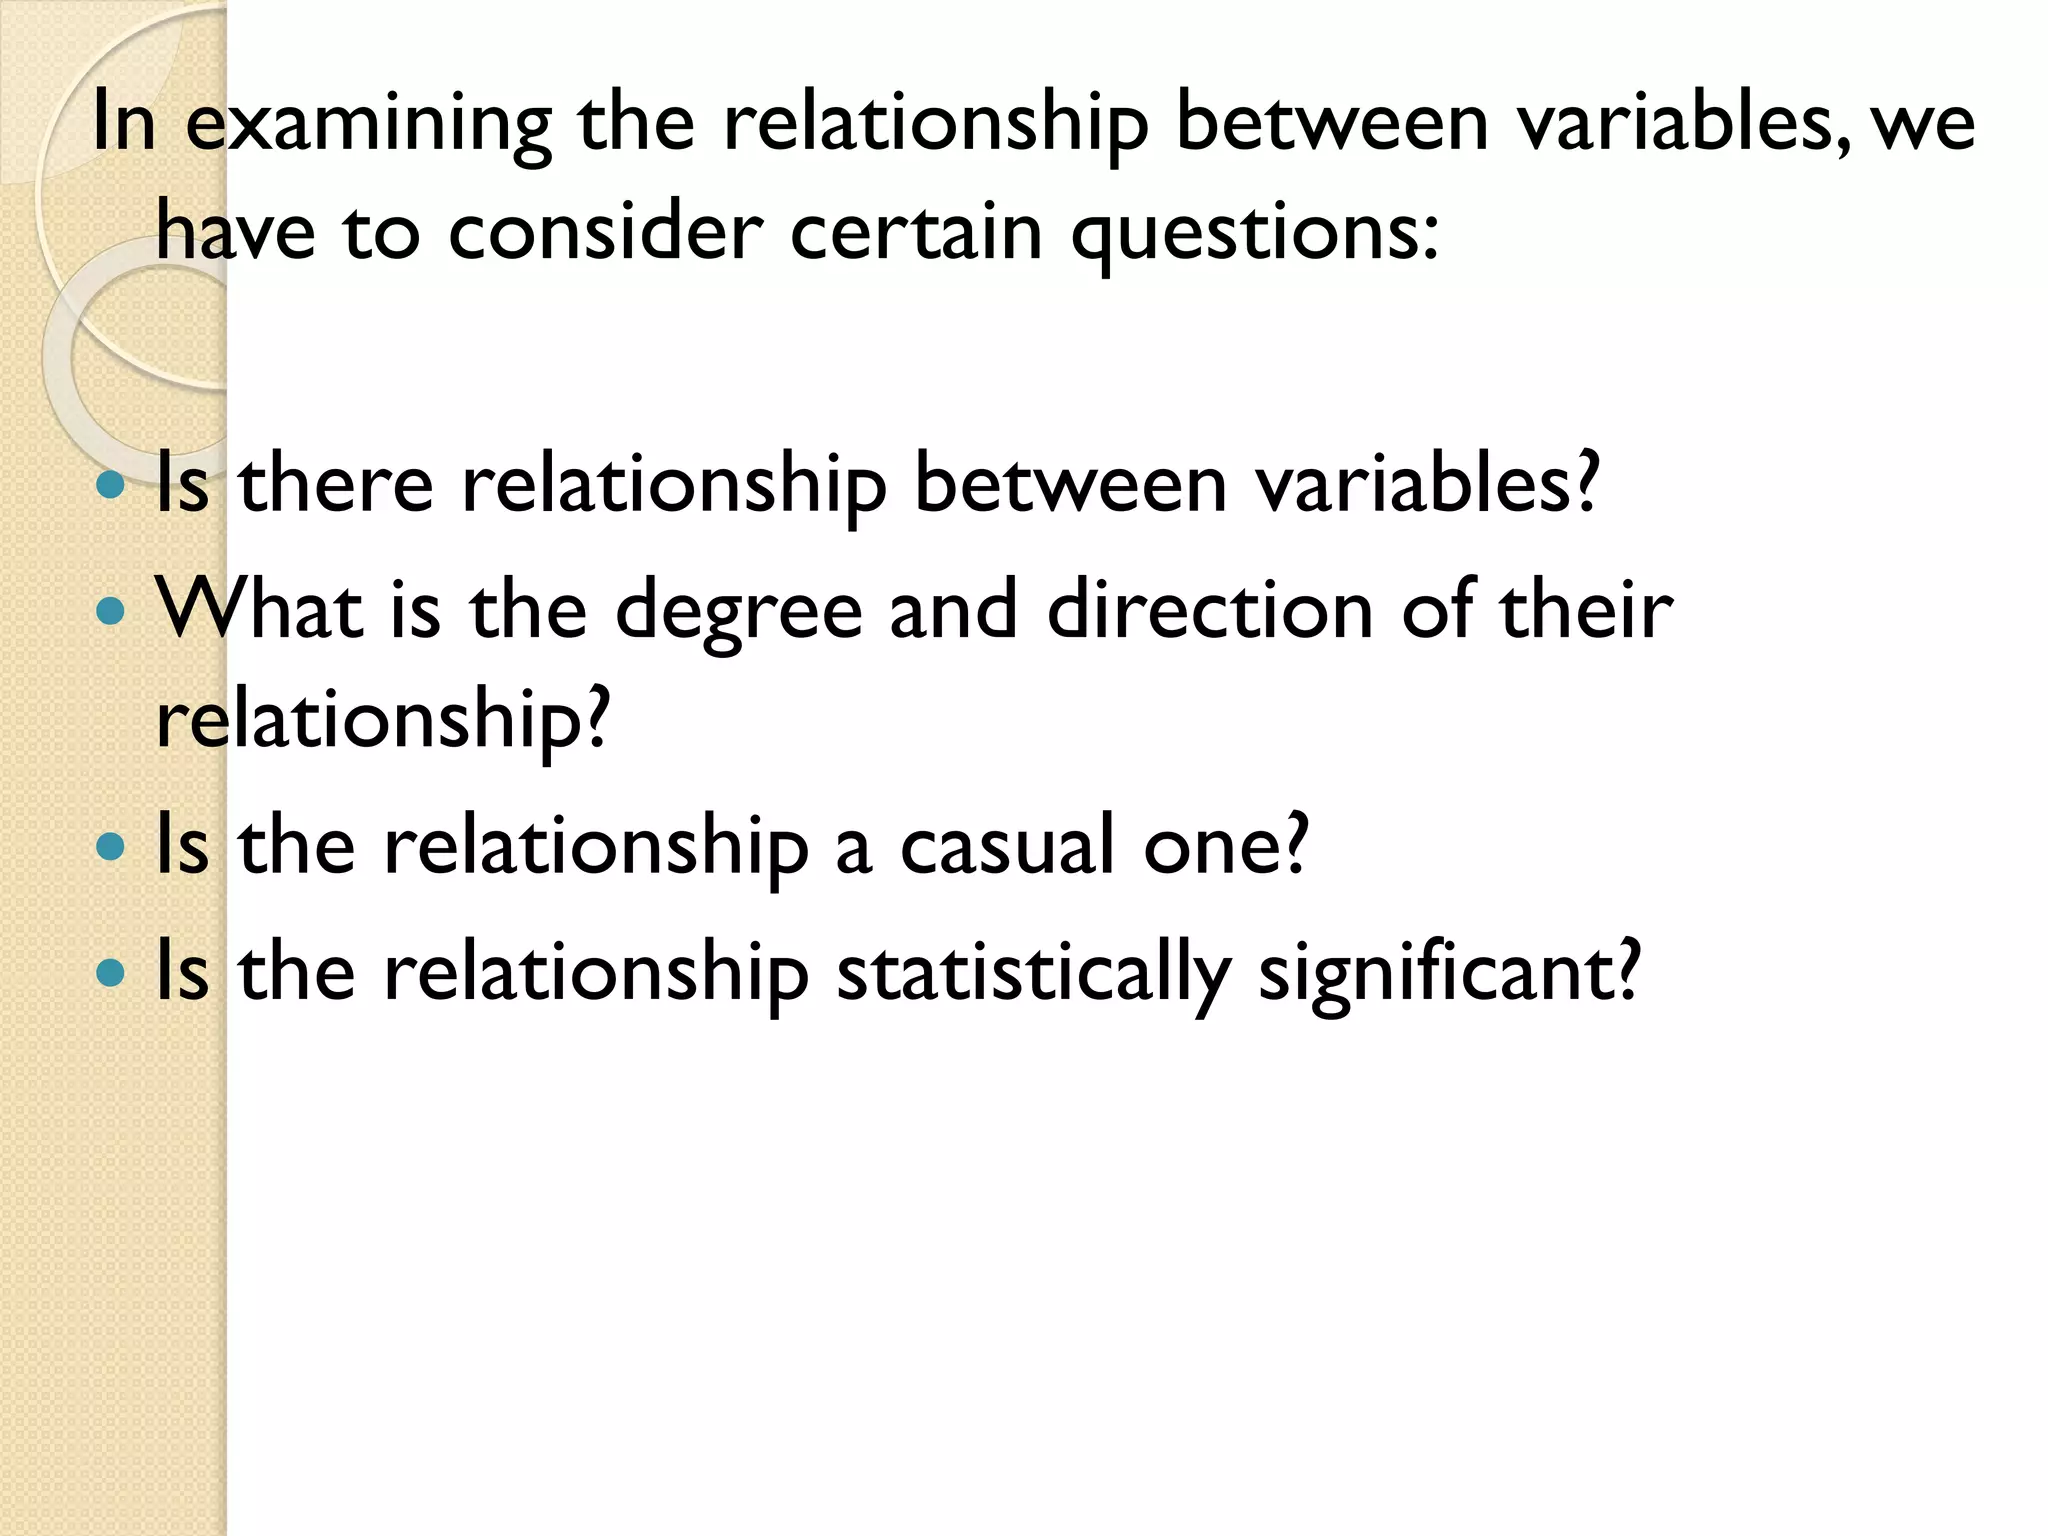
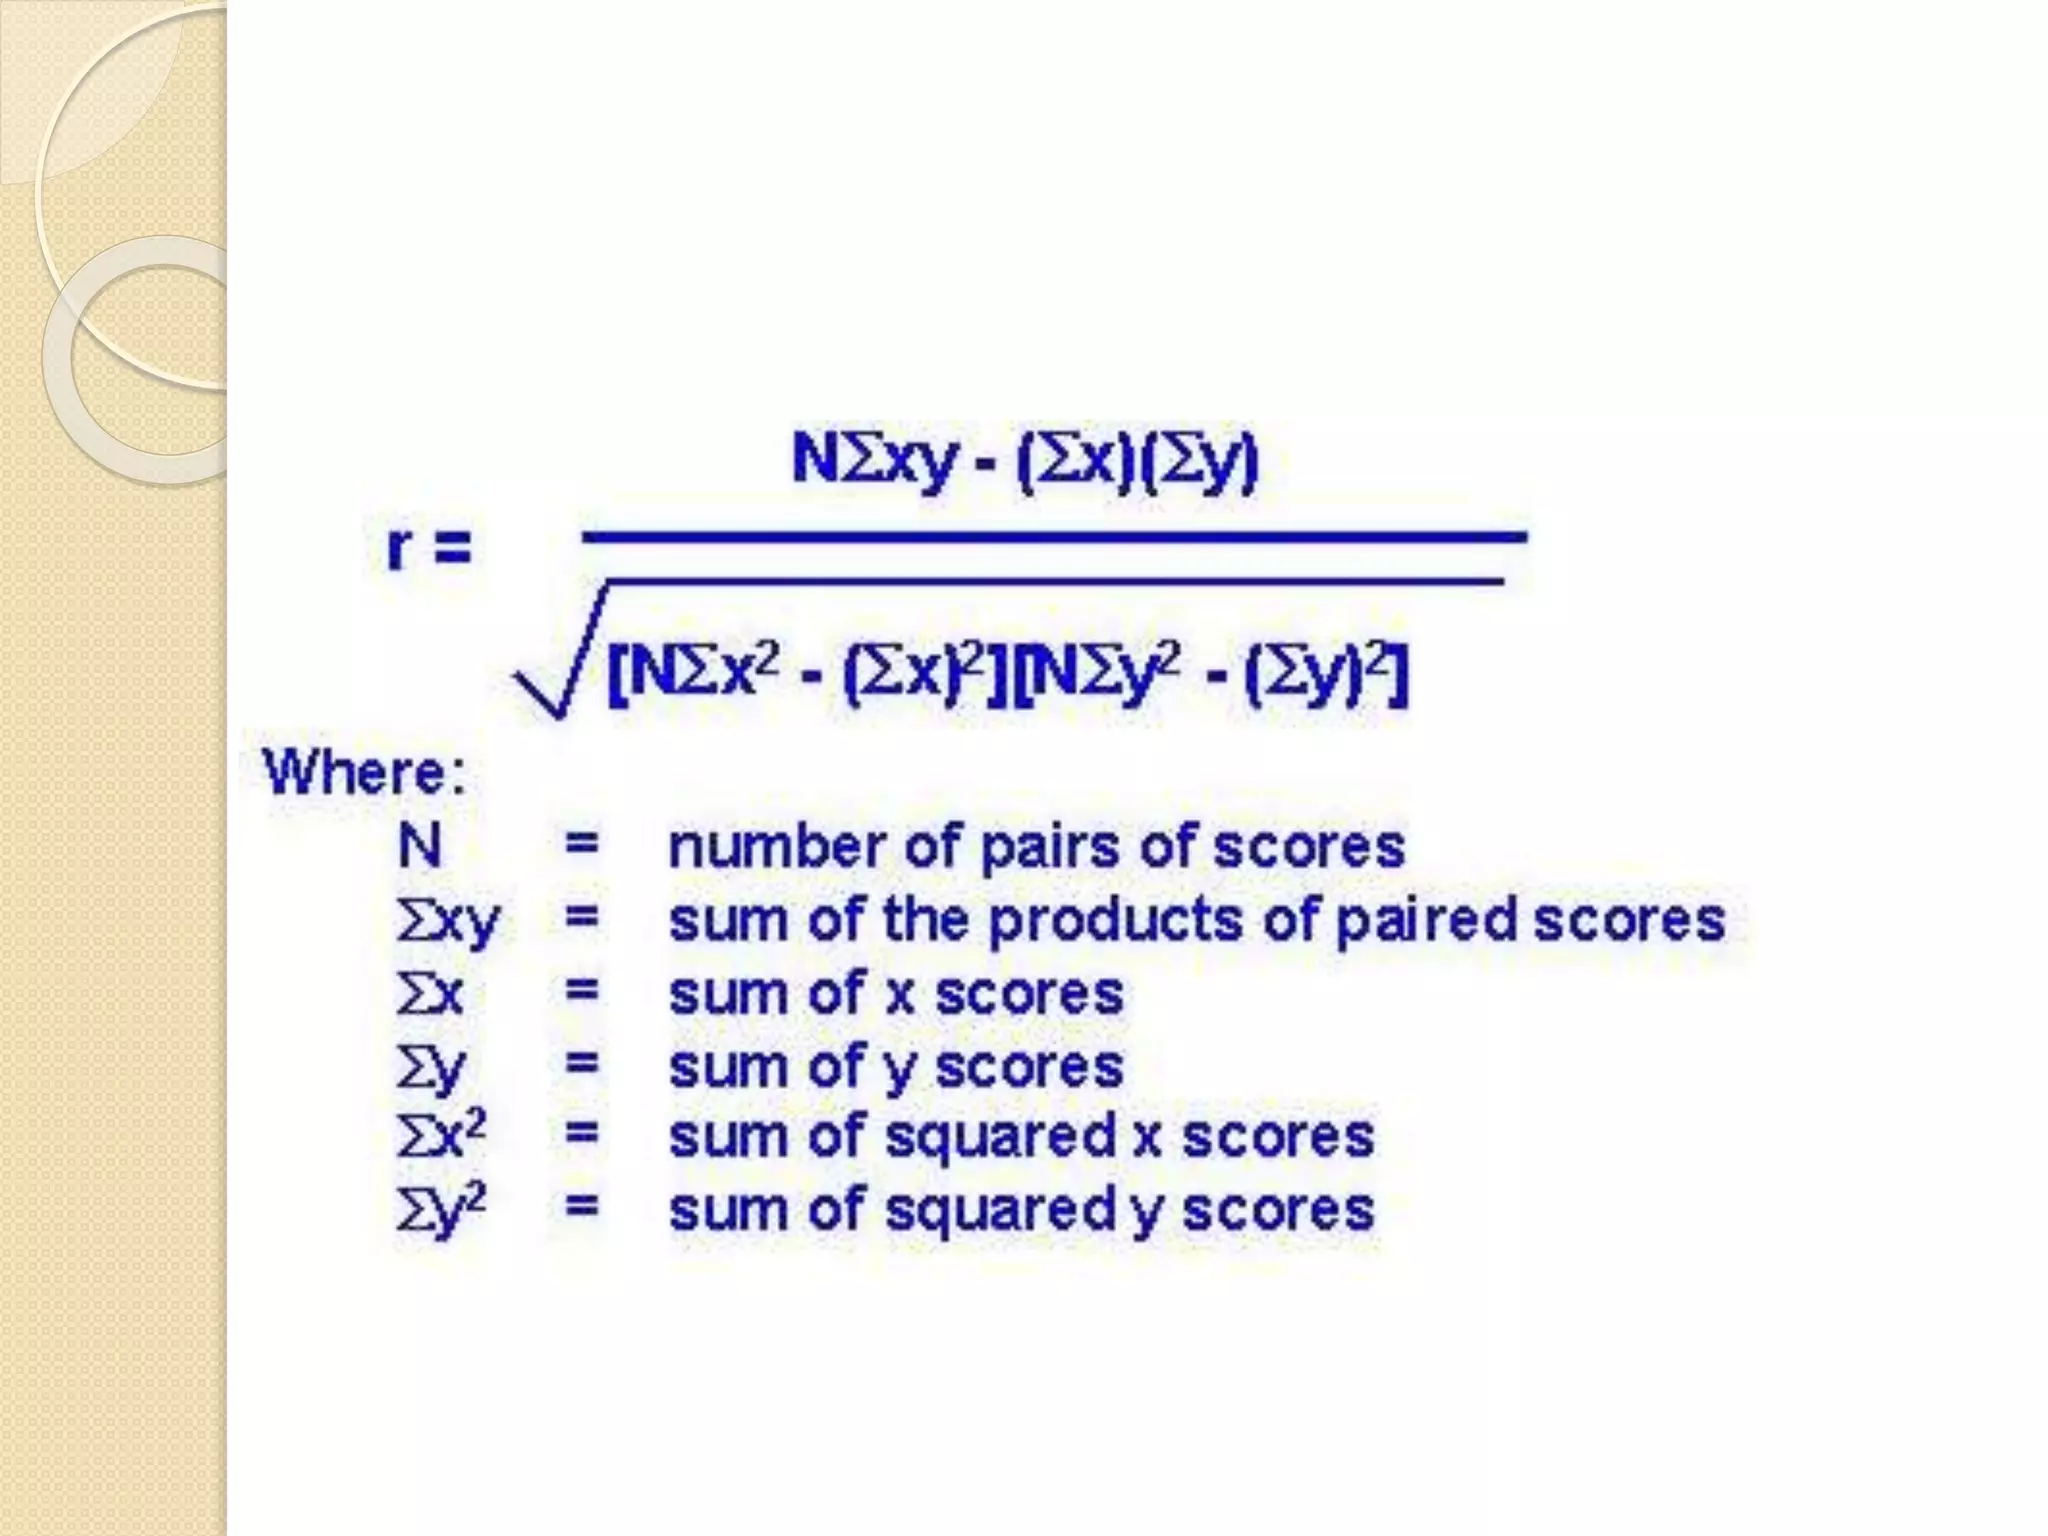
Describes correlation analysis including defining association strength, significance testing, and identifying cause-effect relations.
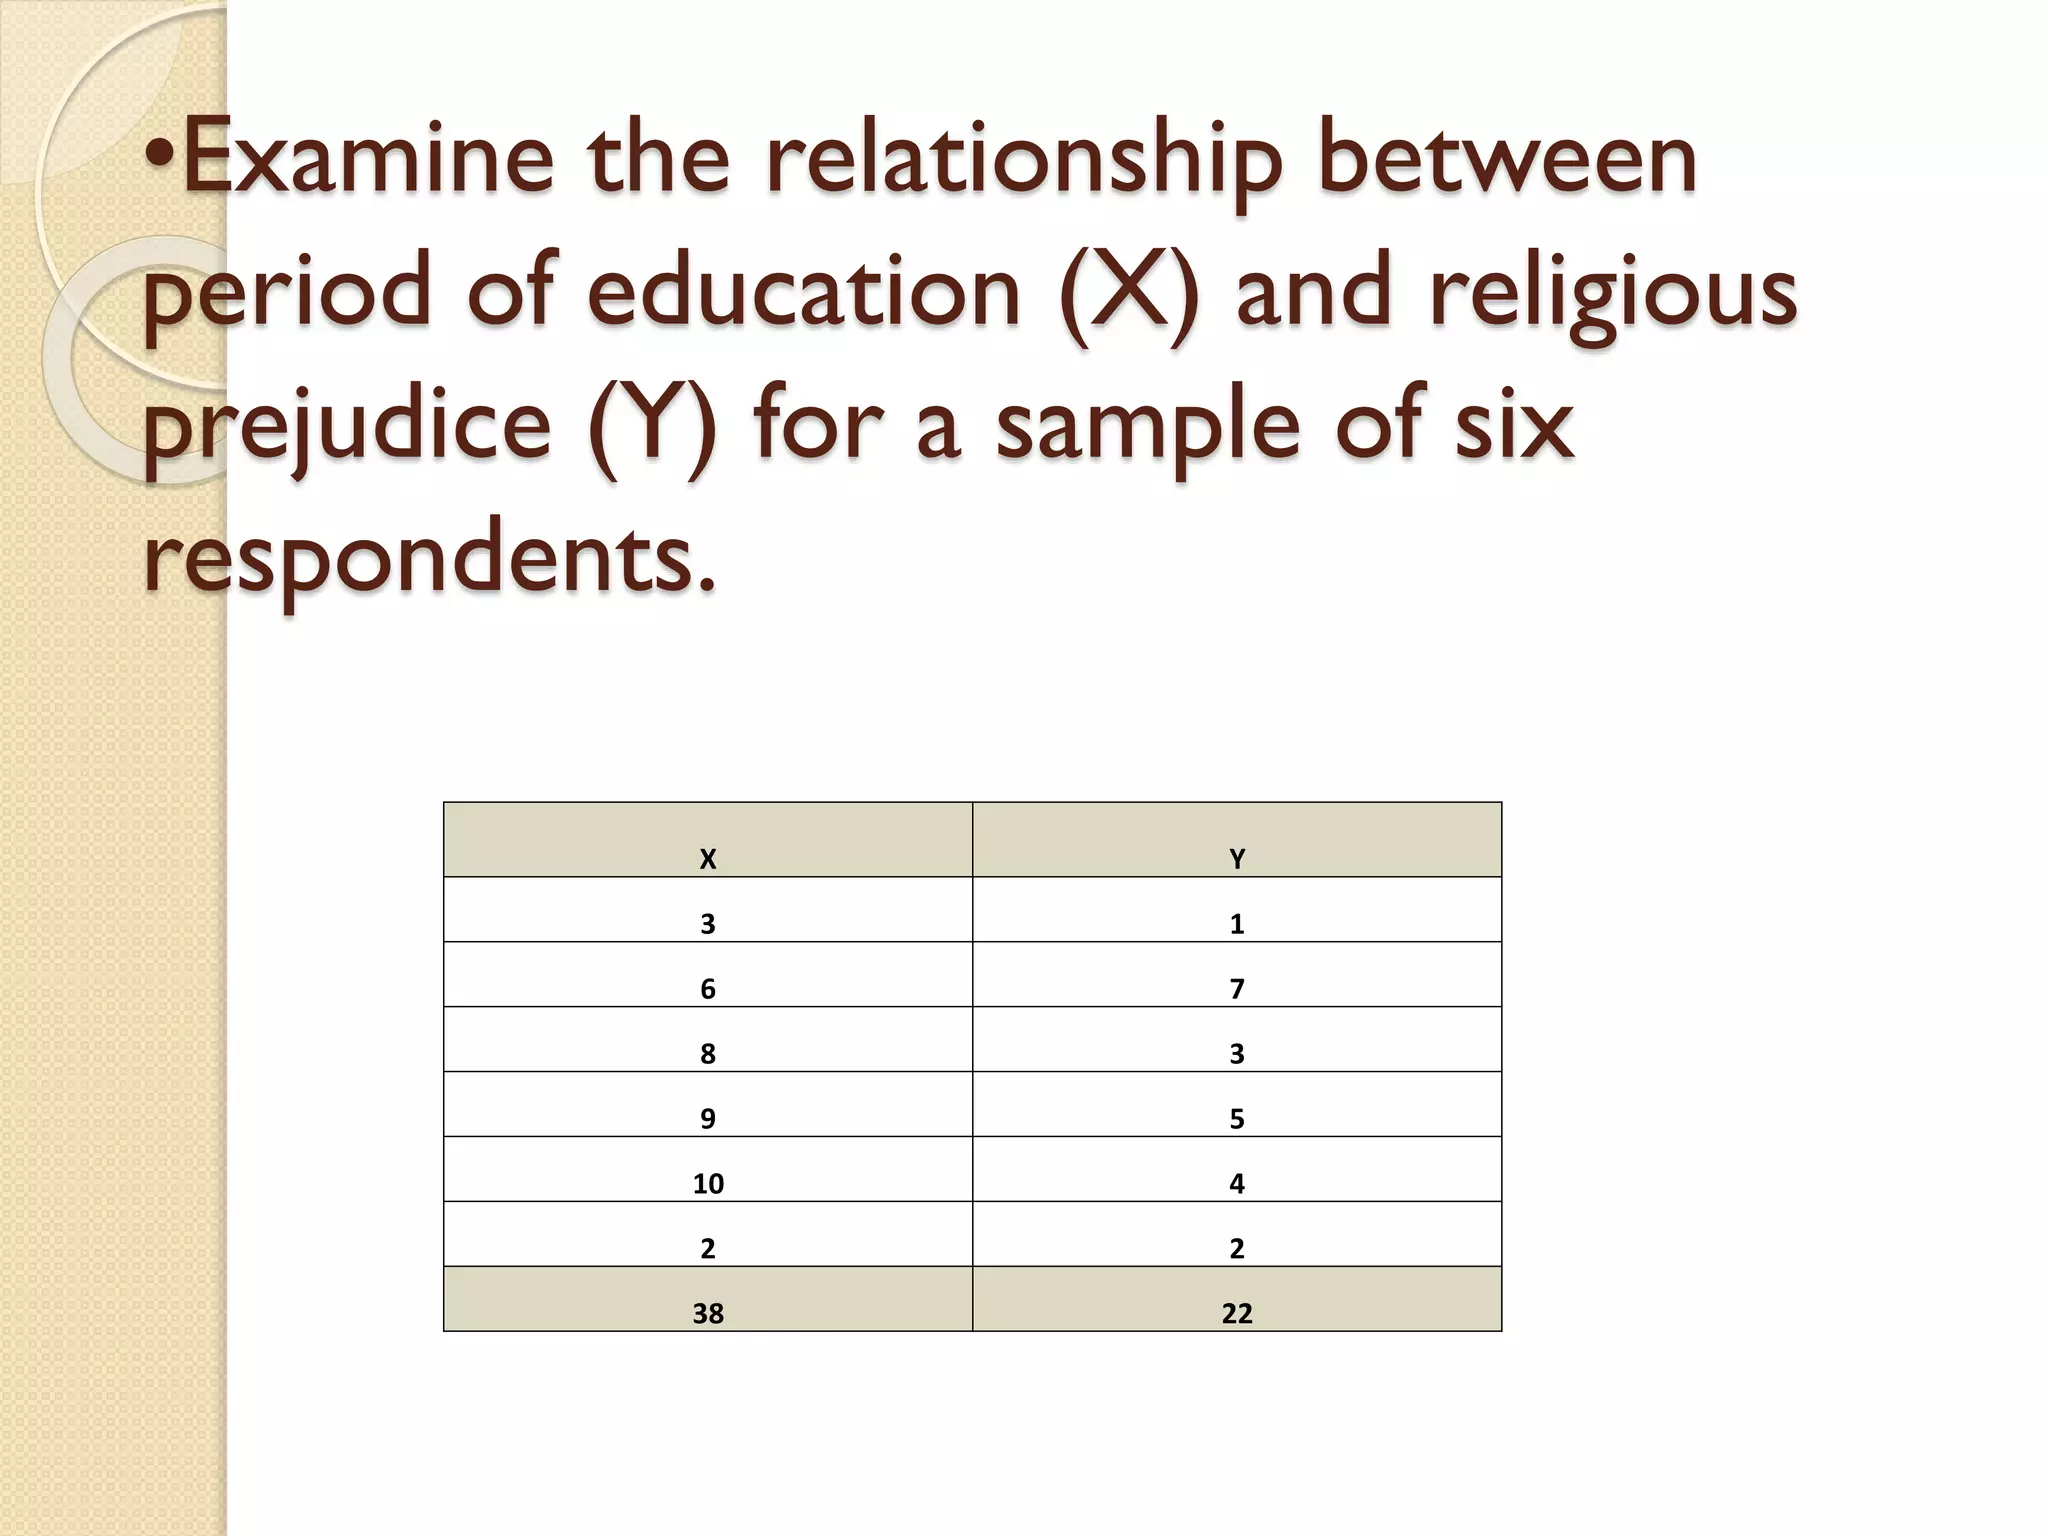
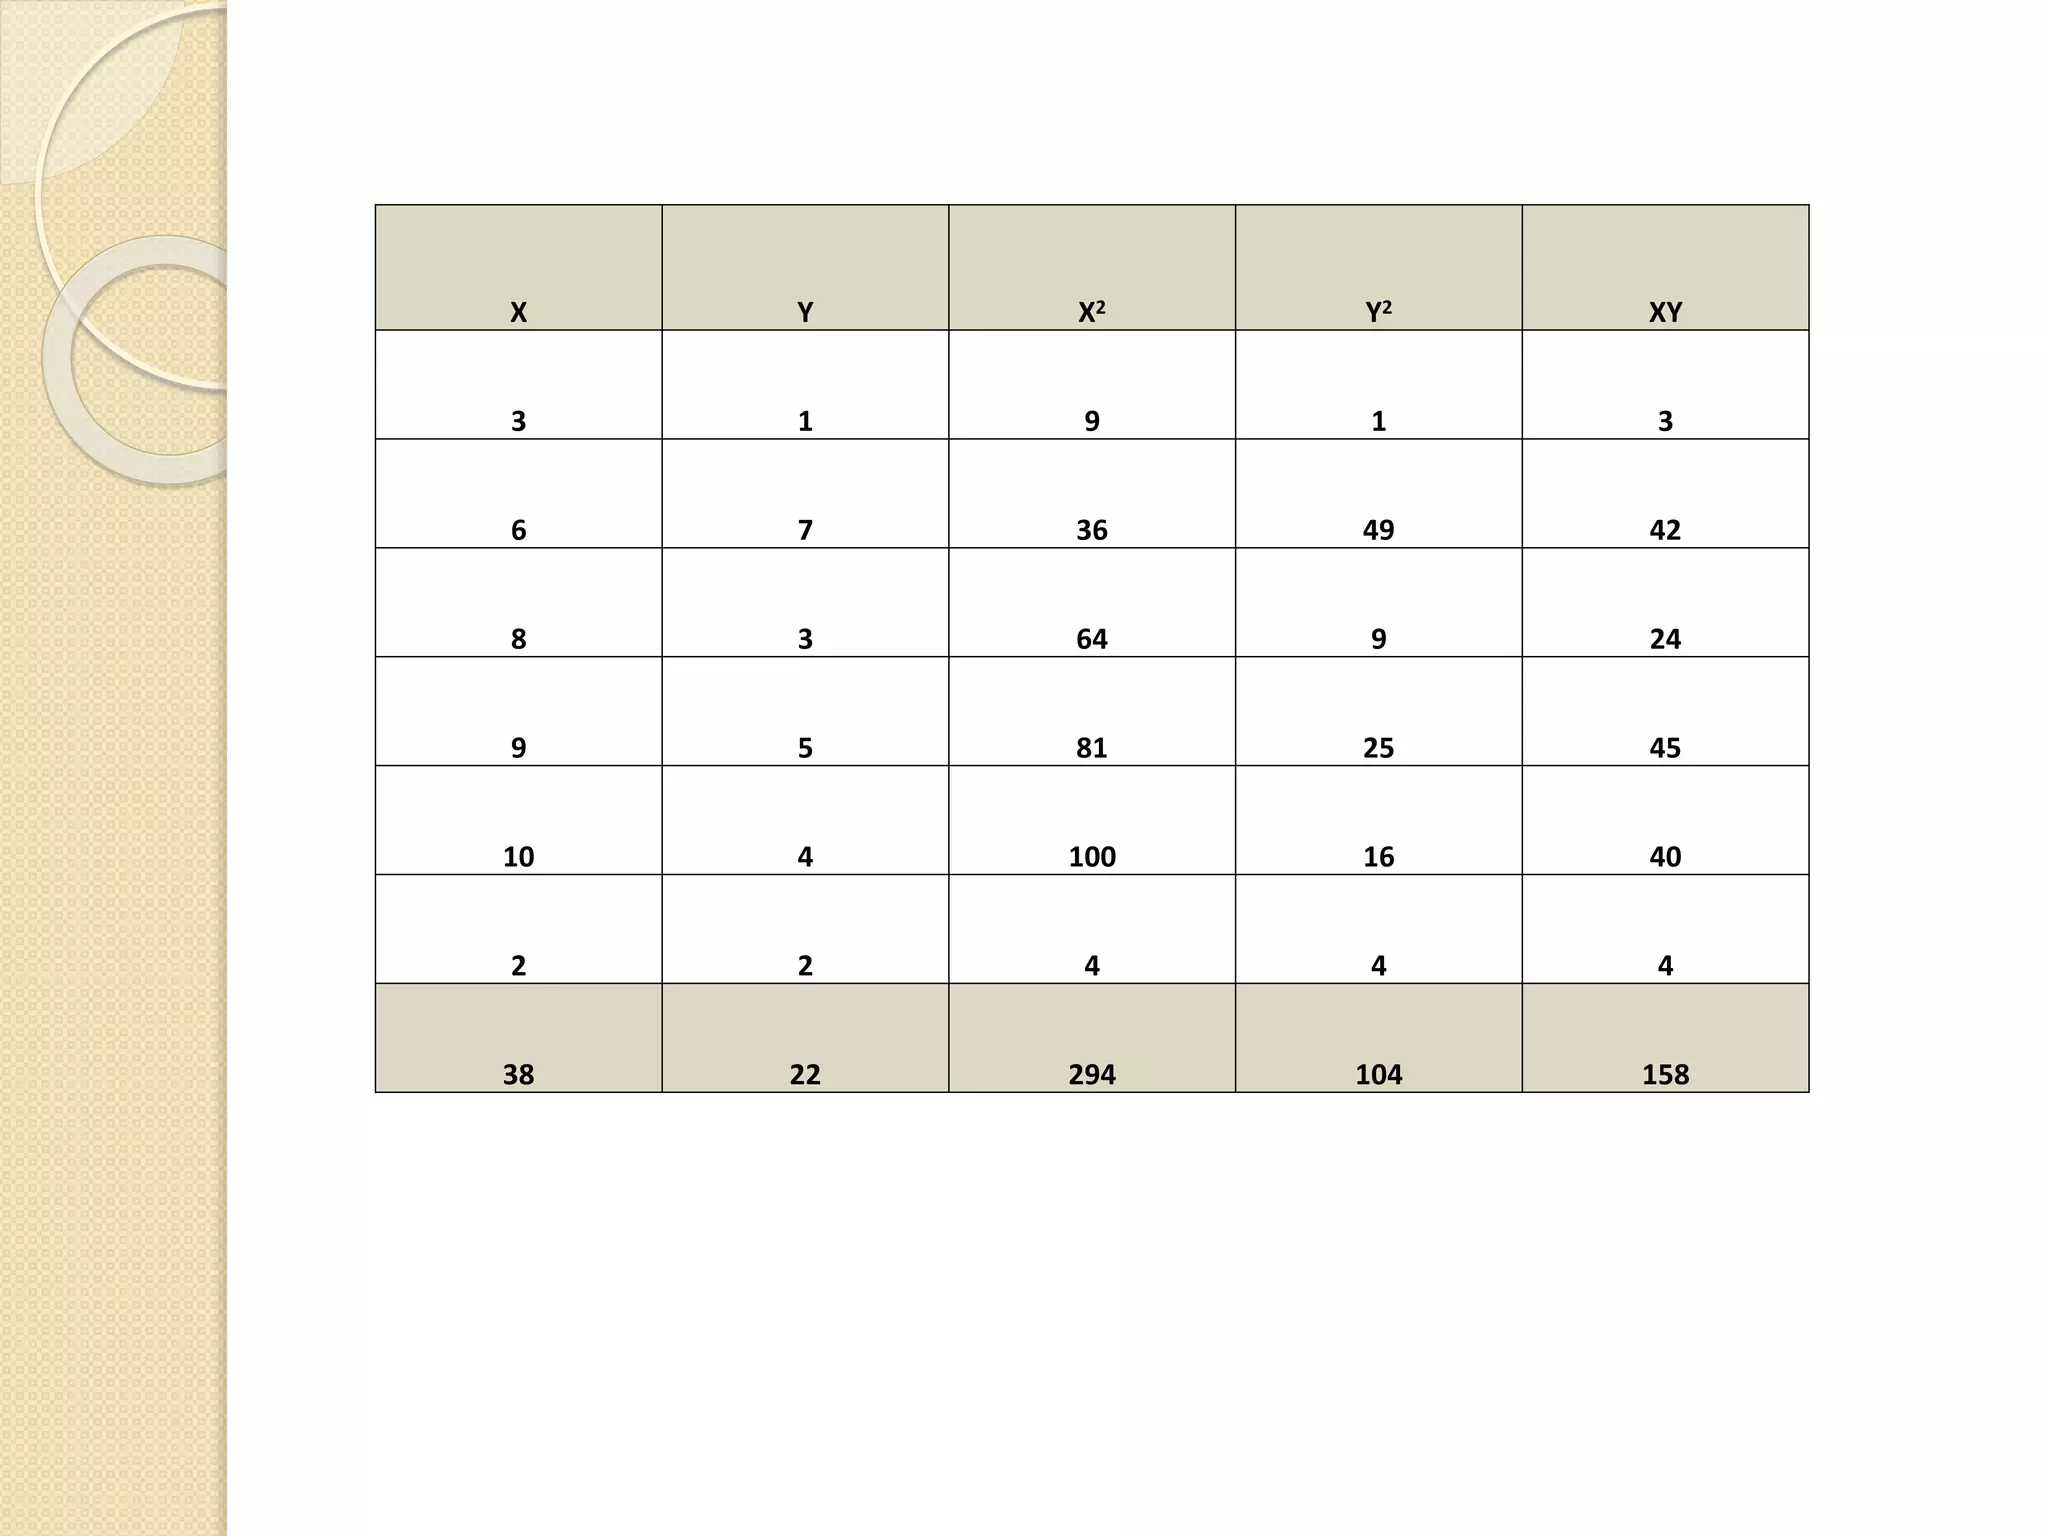
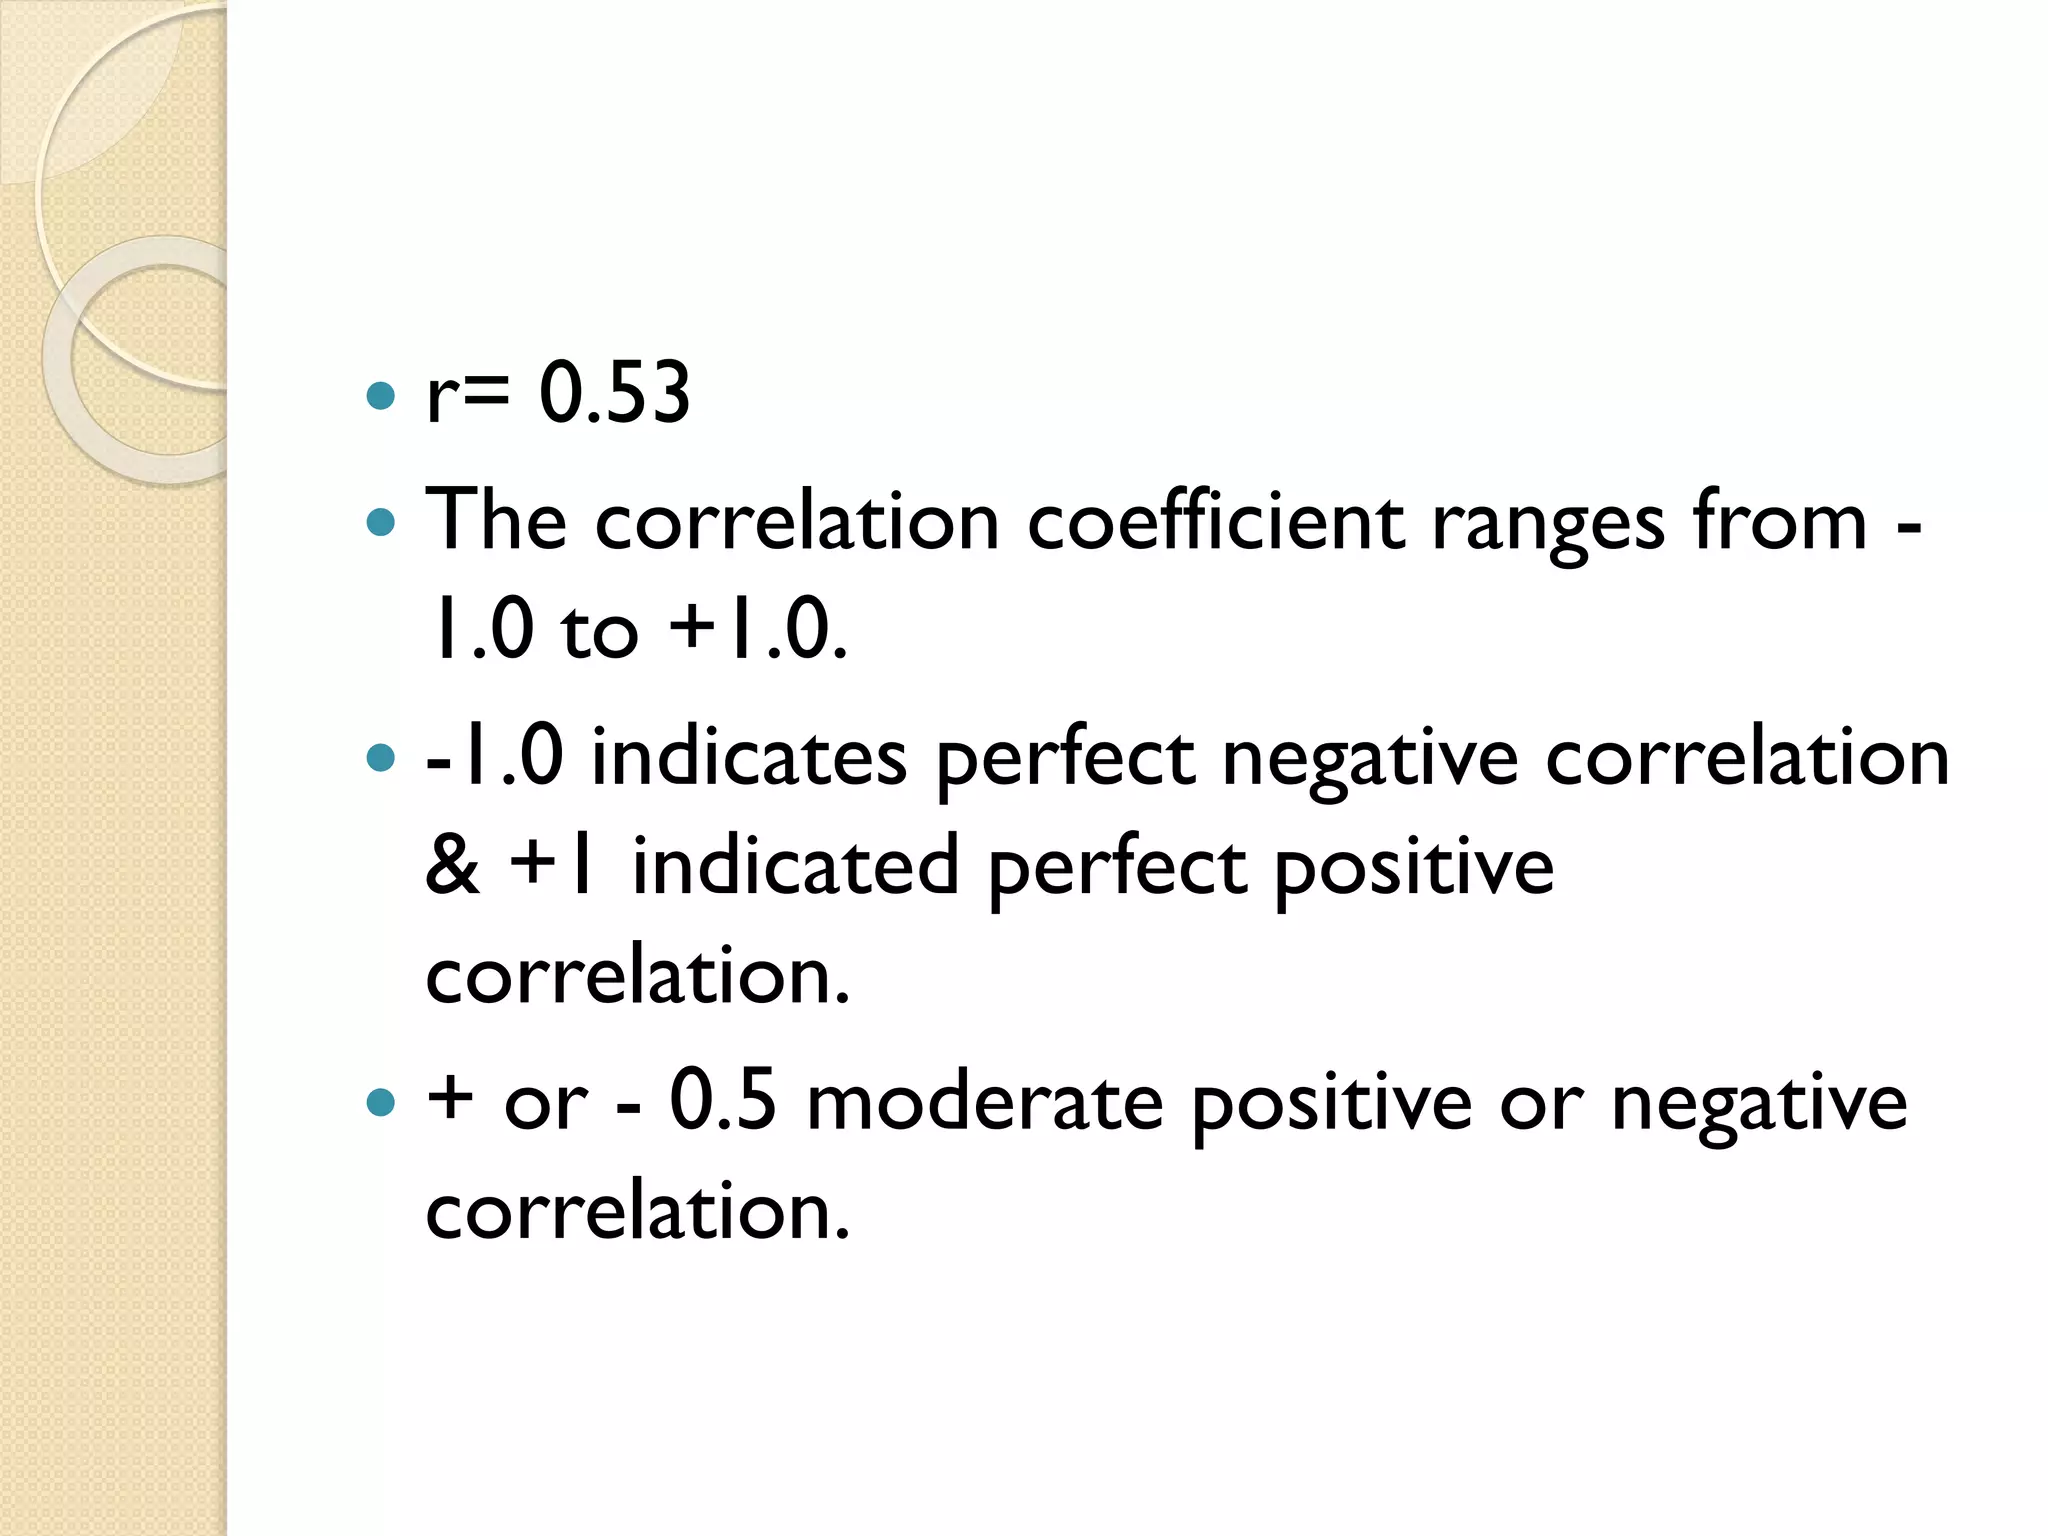
Analyzes the correlation between education period and religious prejudice, providing statistical data and interpretation.


