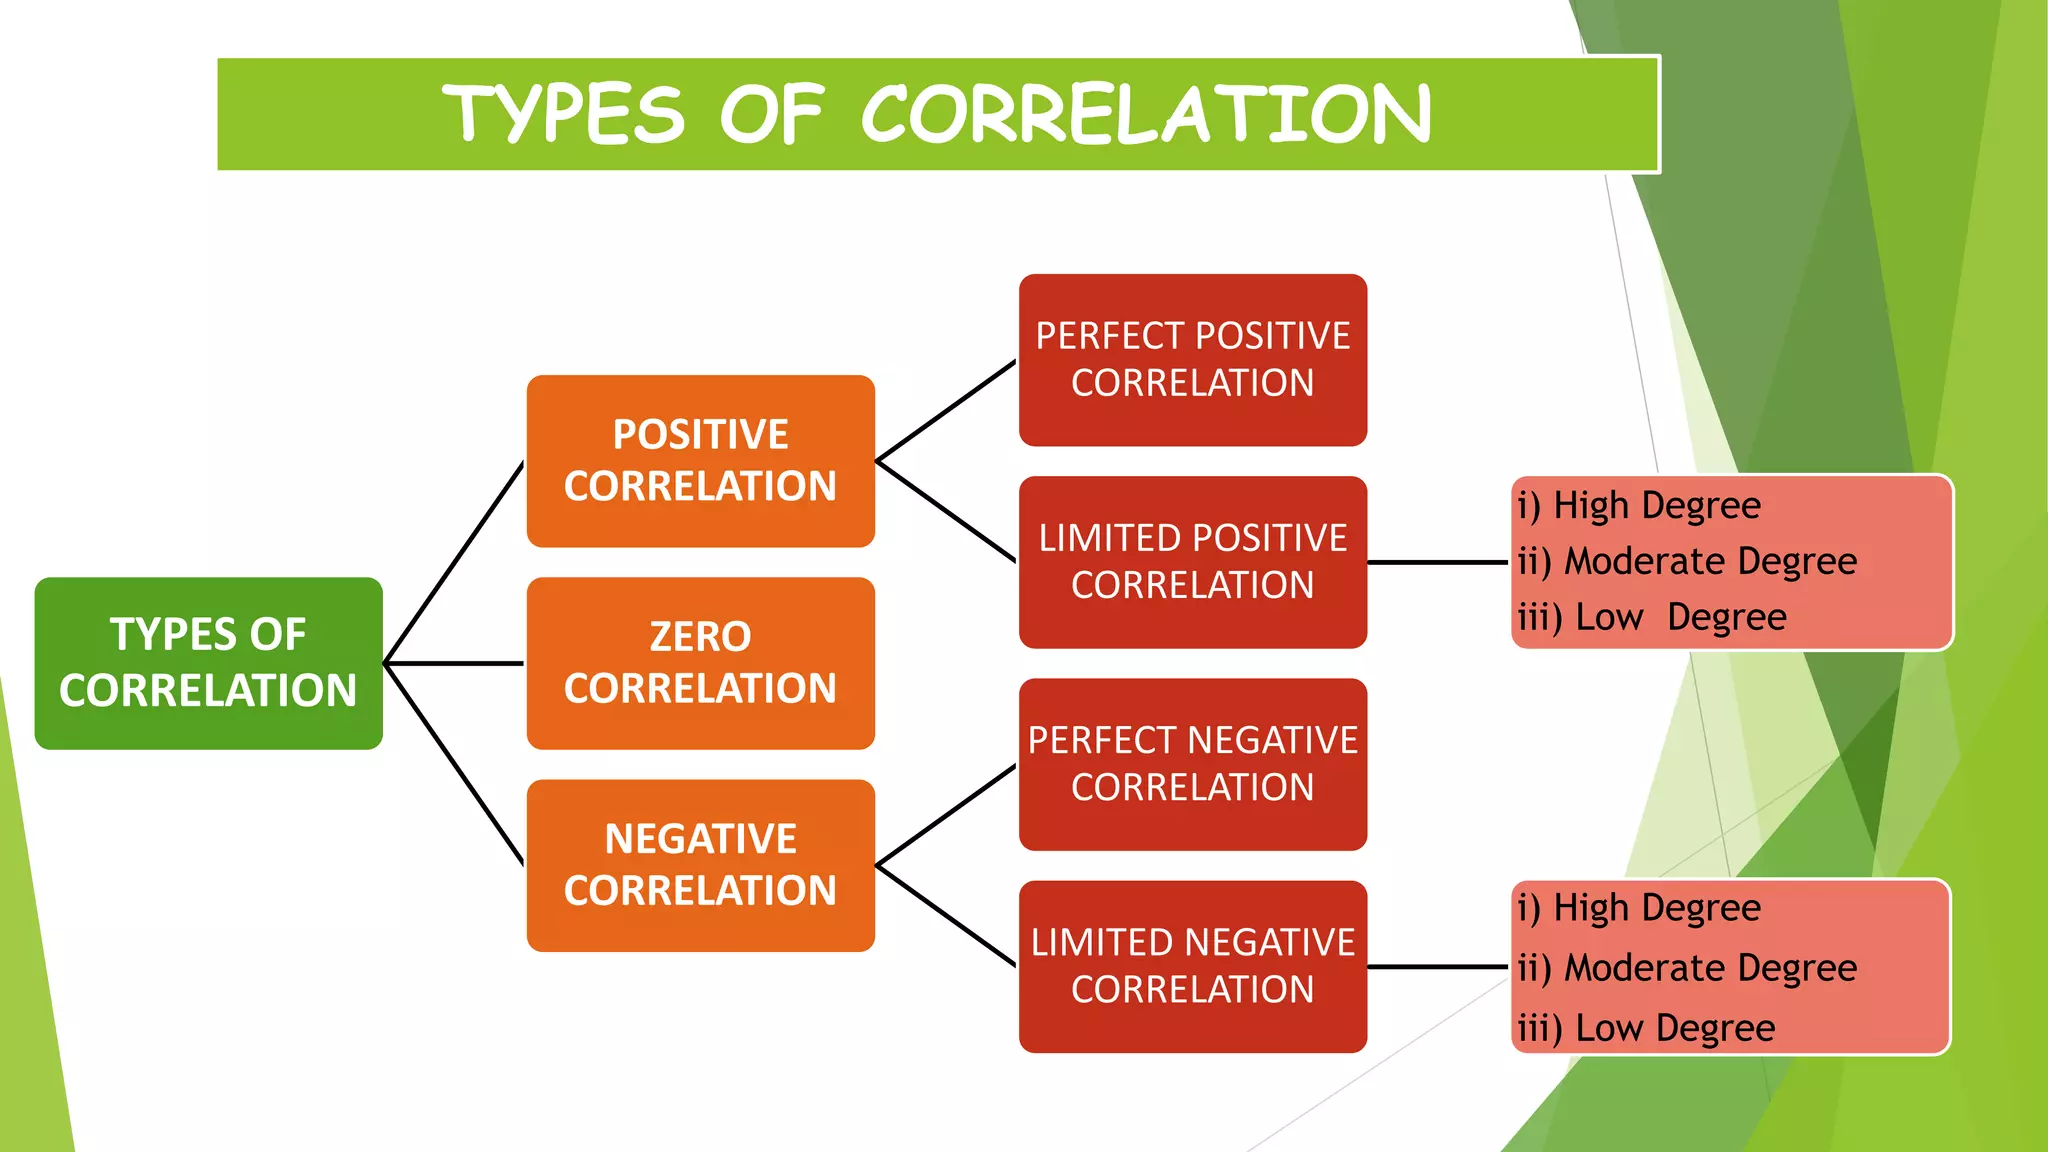
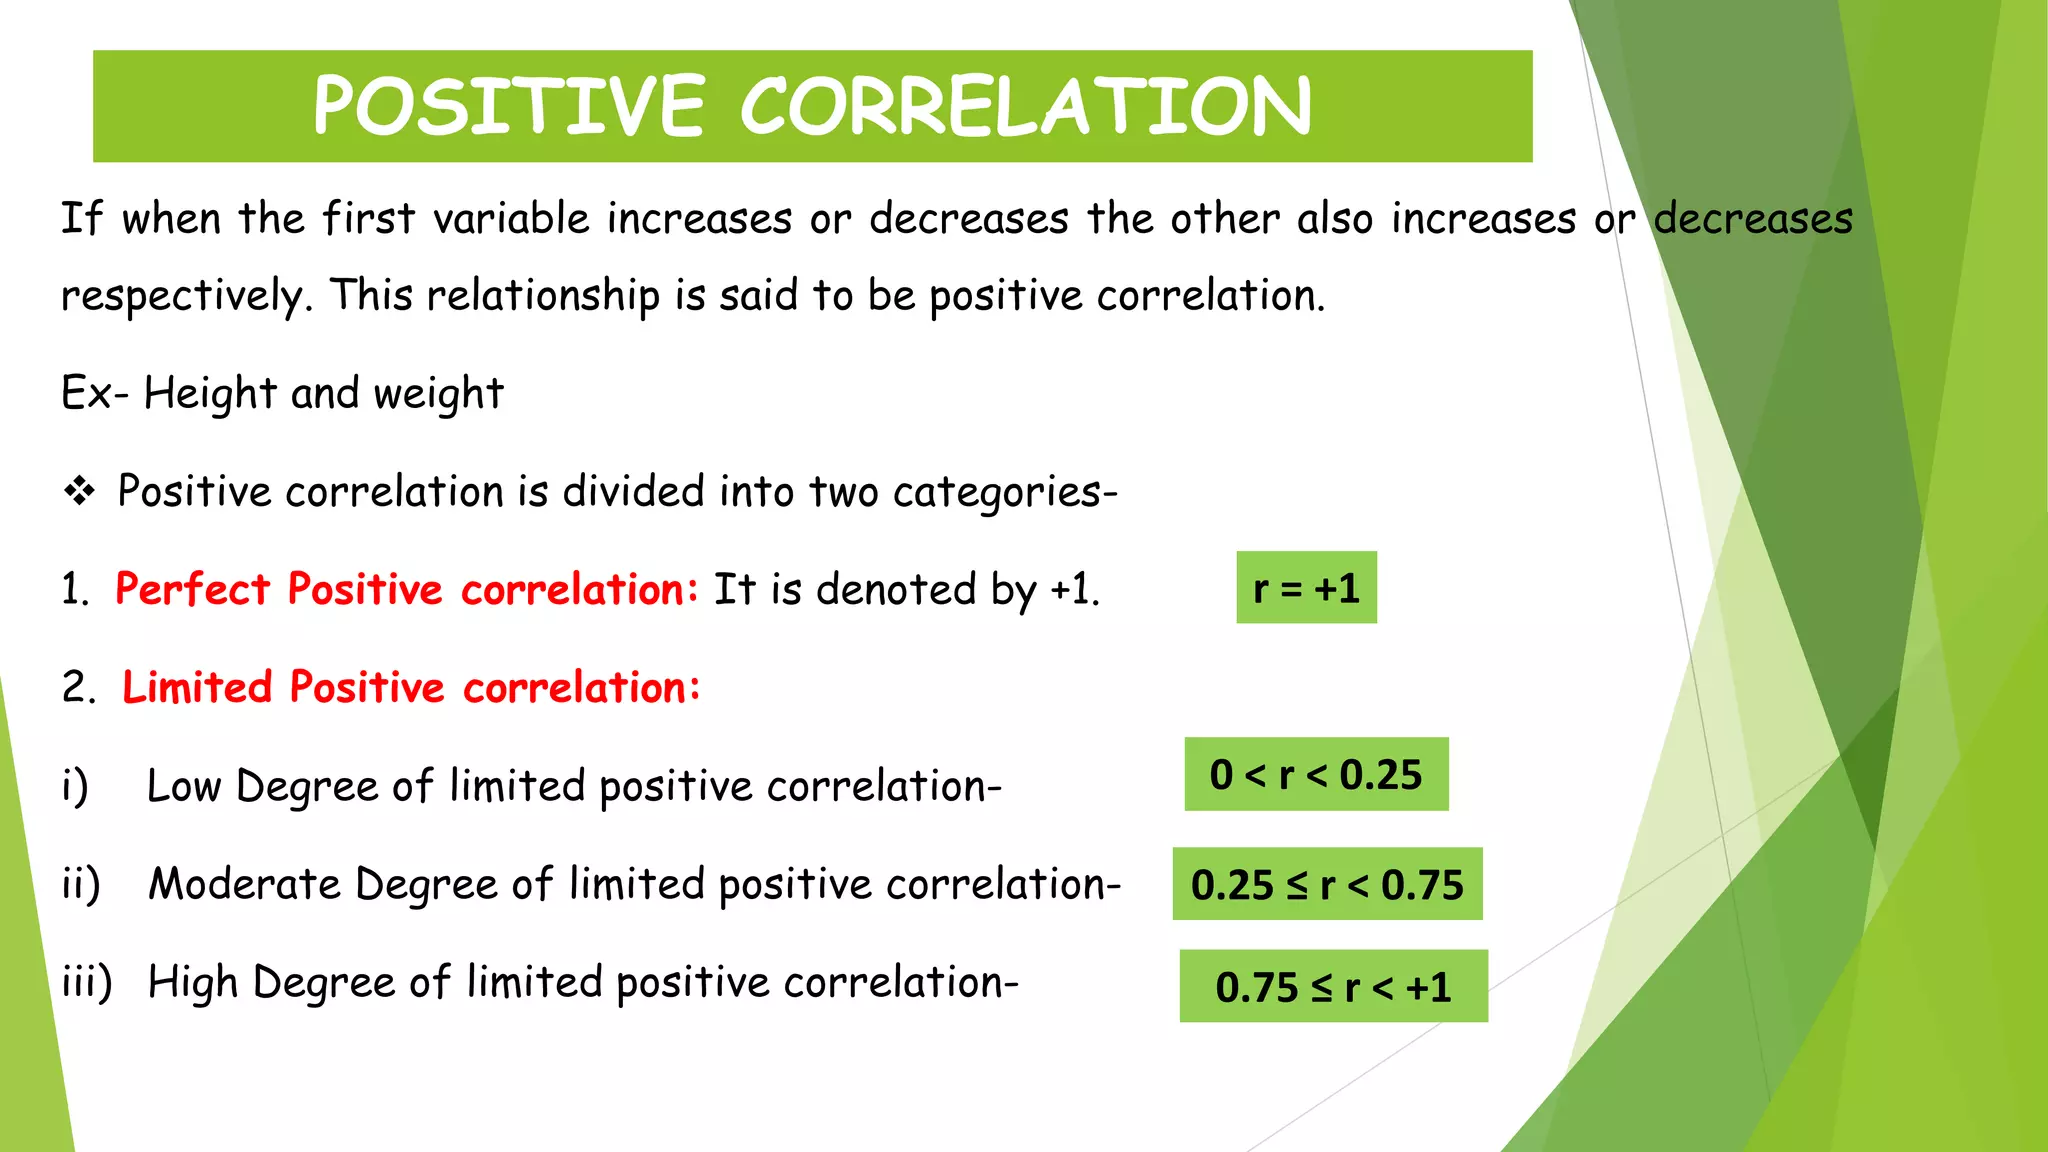
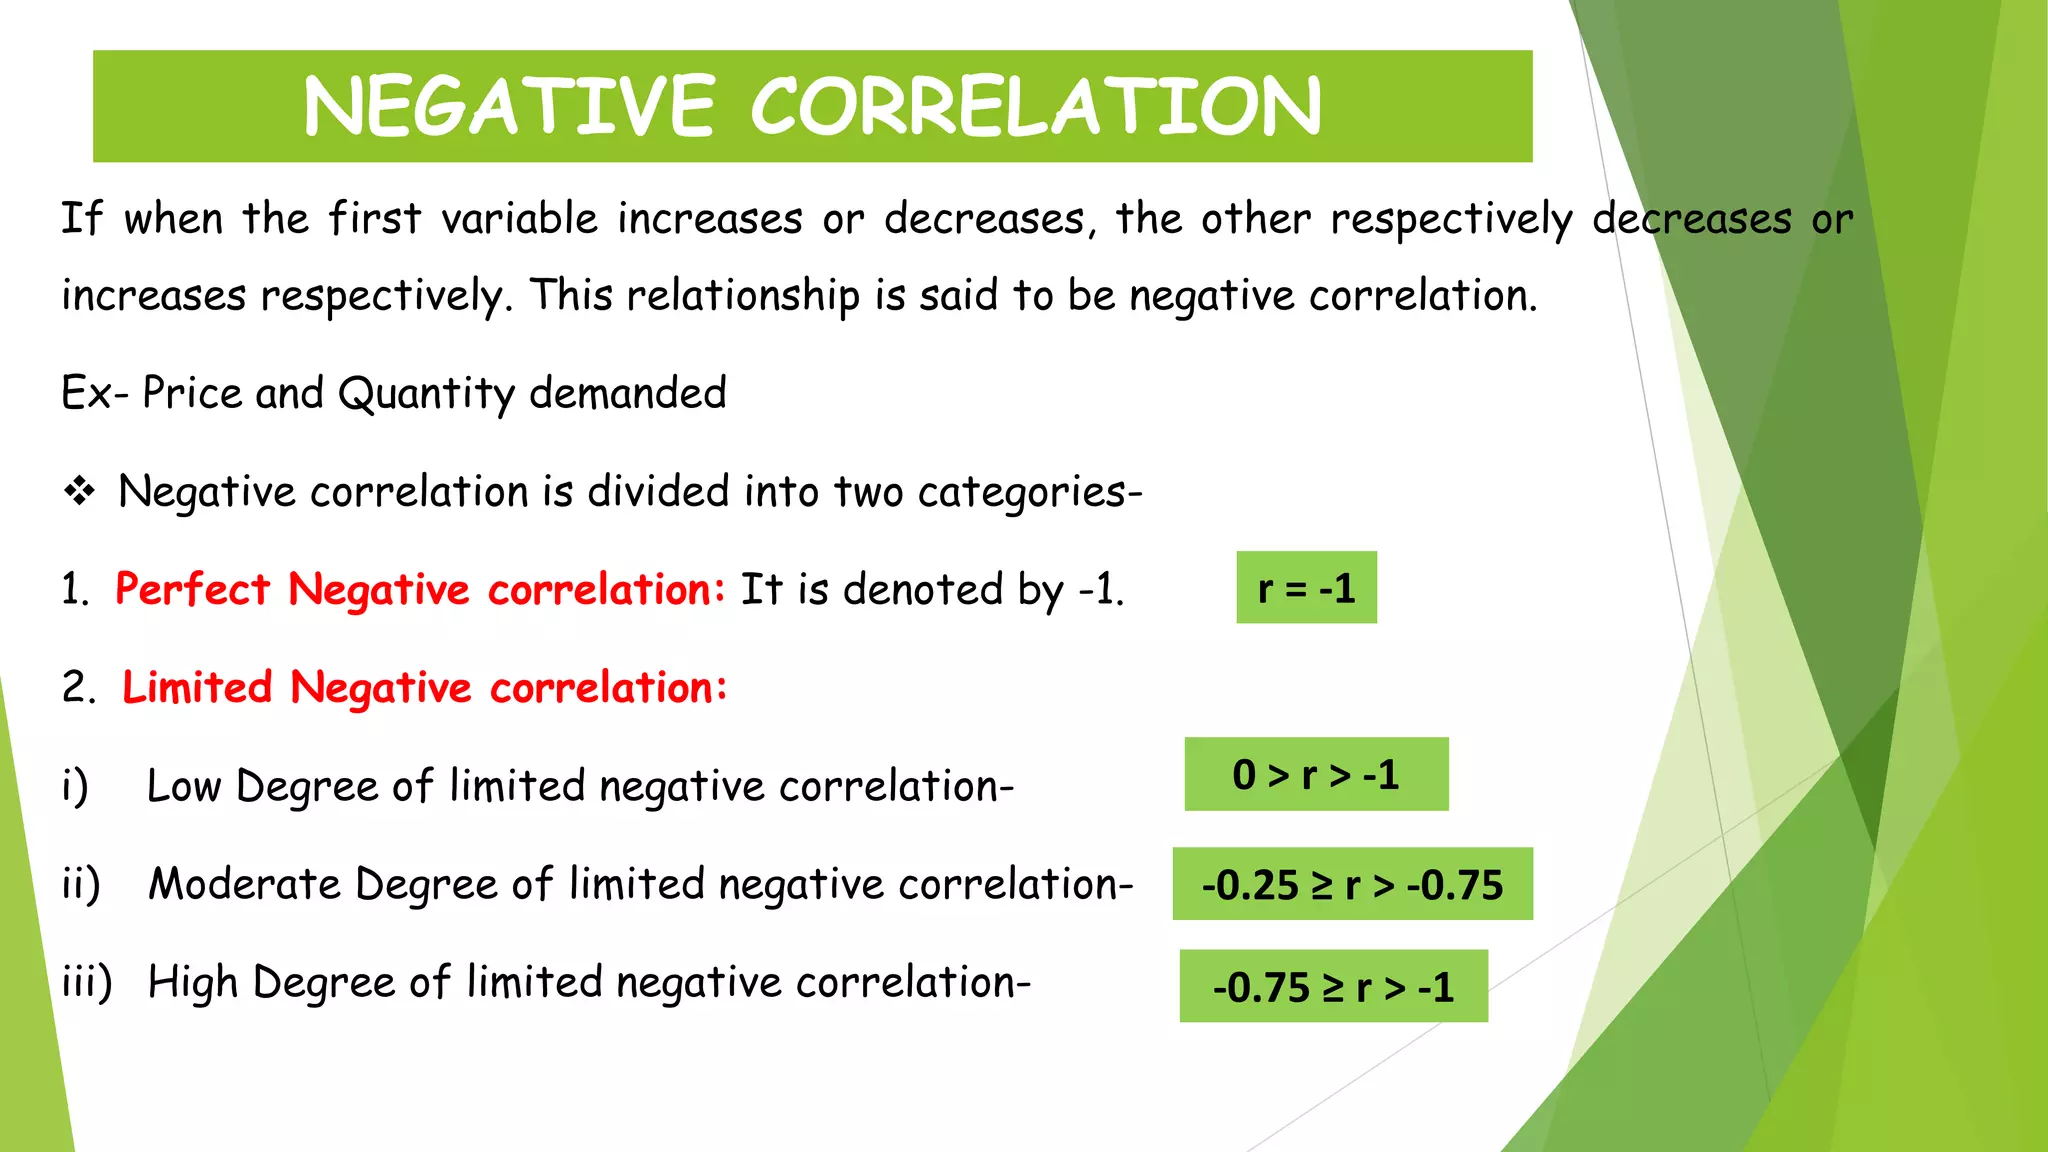
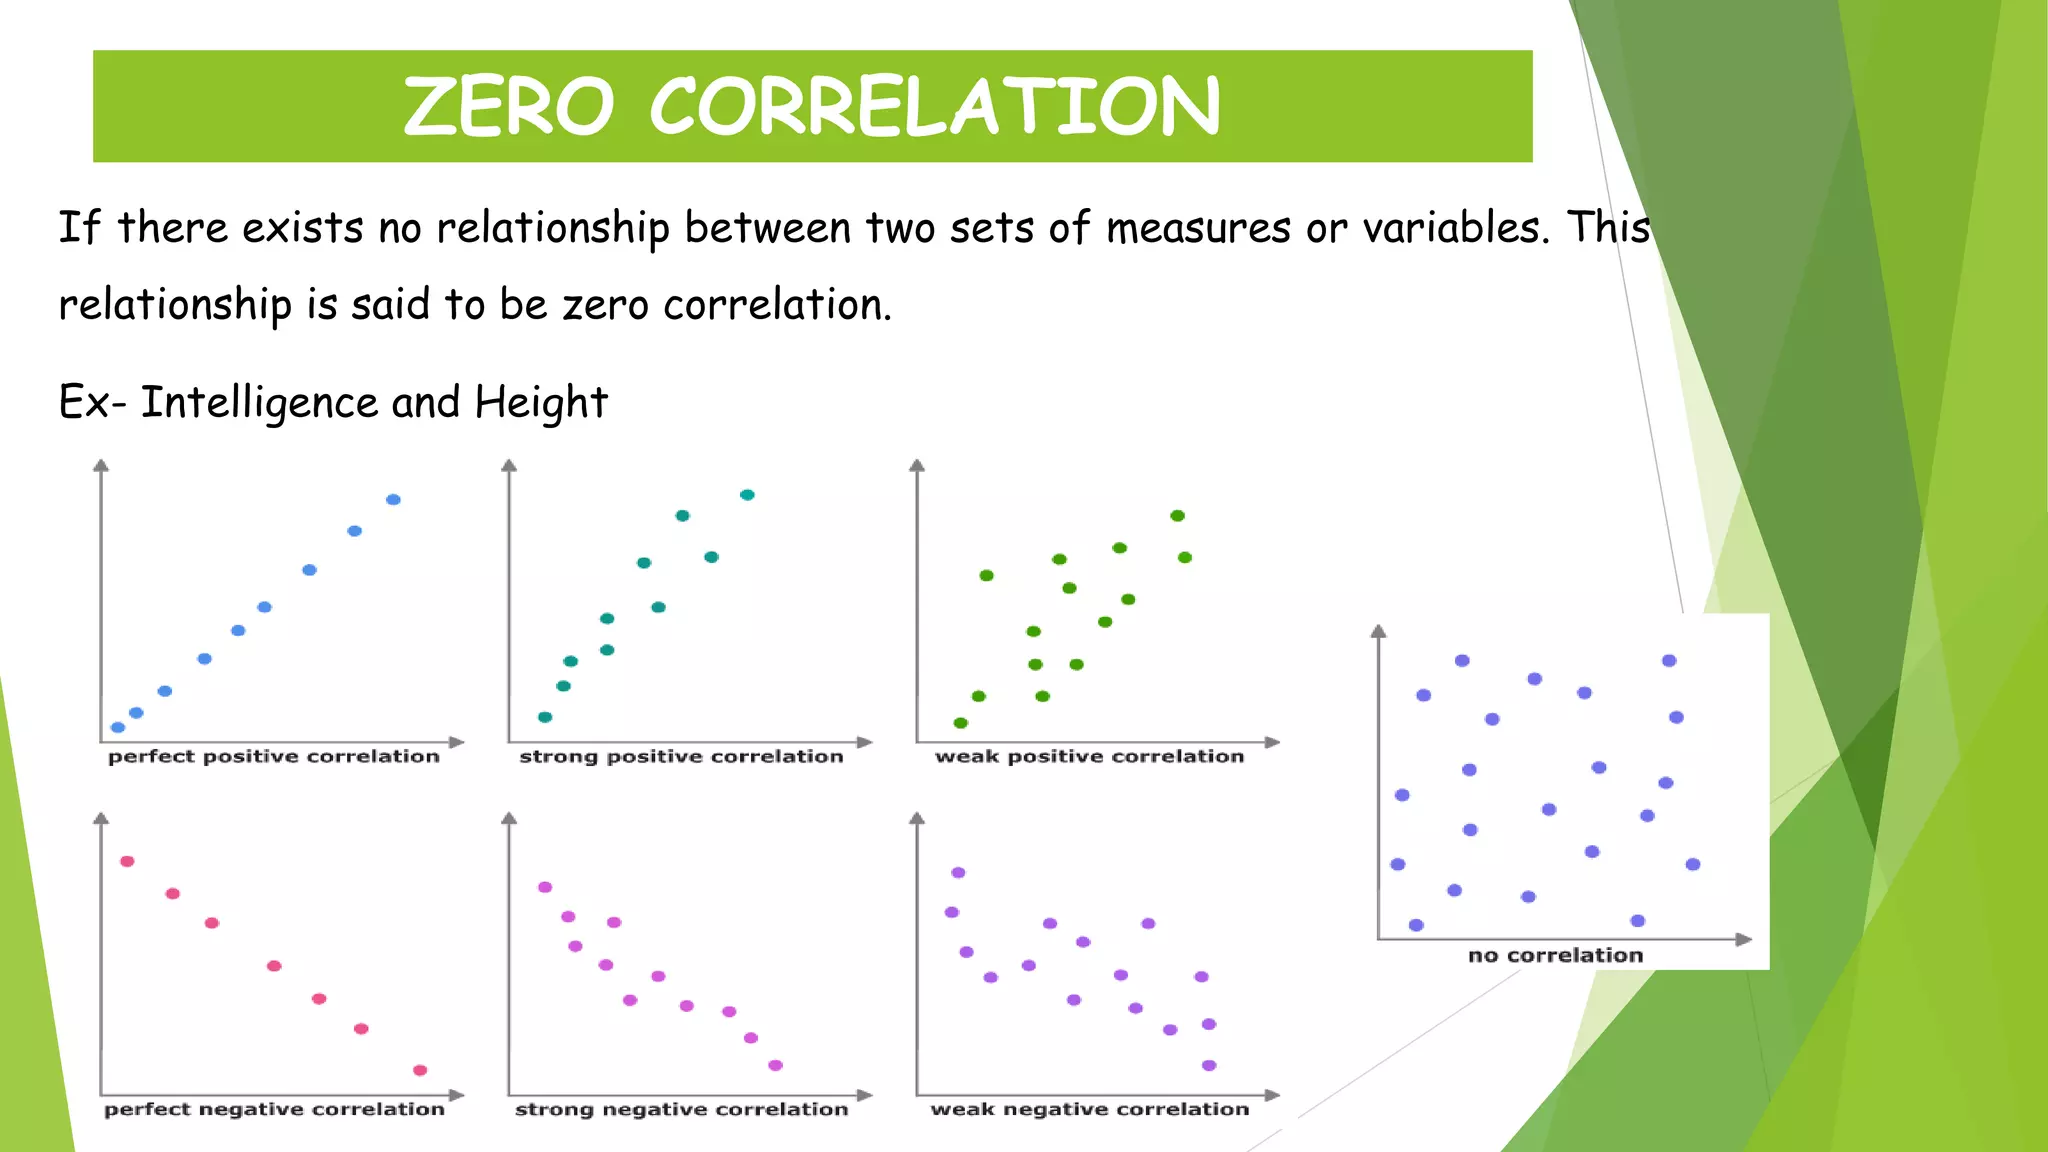
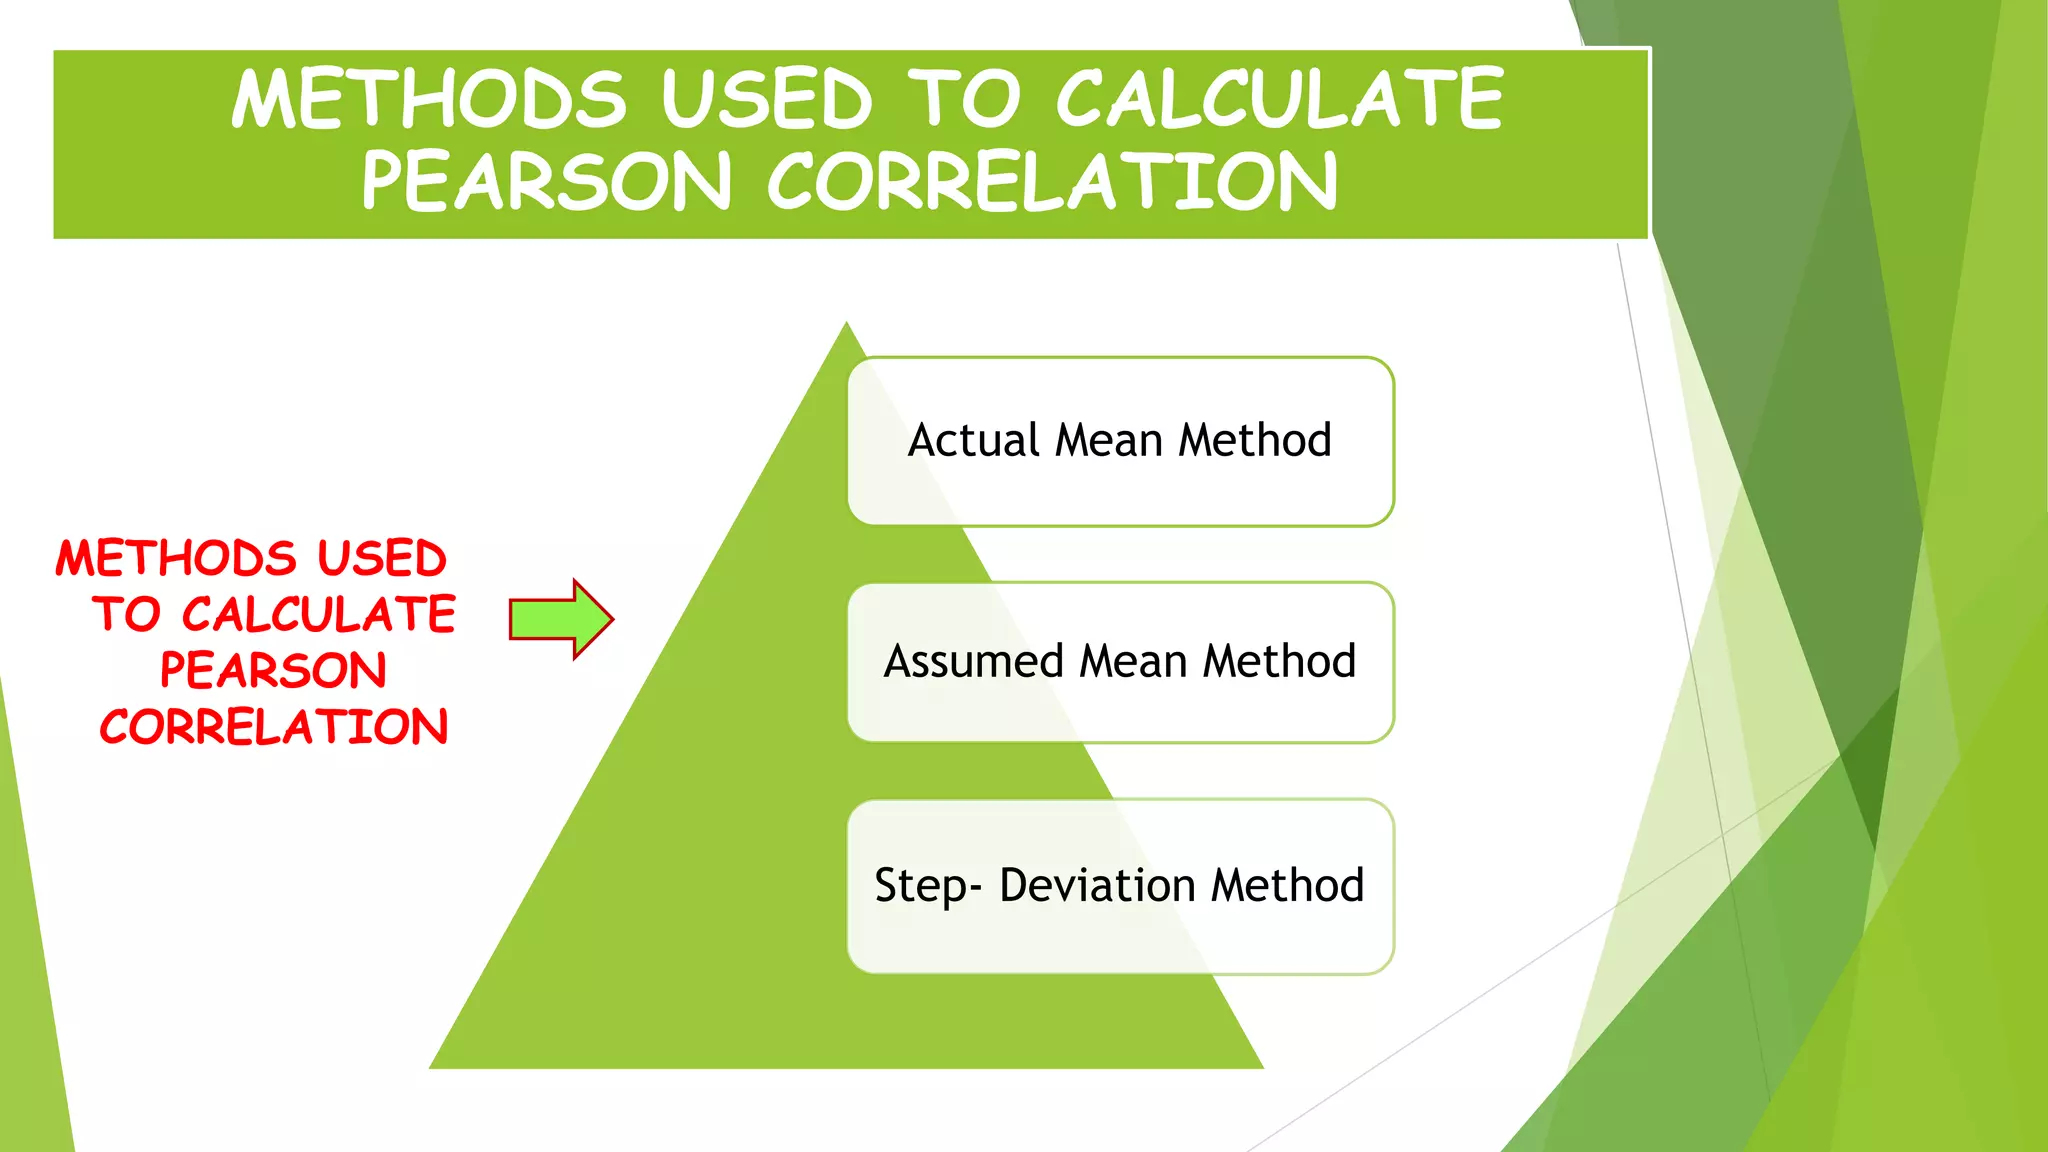
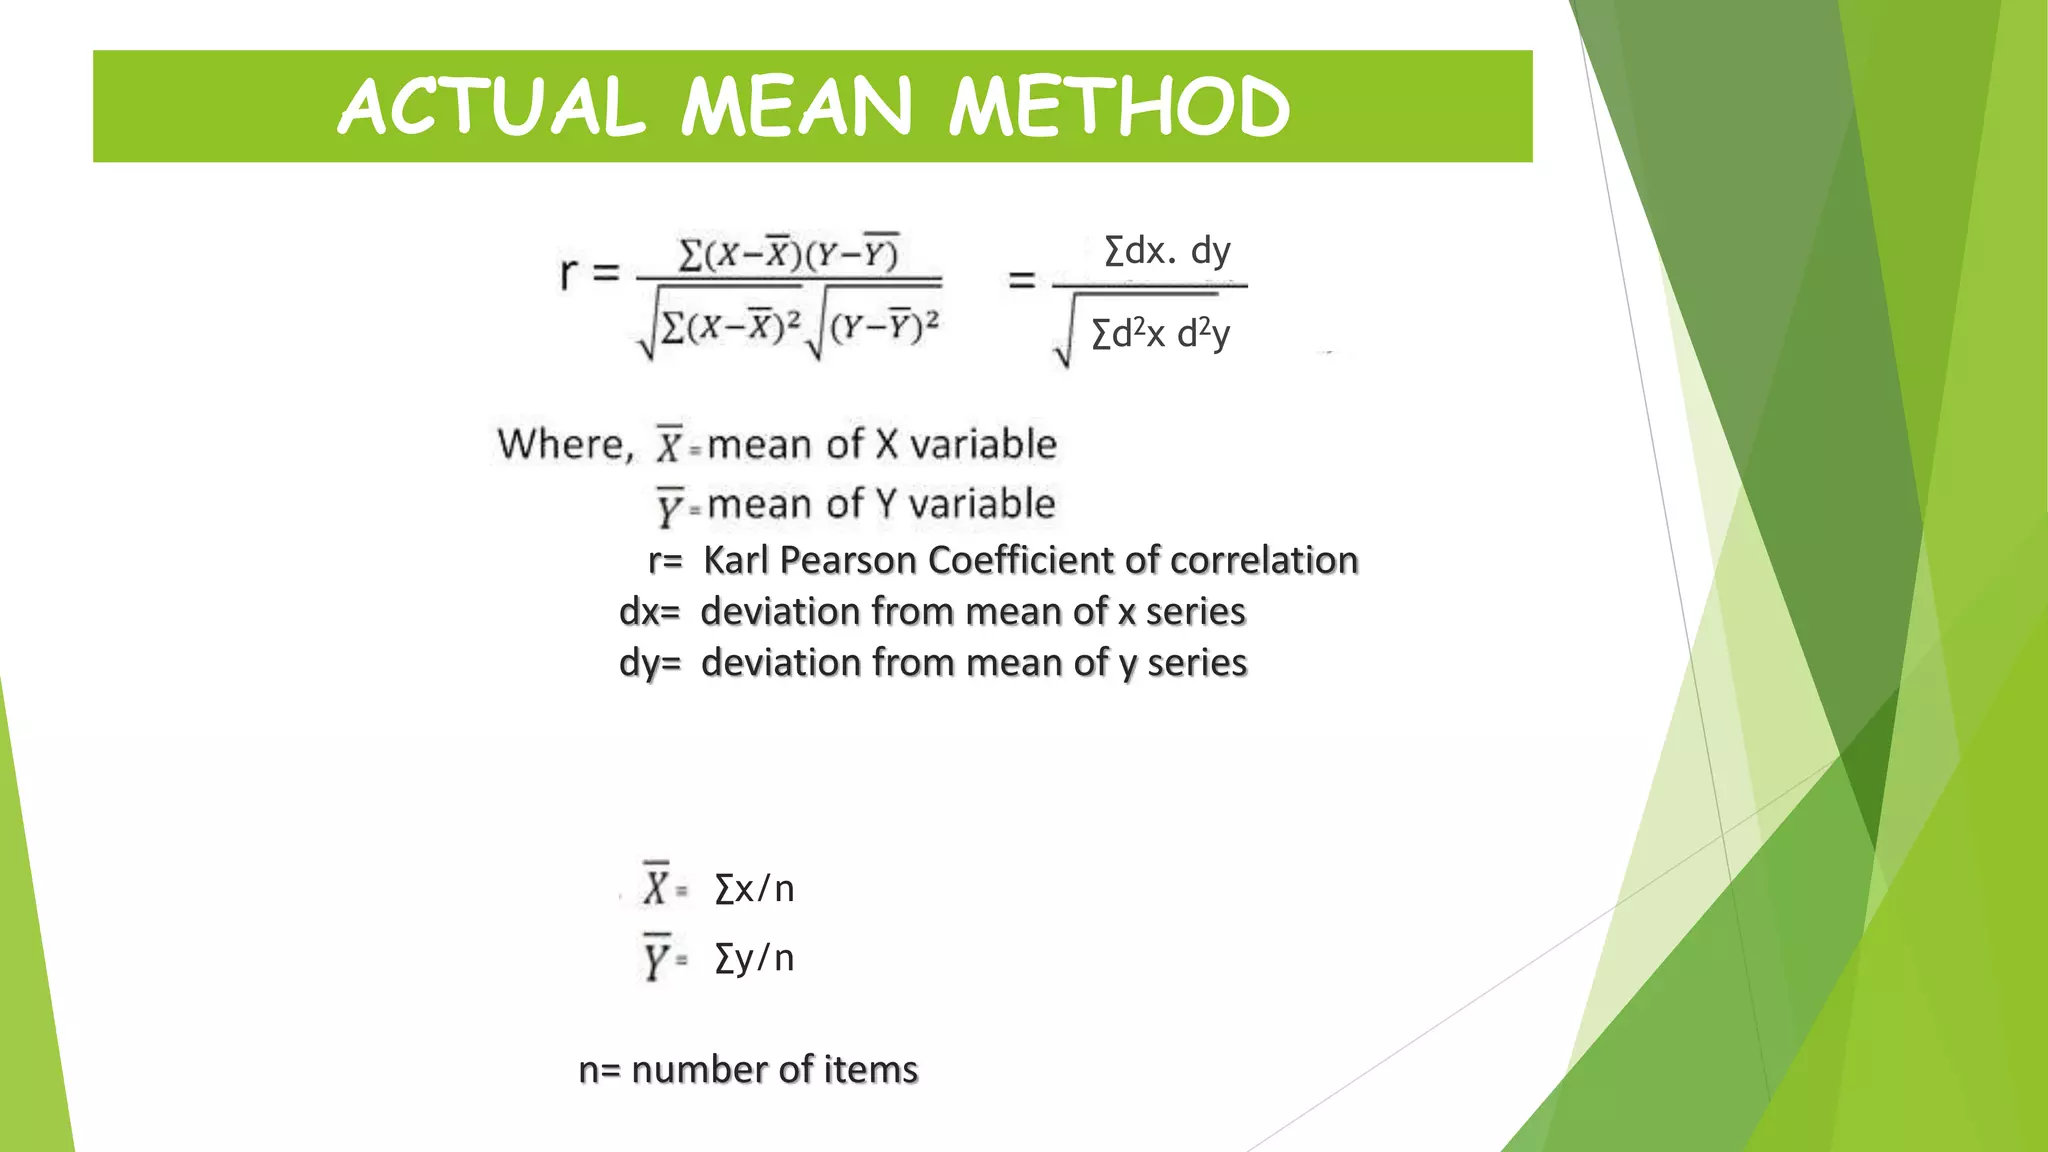
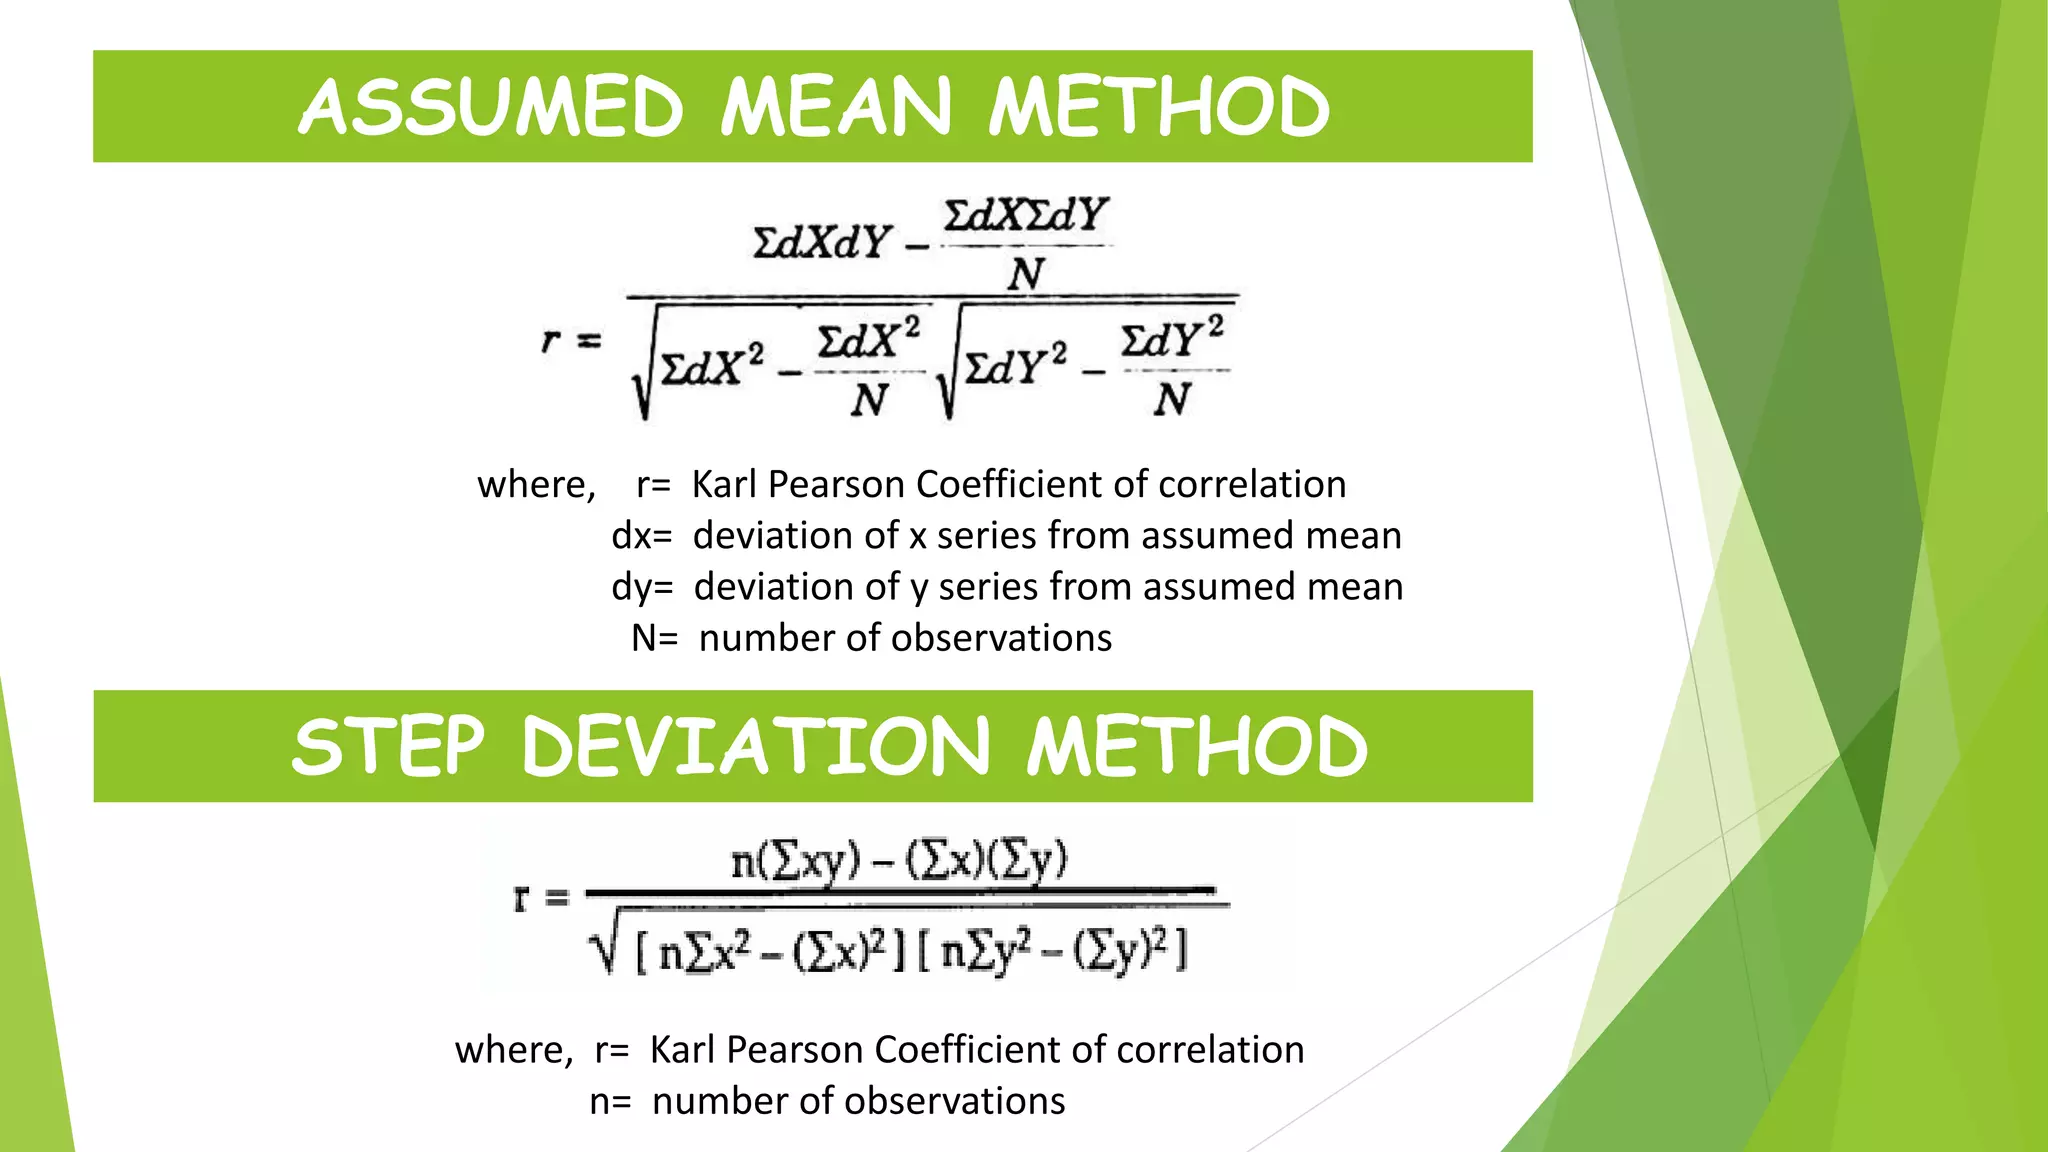
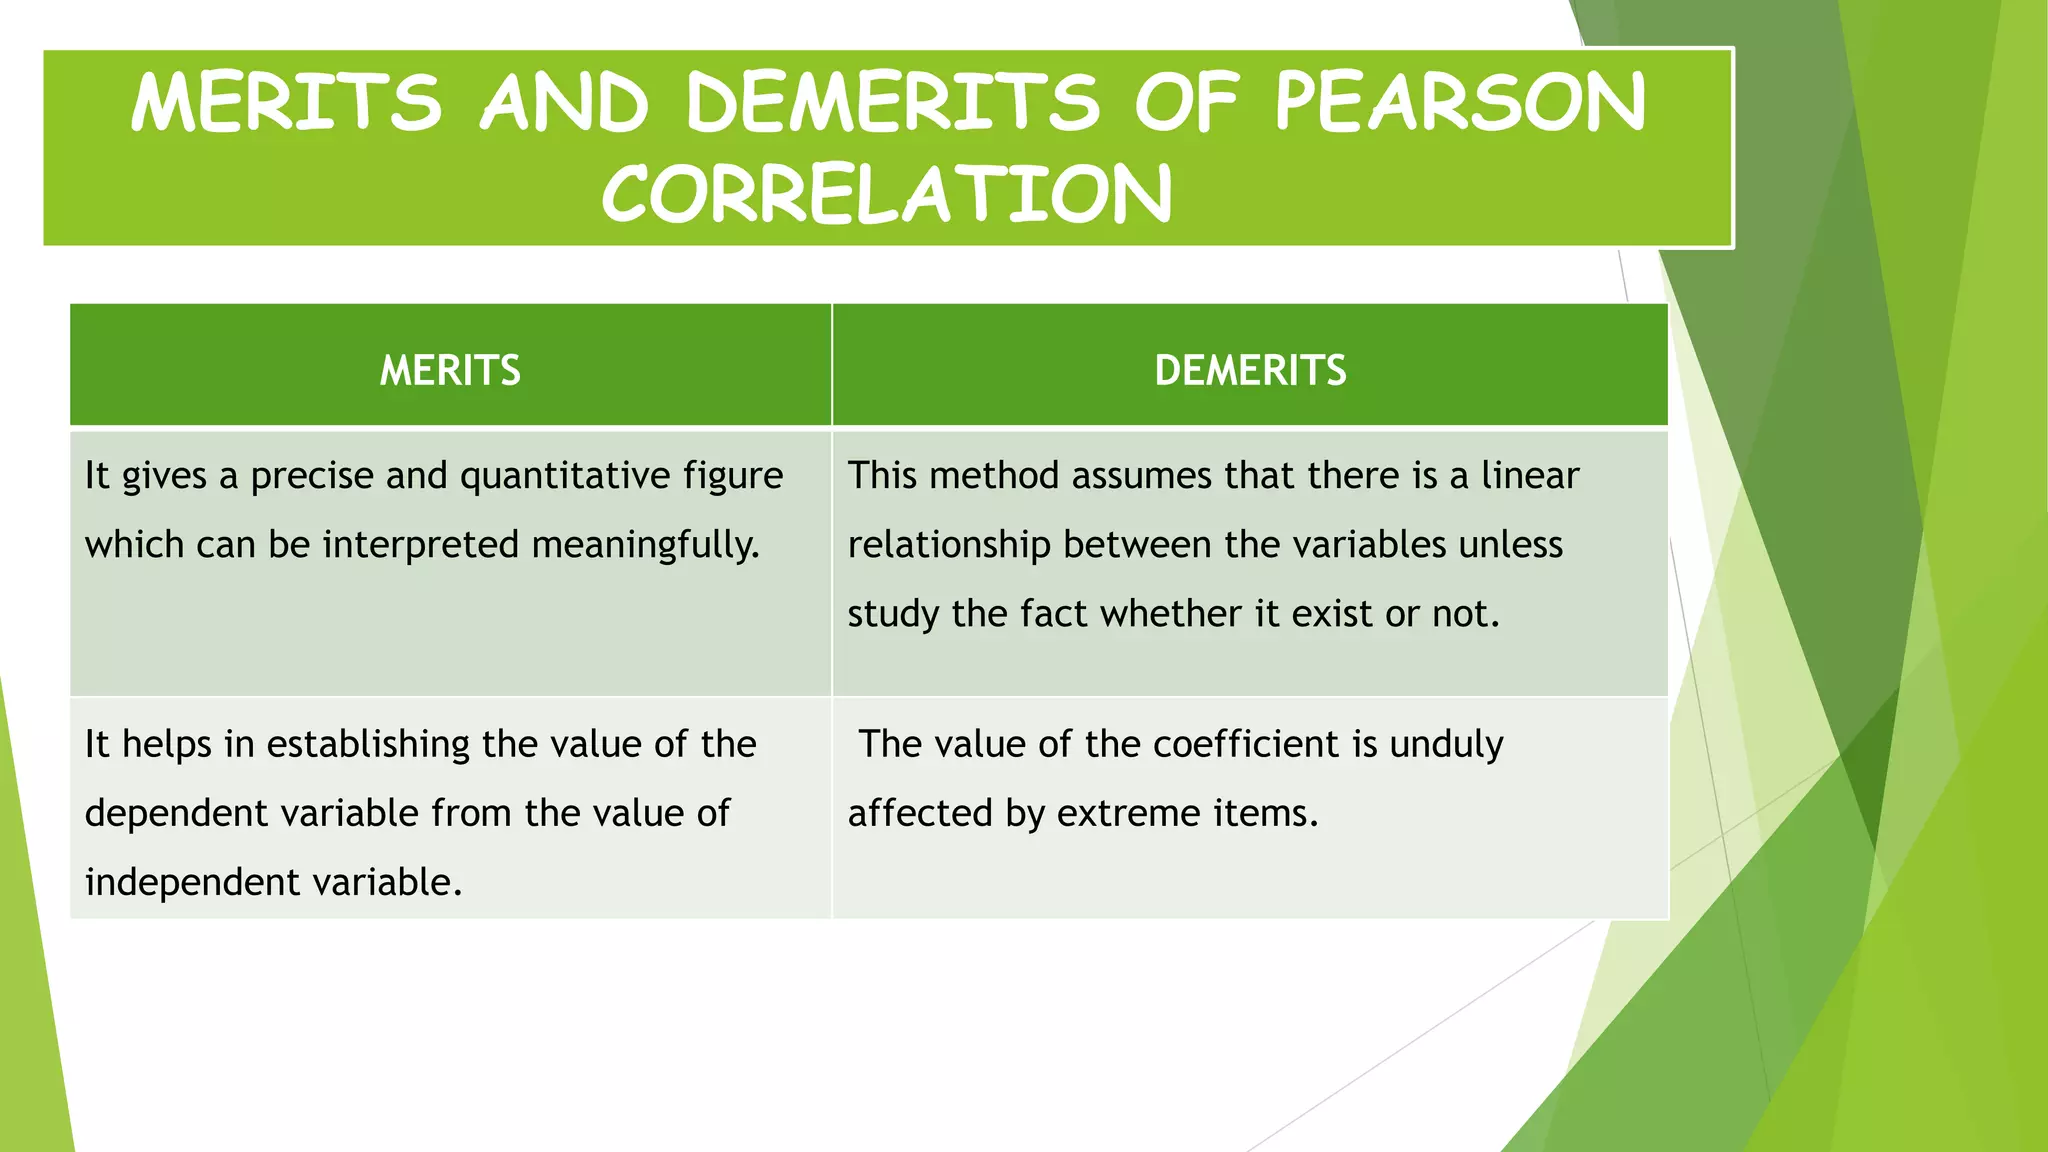
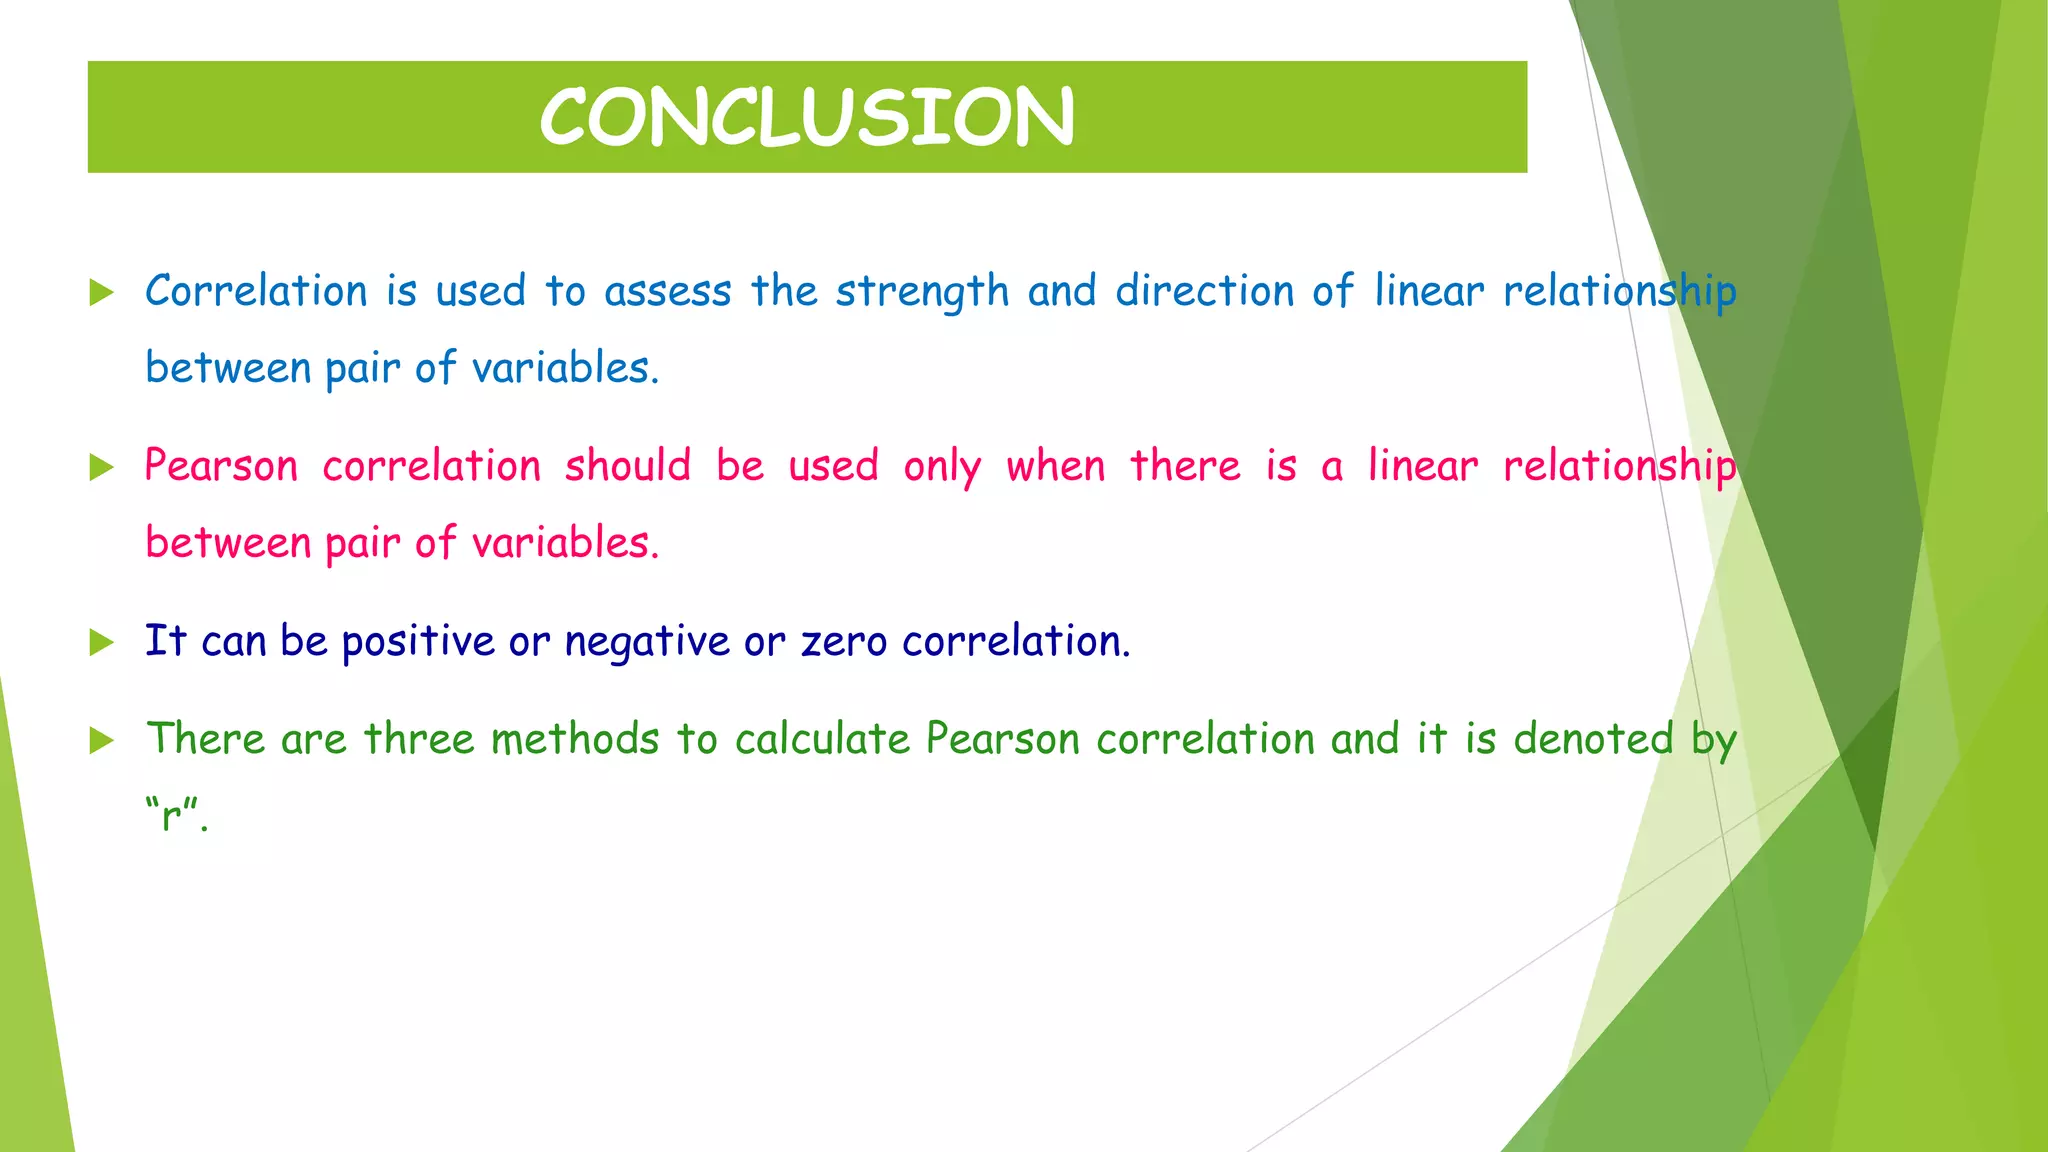
KARL PEARSON COEFFICIENT OF
CORRELATION
DEPARTMENT OF SOCIAL WORK
INSTIUTE OF SOCIAL SCIENCES
DR. BHIMRAO AMBEDKAR UNIVERSITY, AGRA
PRESENTED BY: TRIPTI DUBEY
MSW (III Sem) Roll No. 38
CONTENTS
 Coefficient of correlation
 Types of correlation
 Karl Pearson Coefficient of correlation
 Methods used to calculate Karl Pearson Coefficient of
correlation
 Actual mean method
 Assumed mean method
 Step deviation method
 Conclusion
 Correlation is generally applied in statistics and it is a statistical
tool to calculate and analyze the degree of relationship between two
variables.
 The correlation analysis deals with the association between X and Y
variables.
 It was developed by Francis Galton in 1885.
 Correlation is represented by “r”.
INTRODUCTION
TYPES OF CORRELATION
TYPES OF
CORRELATION
POSITIVE
CORRELATION
PERFECT POSITIVE
CORRELATION
LIMITED POSITIVE
CORRELATION
i) High Degree
ii) Moderate Degree
iii) Low Degree
ZERO
CORRELATION
NEGATIVE
CORRELATION
PERFECT NEGATIVE
CORRELATION
LIMITED NEGATIVE
CORRELATION
i) High Degree
ii) Moderate Degree
iii) Low Degree
If when the first variable increases or decreases the other also increases or decreases
respectively. This relationship is said to be positive correlation.
Ex- Height and weight
 Positive correlation is divided into two categories-
1. Perfect Positive correlation: It is denoted by +1.
2. Limited Positive correlation:
i) Low Degree of limited positive correlation-
ii) Moderate Degree of limited positive correlation-
iii) High Degree of limited positive correlation-
POSITIVE CORRELATION
r = +1
0 < r < 0.25
0.25 ≤ r < 0.75
0.75 ≤ r < +1
If when the first variable increases or decreases, the other respectively decreases or
increases respectively. This relationship is said to be negative correlation.
Ex- Price and Quantity demanded
 Negative correlation is divided into two categories-
1. Perfect Negative correlation: It is denoted by -1.
2. Limited Negative correlation:
i) Low Degree of limited negative correlation-
ii) Moderate Degree of limited negative correlation-
iii) High Degree of limited negative correlation-
NEGATIVE CORRELATION
r = -1
0 > r > -1
-0.25 ≥ r > -0.75
-0.75 ≥ r > -1
If there exists no relationship between two sets of measures or variables. This
relationship is said to be zero correlation.
Ex- Intelligence and Height
ZERO CORRELATION
 This was introduced by Karl Pearson (1867-1936).
 Pearson’s Correlation coefficient method is quantitative and
offer numerical value to establish the intensity of the linear
relationship between two variables.
 It is the most potent and extensively used method to measure the level
of correlation.
 This method is also known as Product Moment Correlation Coefficient.
KARL PEARSON COEFFICIENT OF
CORRELATION
Actual Mean Method
Assumed Mean Method
Step- Deviation Method
METHODS USED TO CALCULATE
PEARSON CORRELATION
METHODS USED
TO CALCULATE
PEARSON
CORRELATION
ACTUAL MEAN METHOD
∑dx. dy
∑d2x d2y
r= Karl Pearson Coefficient of correlation
dx= deviation from mean of x series
dy= deviation from mean of y series
∑x/n
∑y/n
n= number of items
ASSUMED MEAN METHOD
where, r= Karl Pearson Coefficient of correlation
dx= deviation of x series from assumed mean
dy= deviation of y series from assumed mean
N= number of observations
STEP DEVIATION METHOD
where, r= Karl Pearson Coefficient of correlation
n= number of observations
MERITS AND DEMERITS OF PEARSON
CORRELATION
MERITS DEMERITS
It gives a precise and quantitative figure
which can be interpreted meaningfully.
This method assumes that there is a linear
relationship between the variables unless
study the fact whether it exist or not.
It helps in establishing the value of the
dependent variable from the value of
independent variable.
The value of the coefficient is unduly
affected by extreme items.
 Correlation is used to assess the strength and direction of linear relationship
between pair of variables.
 Pearson correlation should be used only when there is a linear relationship
between pair of variables.
 It can be positive or negative or zero correlation.
 There are three methods to calculate Pearson correlation and it is denoted by
“r”.
CONCLUSION
Pearson's  correlation

Pearson's correlation

  • 1.
    KARL PEARSON COEFFICIENTOF CORRELATION DEPARTMENT OF SOCIAL WORK INSTIUTE OF SOCIAL SCIENCES DR. BHIMRAO AMBEDKAR UNIVERSITY, AGRA PRESENTED BY: TRIPTI DUBEY MSW (III Sem) Roll No. 38
  • 2.
    CONTENTS  Coefficient ofcorrelation  Types of correlation  Karl Pearson Coefficient of correlation  Methods used to calculate Karl Pearson Coefficient of correlation  Actual mean method  Assumed mean method  Step deviation method  Conclusion
  • 3.
     Correlation isgenerally applied in statistics and it is a statistical tool to calculate and analyze the degree of relationship between two variables.  The correlation analysis deals with the association between X and Y variables.  It was developed by Francis Galton in 1885.  Correlation is represented by “r”. INTRODUCTION
  • 4.
    TYPES OF CORRELATION TYPESOF CORRELATION POSITIVE CORRELATION PERFECT POSITIVE CORRELATION LIMITED POSITIVE CORRELATION i) High Degree ii) Moderate Degree iii) Low Degree ZERO CORRELATION NEGATIVE CORRELATION PERFECT NEGATIVE CORRELATION LIMITED NEGATIVE CORRELATION i) High Degree ii) Moderate Degree iii) Low Degree
  • 5.
    If when thefirst variable increases or decreases the other also increases or decreases respectively. This relationship is said to be positive correlation. Ex- Height and weight  Positive correlation is divided into two categories- 1. Perfect Positive correlation: It is denoted by +1. 2. Limited Positive correlation: i) Low Degree of limited positive correlation- ii) Moderate Degree of limited positive correlation- iii) High Degree of limited positive correlation- POSITIVE CORRELATION r = +1 0 < r < 0.25 0.25 ≤ r < 0.75 0.75 ≤ r < +1
  • 6.
    If when thefirst variable increases or decreases, the other respectively decreases or increases respectively. This relationship is said to be negative correlation. Ex- Price and Quantity demanded  Negative correlation is divided into two categories- 1. Perfect Negative correlation: It is denoted by -1. 2. Limited Negative correlation: i) Low Degree of limited negative correlation- ii) Moderate Degree of limited negative correlation- iii) High Degree of limited negative correlation- NEGATIVE CORRELATION r = -1 0 > r > -1 -0.25 ≥ r > -0.75 -0.75 ≥ r > -1
  • 7.
    If there existsno relationship between two sets of measures or variables. This relationship is said to be zero correlation. Ex- Intelligence and Height ZERO CORRELATION
  • 8.
     This wasintroduced by Karl Pearson (1867-1936).  Pearson’s Correlation coefficient method is quantitative and offer numerical value to establish the intensity of the linear relationship between two variables.  It is the most potent and extensively used method to measure the level of correlation.  This method is also known as Product Moment Correlation Coefficient. KARL PEARSON COEFFICIENT OF CORRELATION
  • 9.
    Actual Mean Method AssumedMean Method Step- Deviation Method METHODS USED TO CALCULATE PEARSON CORRELATION METHODS USED TO CALCULATE PEARSON CORRELATION
  • 10.
    ACTUAL MEAN METHOD ∑dx.dy ∑d2x d2y r= Karl Pearson Coefficient of correlation dx= deviation from mean of x series dy= deviation from mean of y series ∑x/n ∑y/n n= number of items
  • 11.
    ASSUMED MEAN METHOD where,r= Karl Pearson Coefficient of correlation dx= deviation of x series from assumed mean dy= deviation of y series from assumed mean N= number of observations STEP DEVIATION METHOD where, r= Karl Pearson Coefficient of correlation n= number of observations
  • 12.
    MERITS AND DEMERITSOF PEARSON CORRELATION MERITS DEMERITS It gives a precise and quantitative figure which can be interpreted meaningfully. This method assumes that there is a linear relationship between the variables unless study the fact whether it exist or not. It helps in establishing the value of the dependent variable from the value of independent variable. The value of the coefficient is unduly affected by extreme items.
  • 13.
     Correlation isused to assess the strength and direction of linear relationship between pair of variables.  Pearson correlation should be used only when there is a linear relationship between pair of variables.  It can be positive or negative or zero correlation.  There are three methods to calculate Pearson correlation and it is denoted by “r”. CONCLUSION