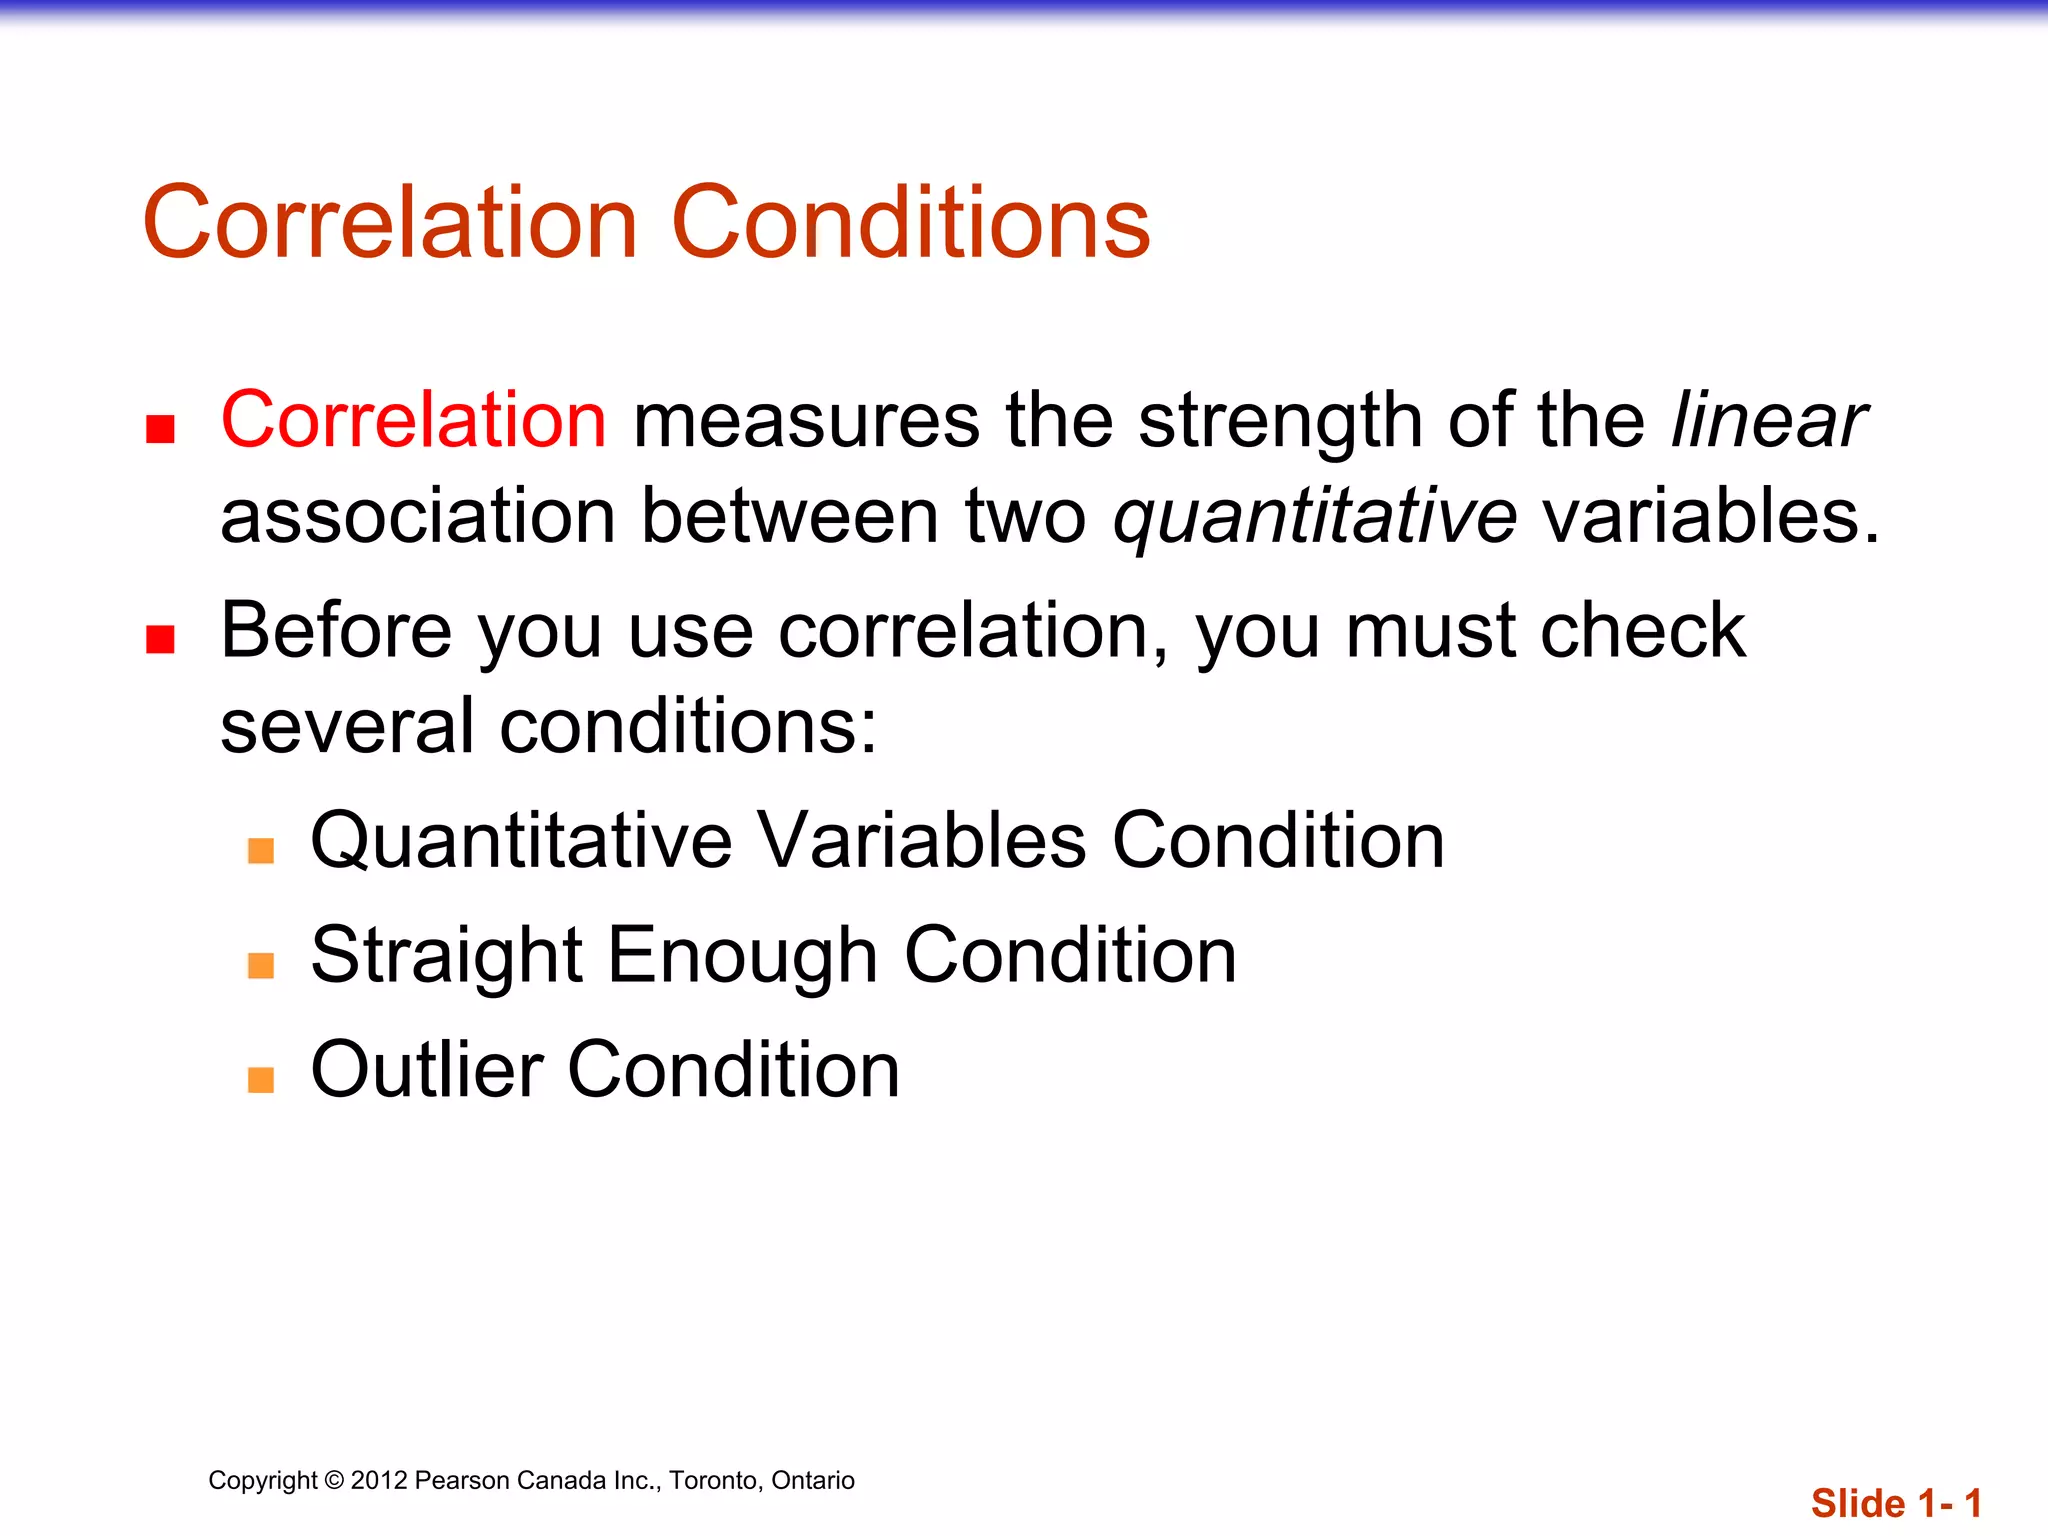
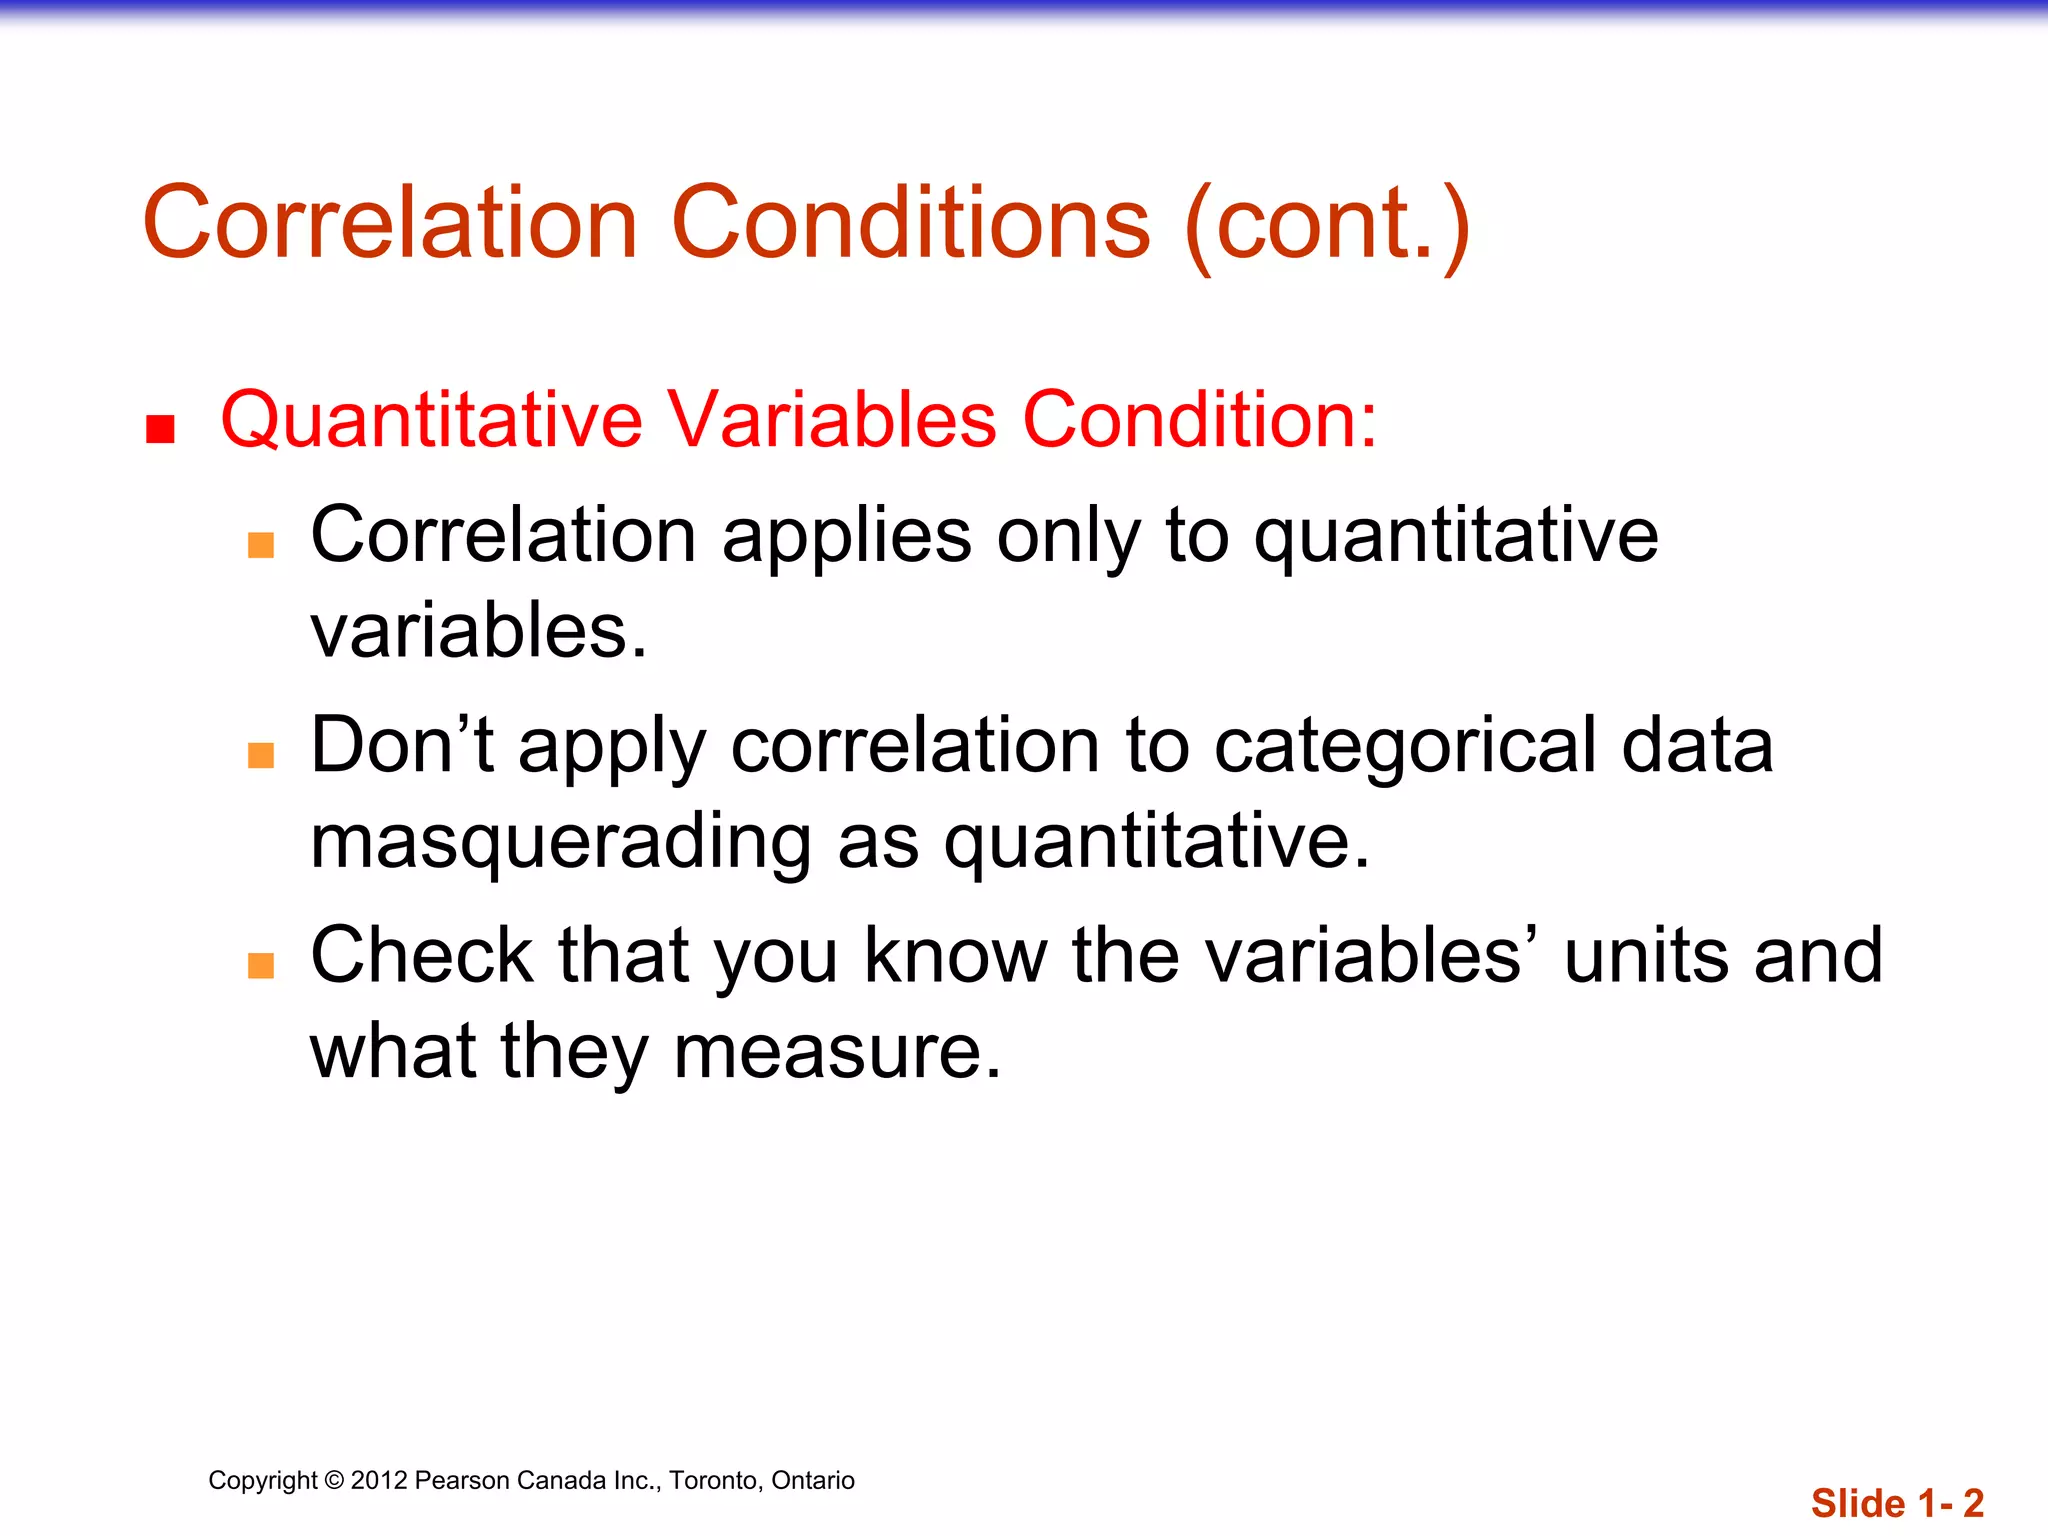
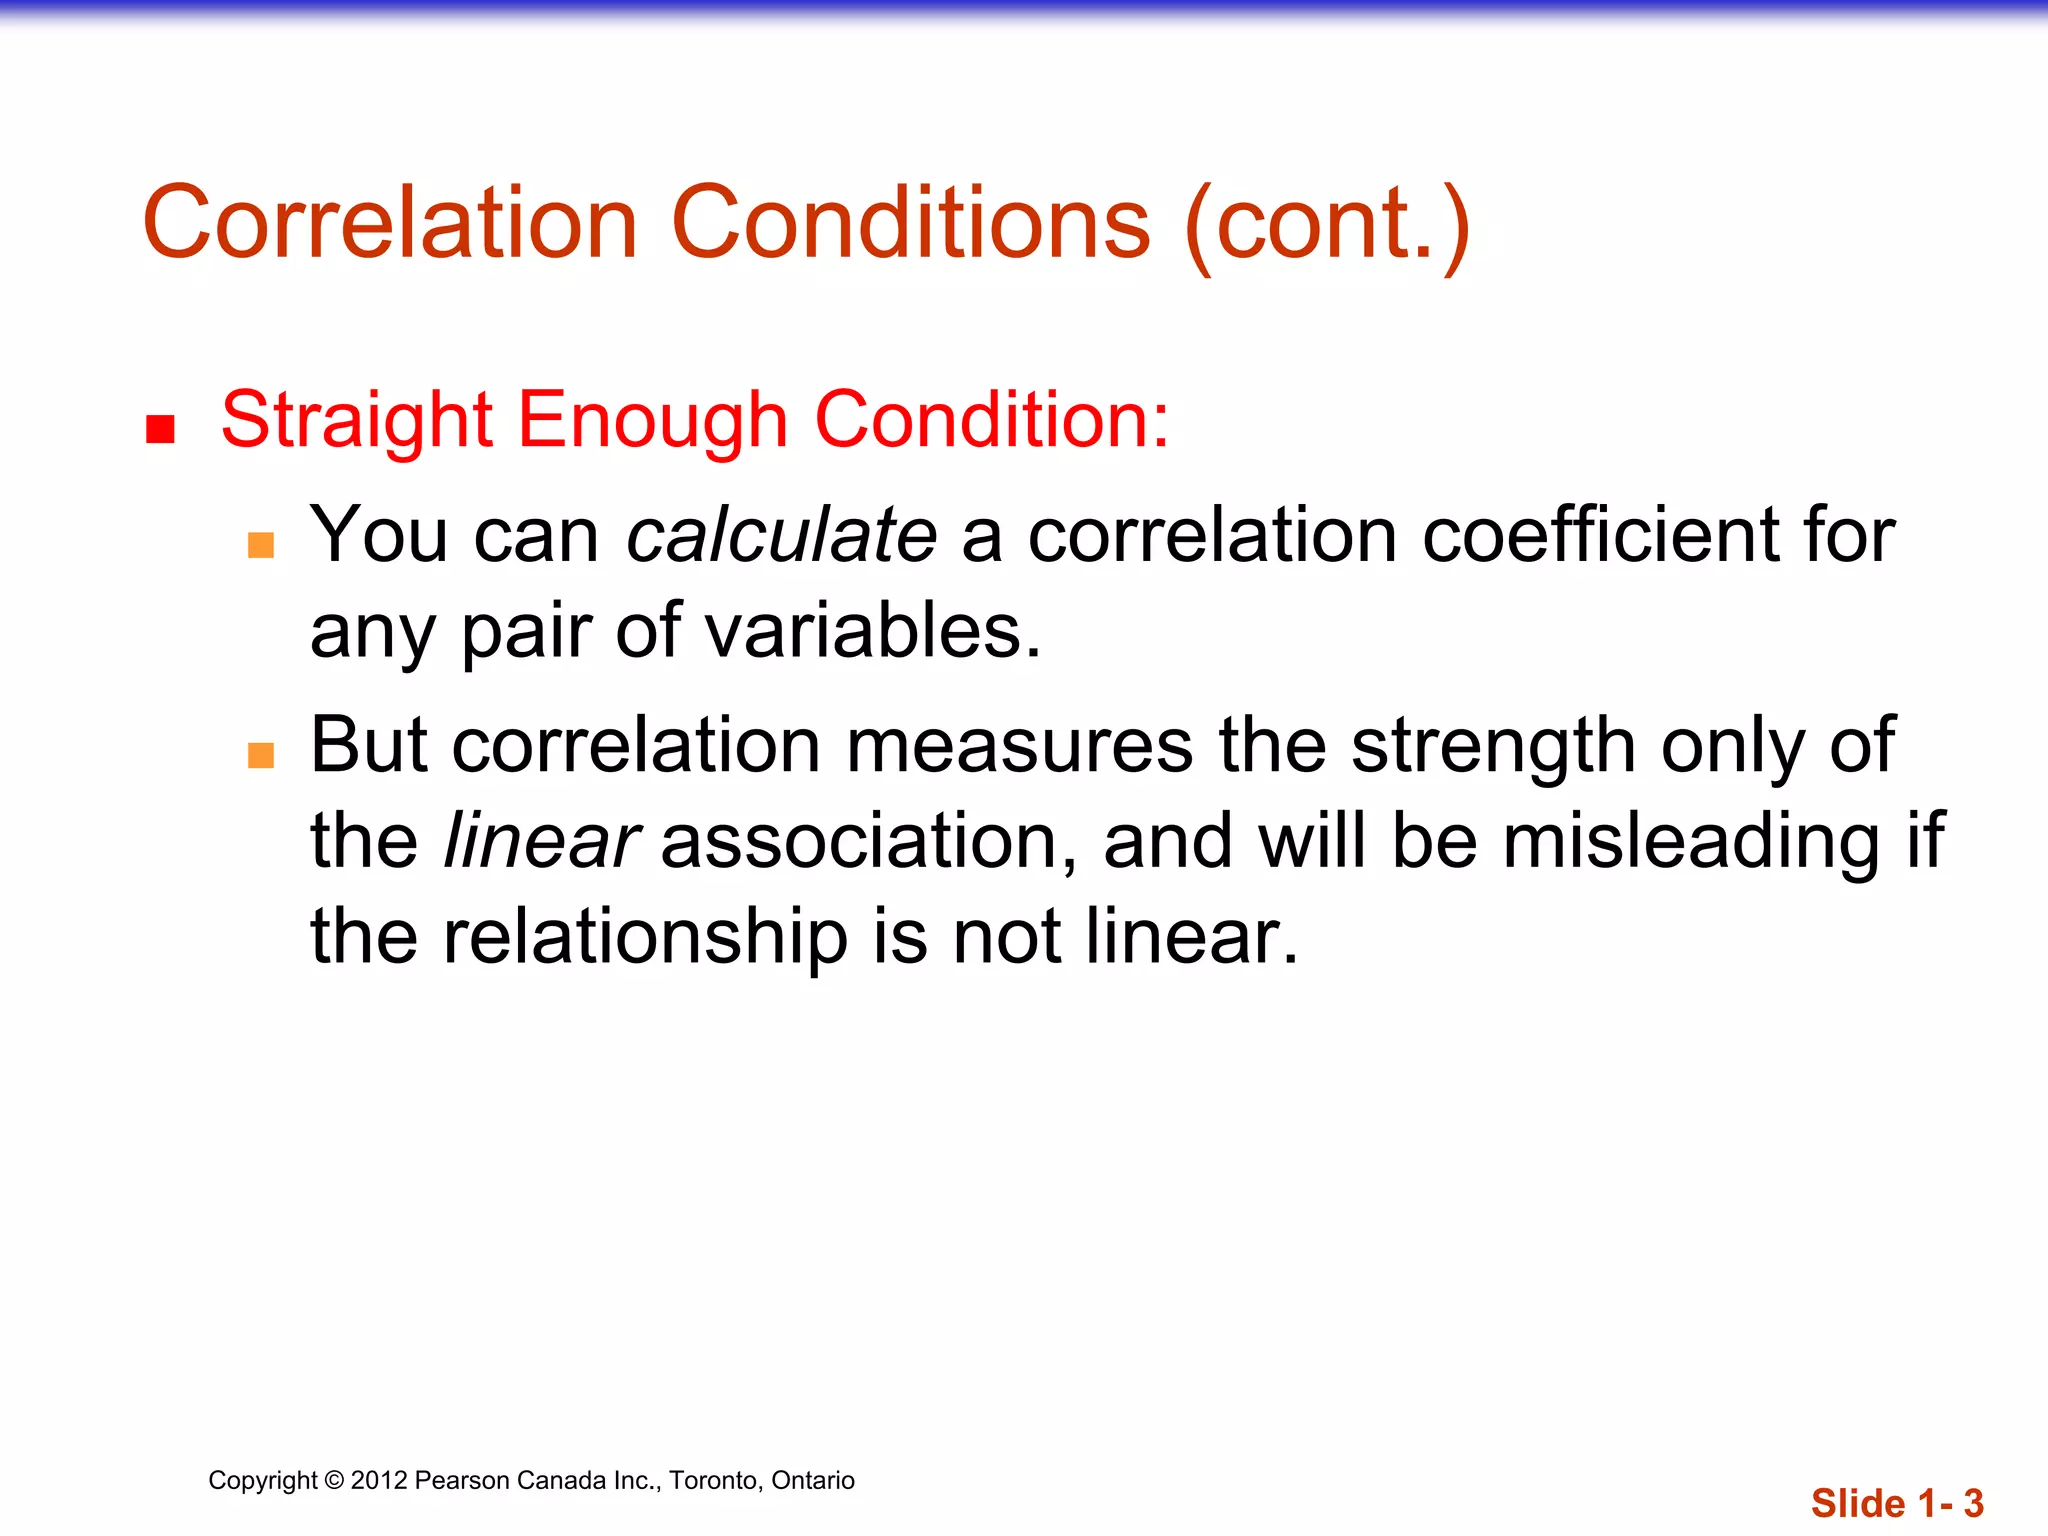
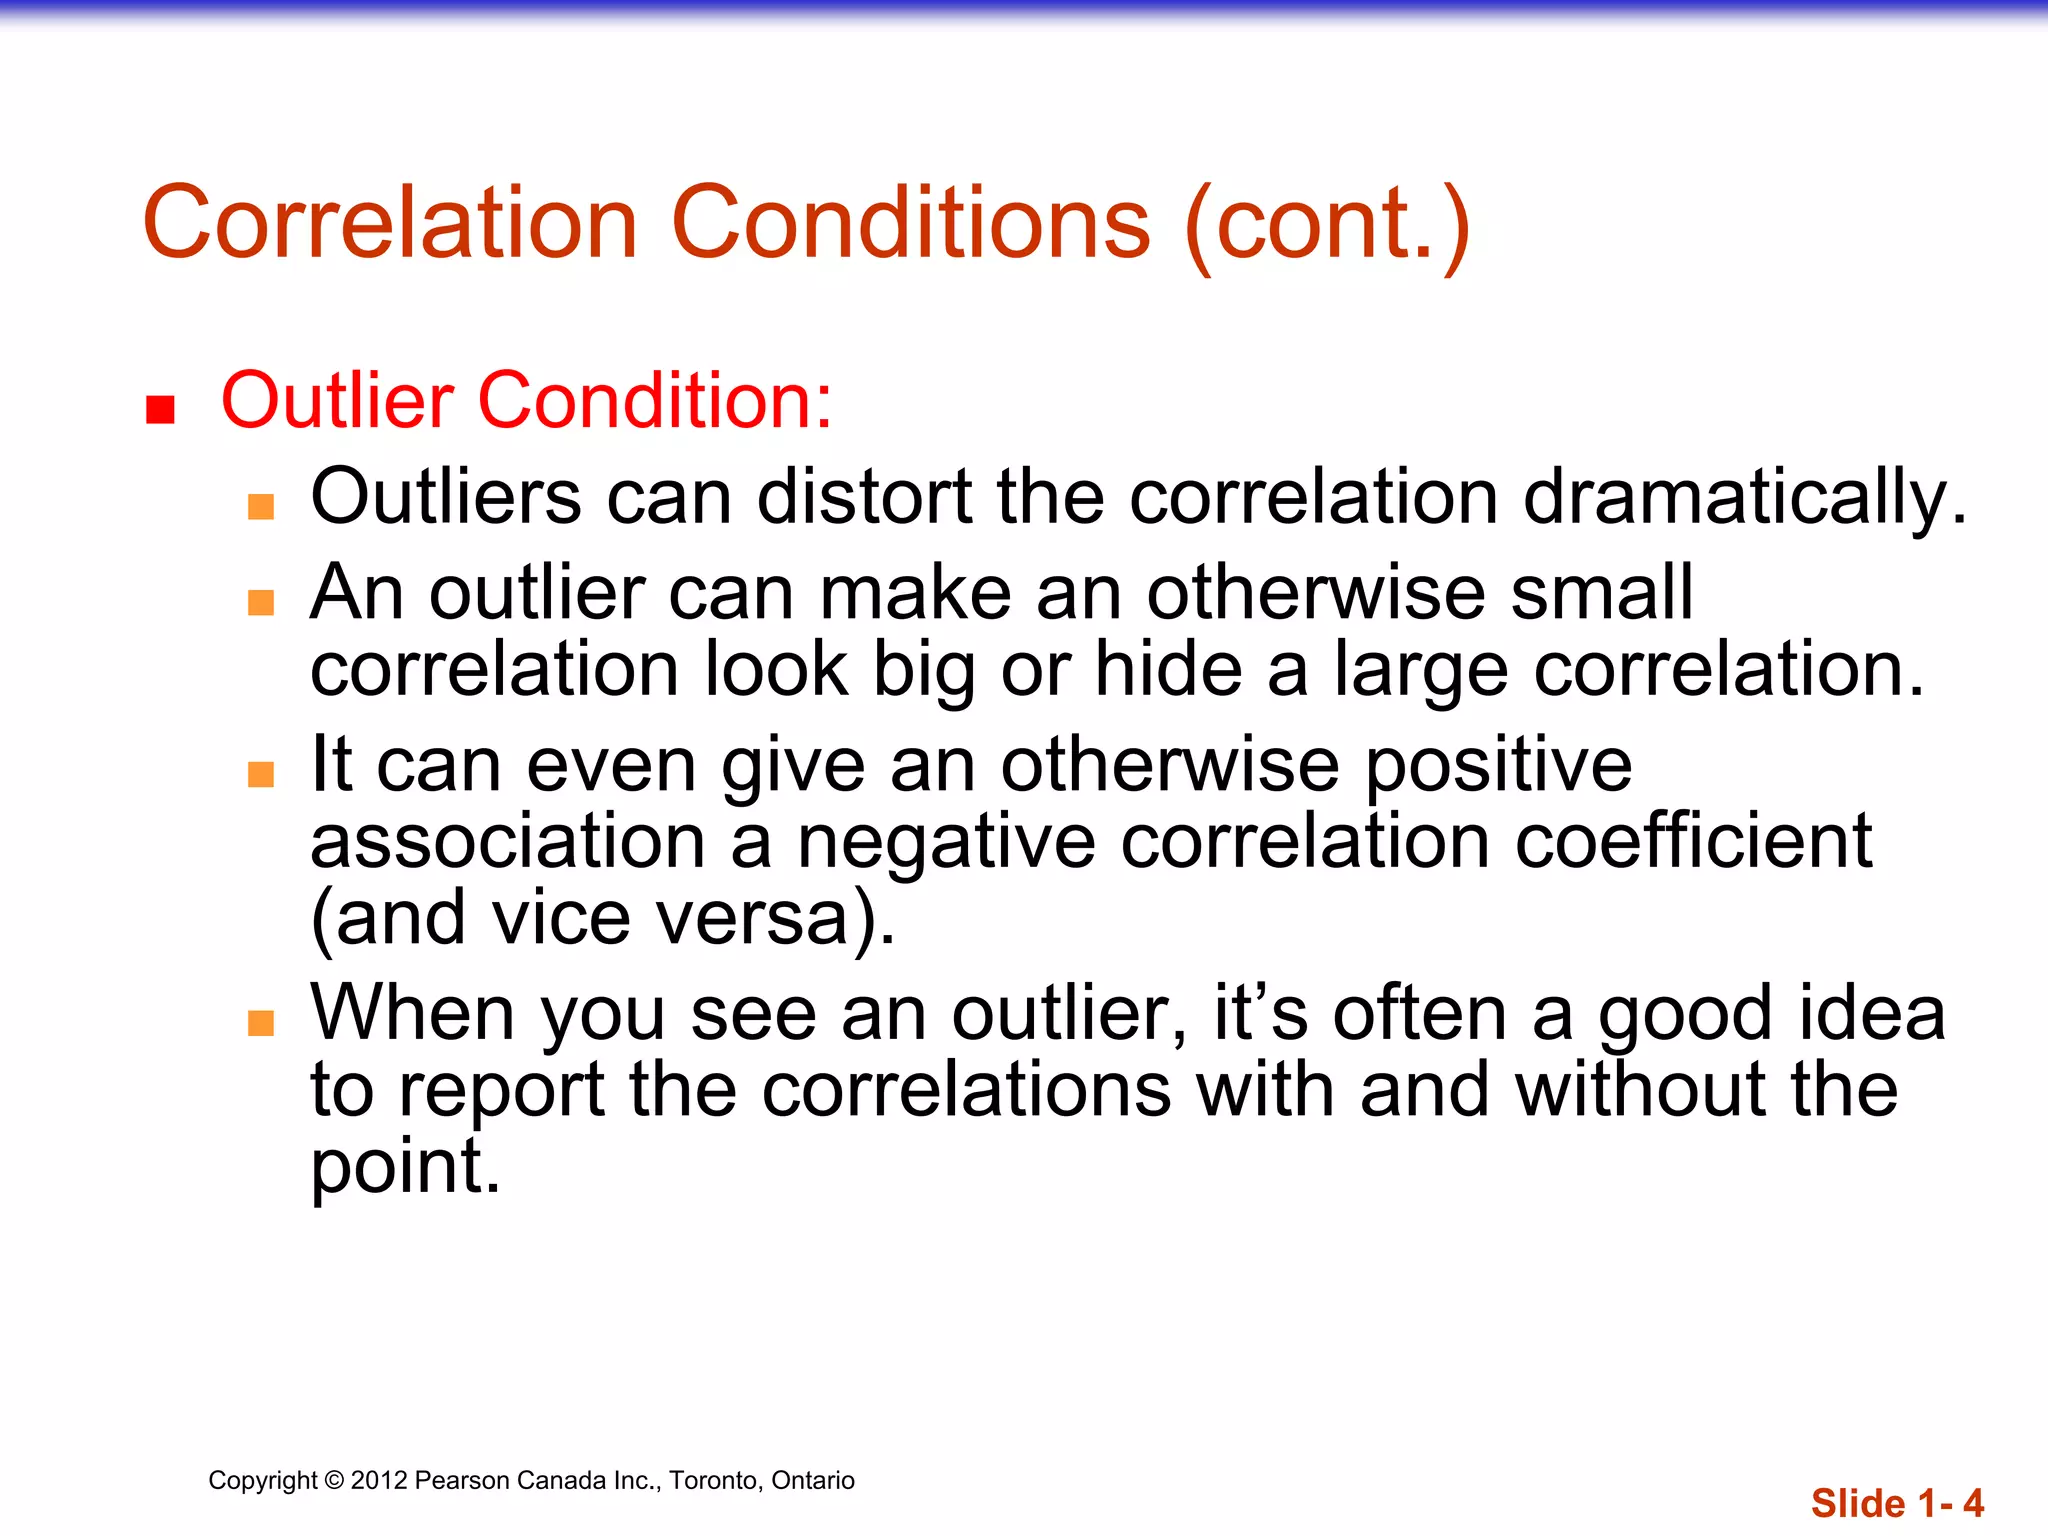
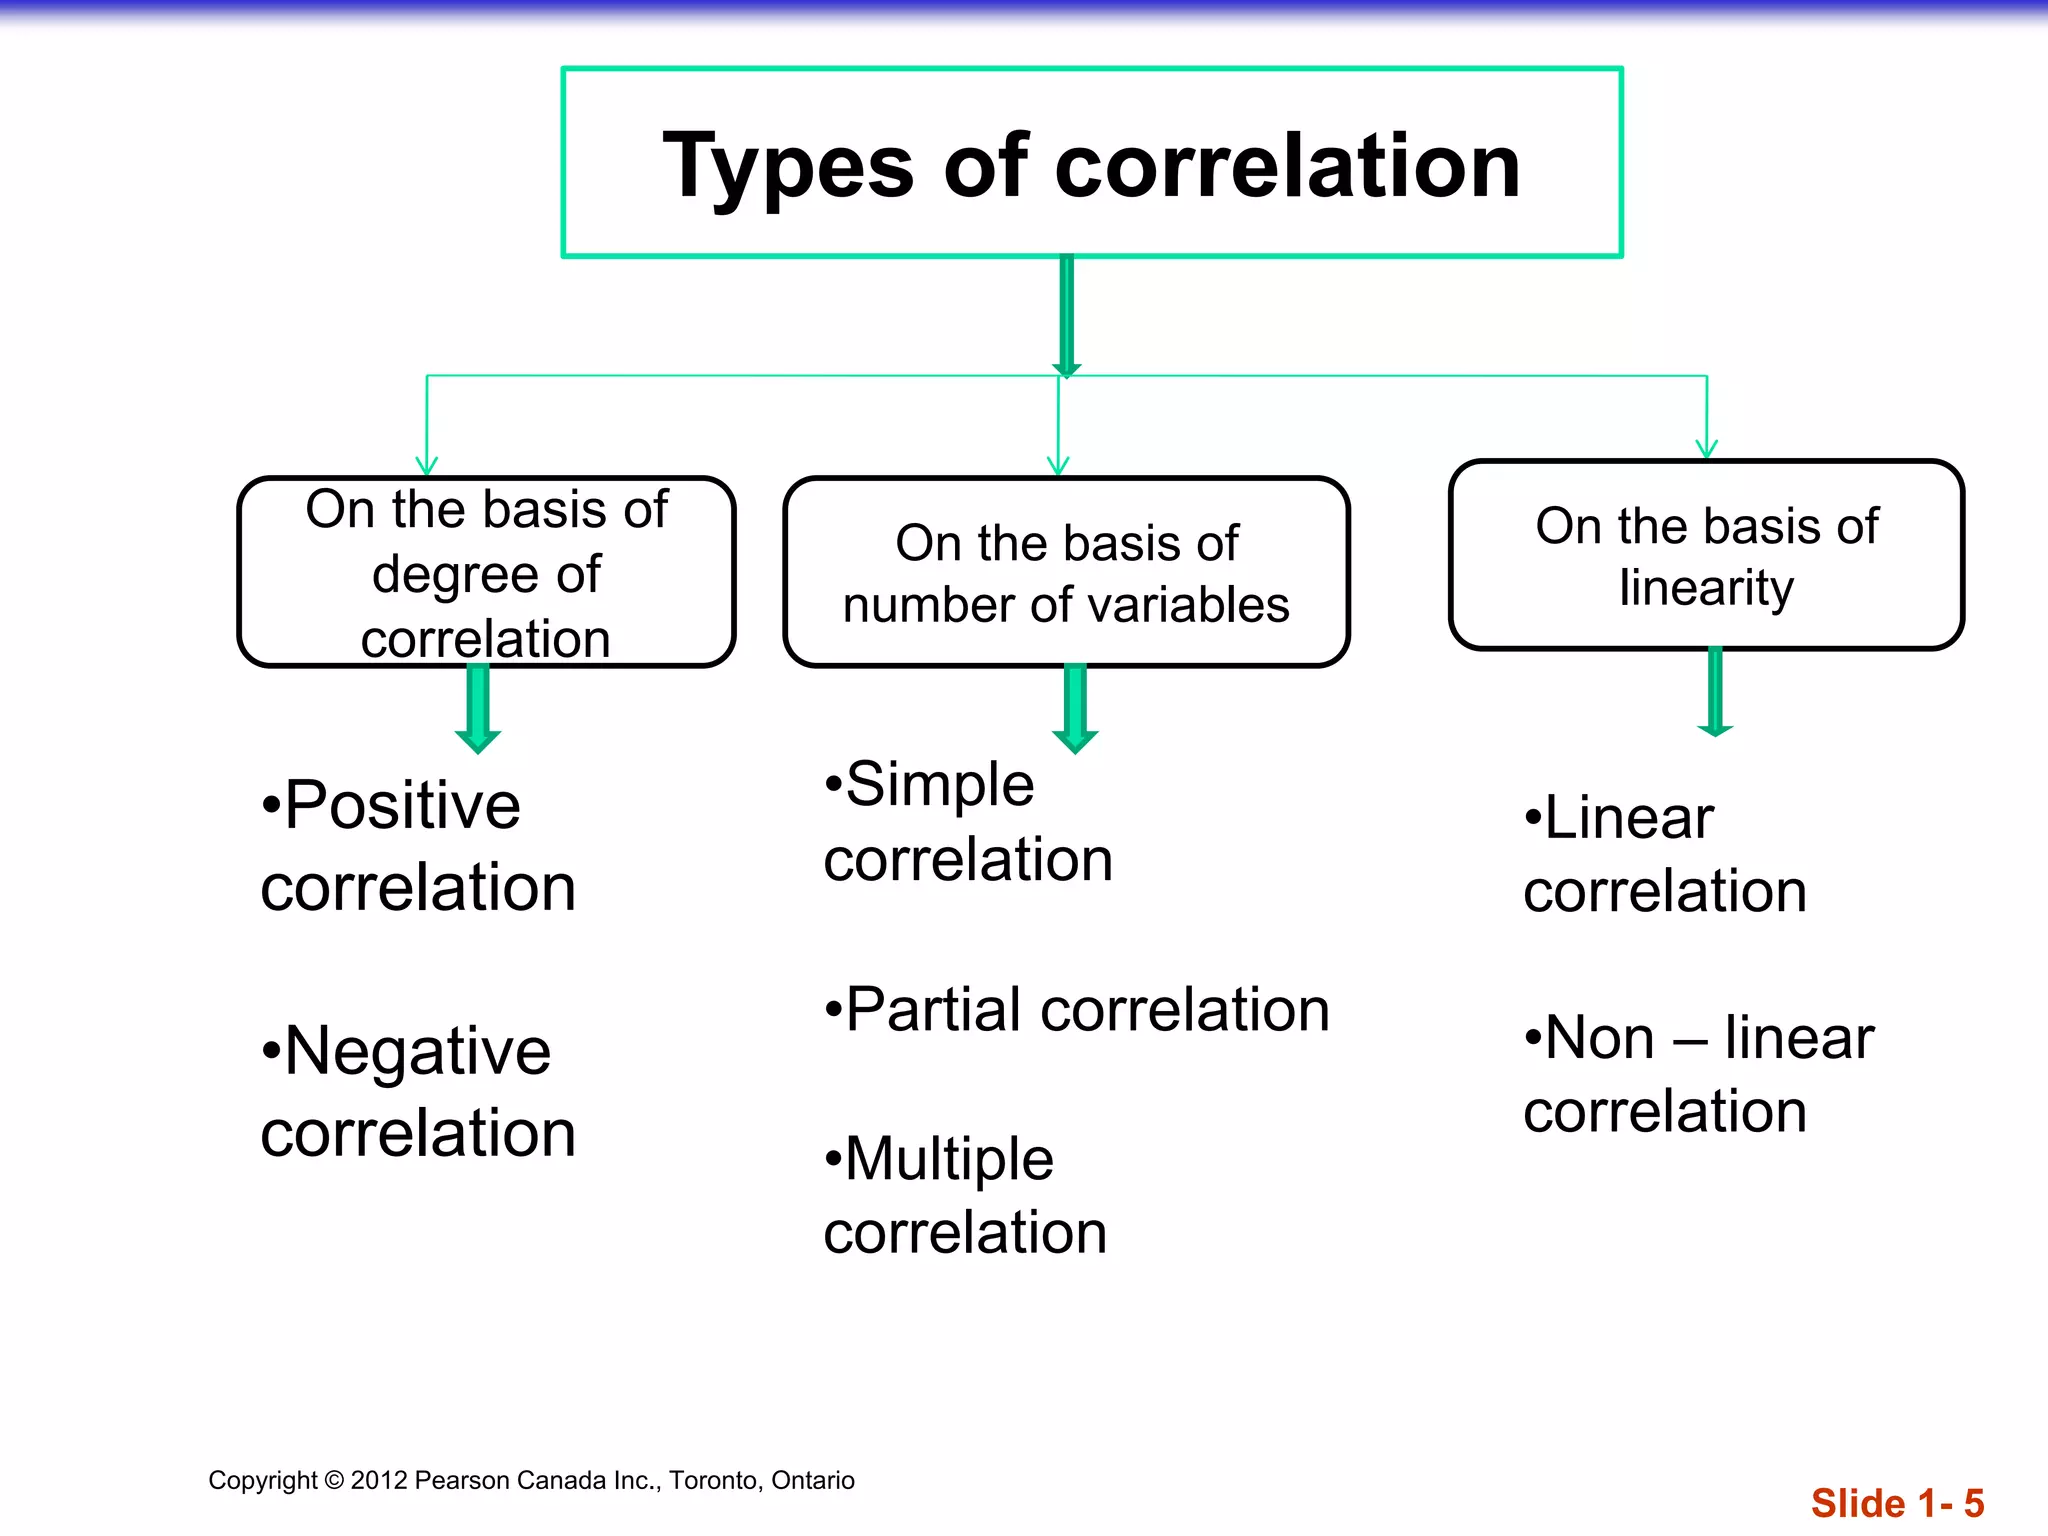
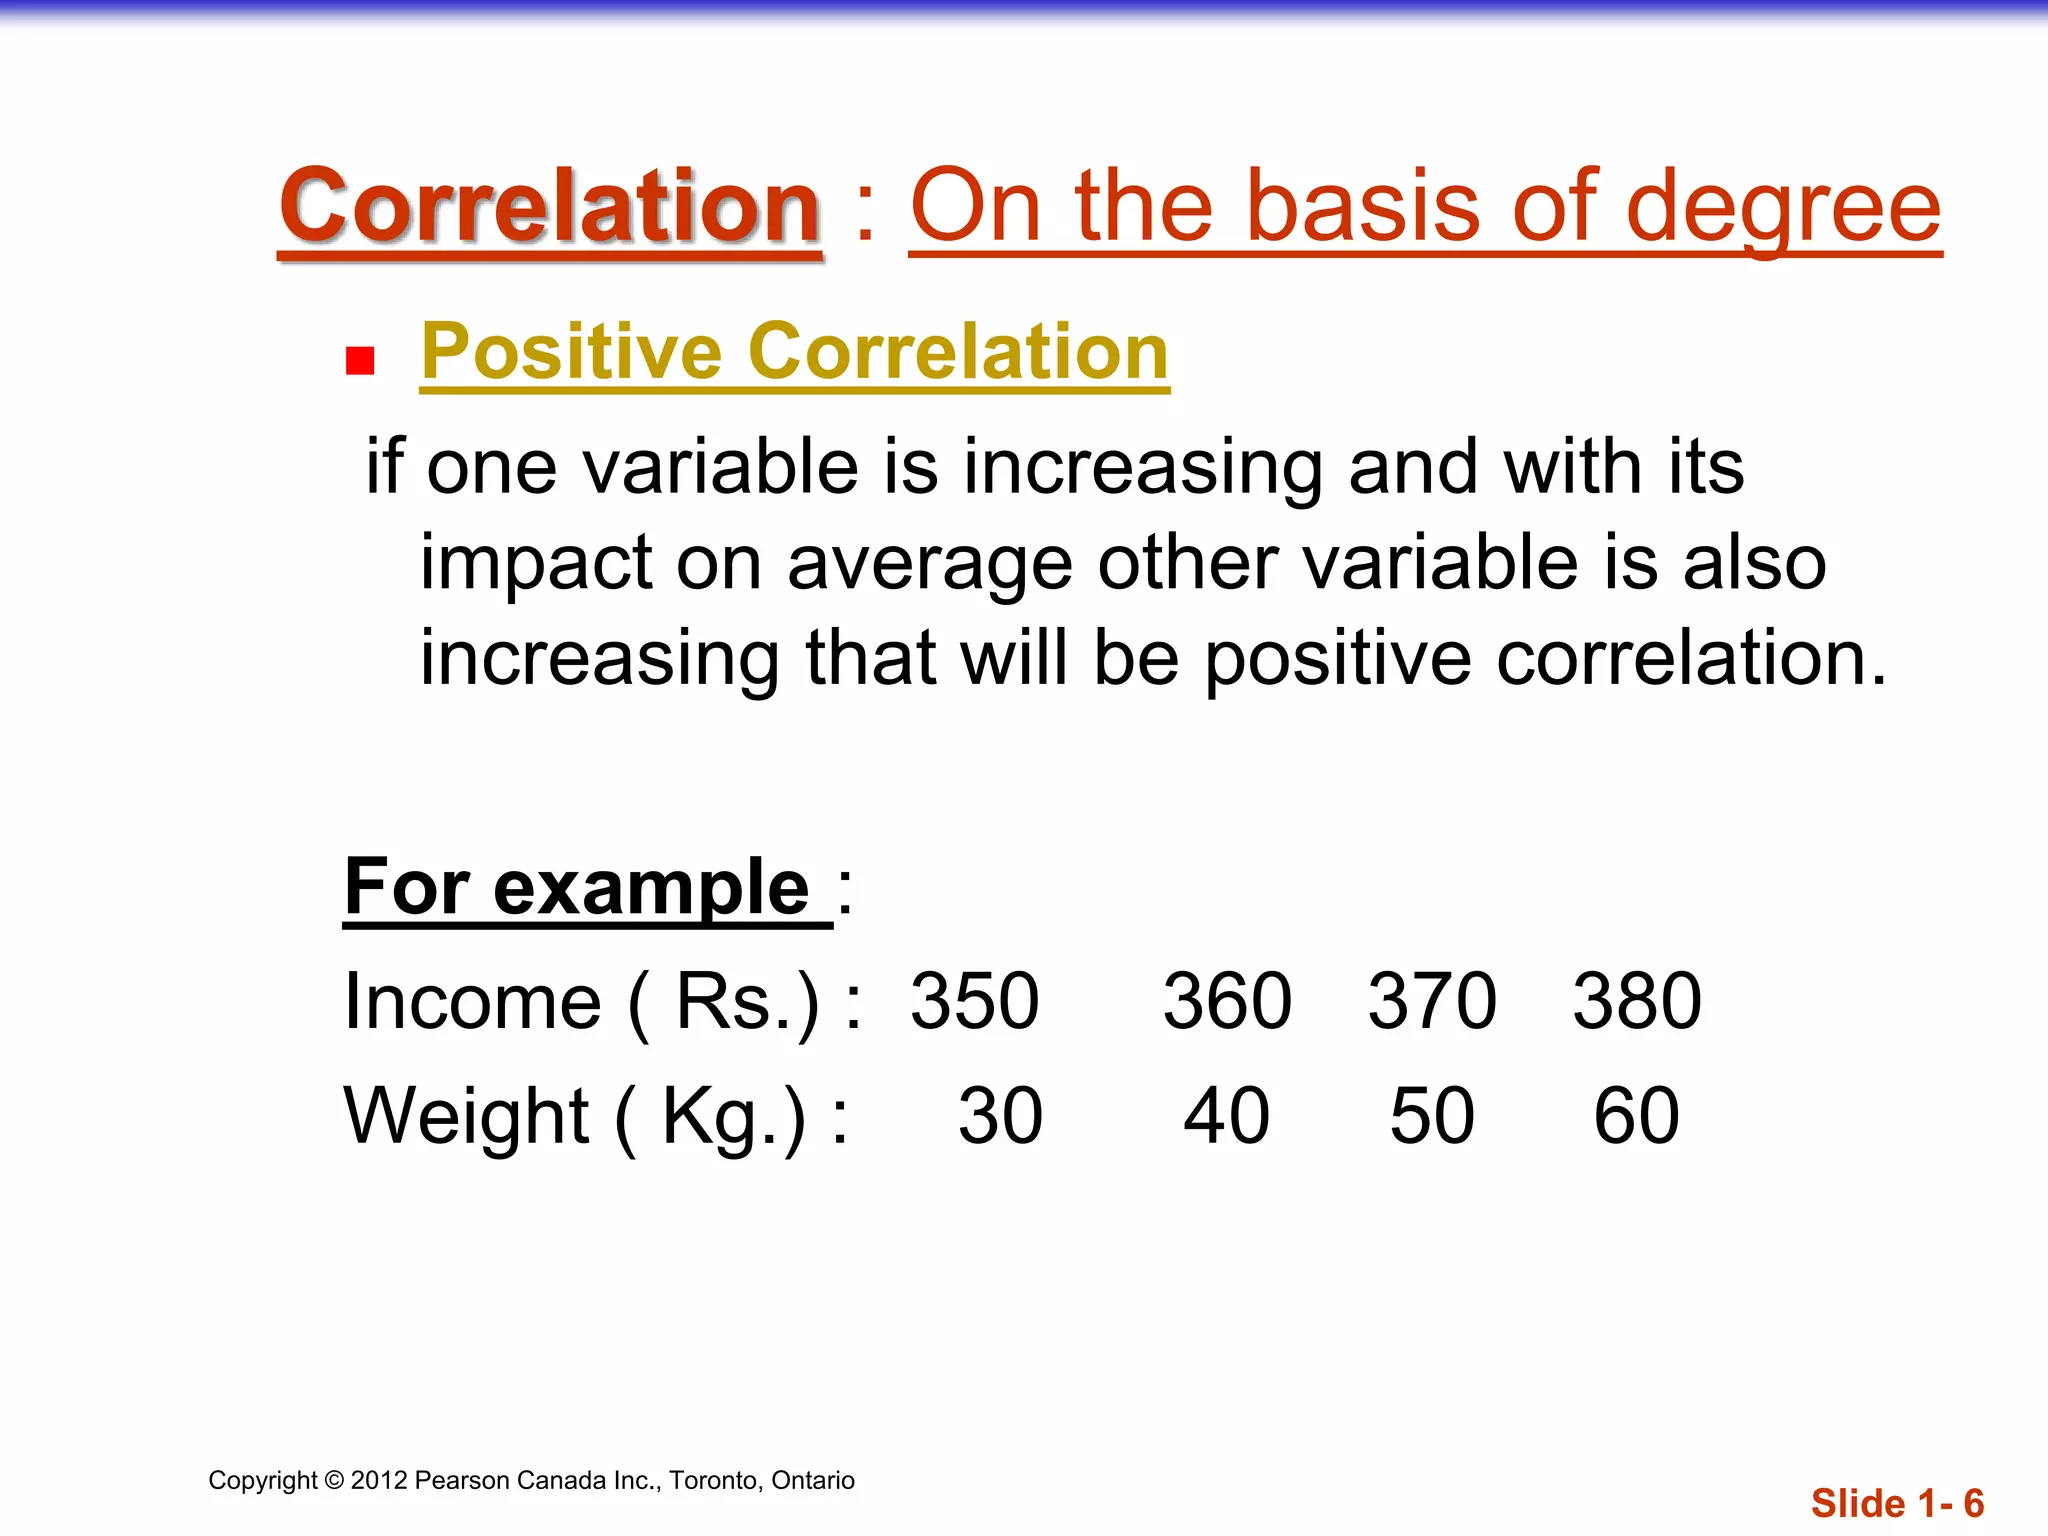
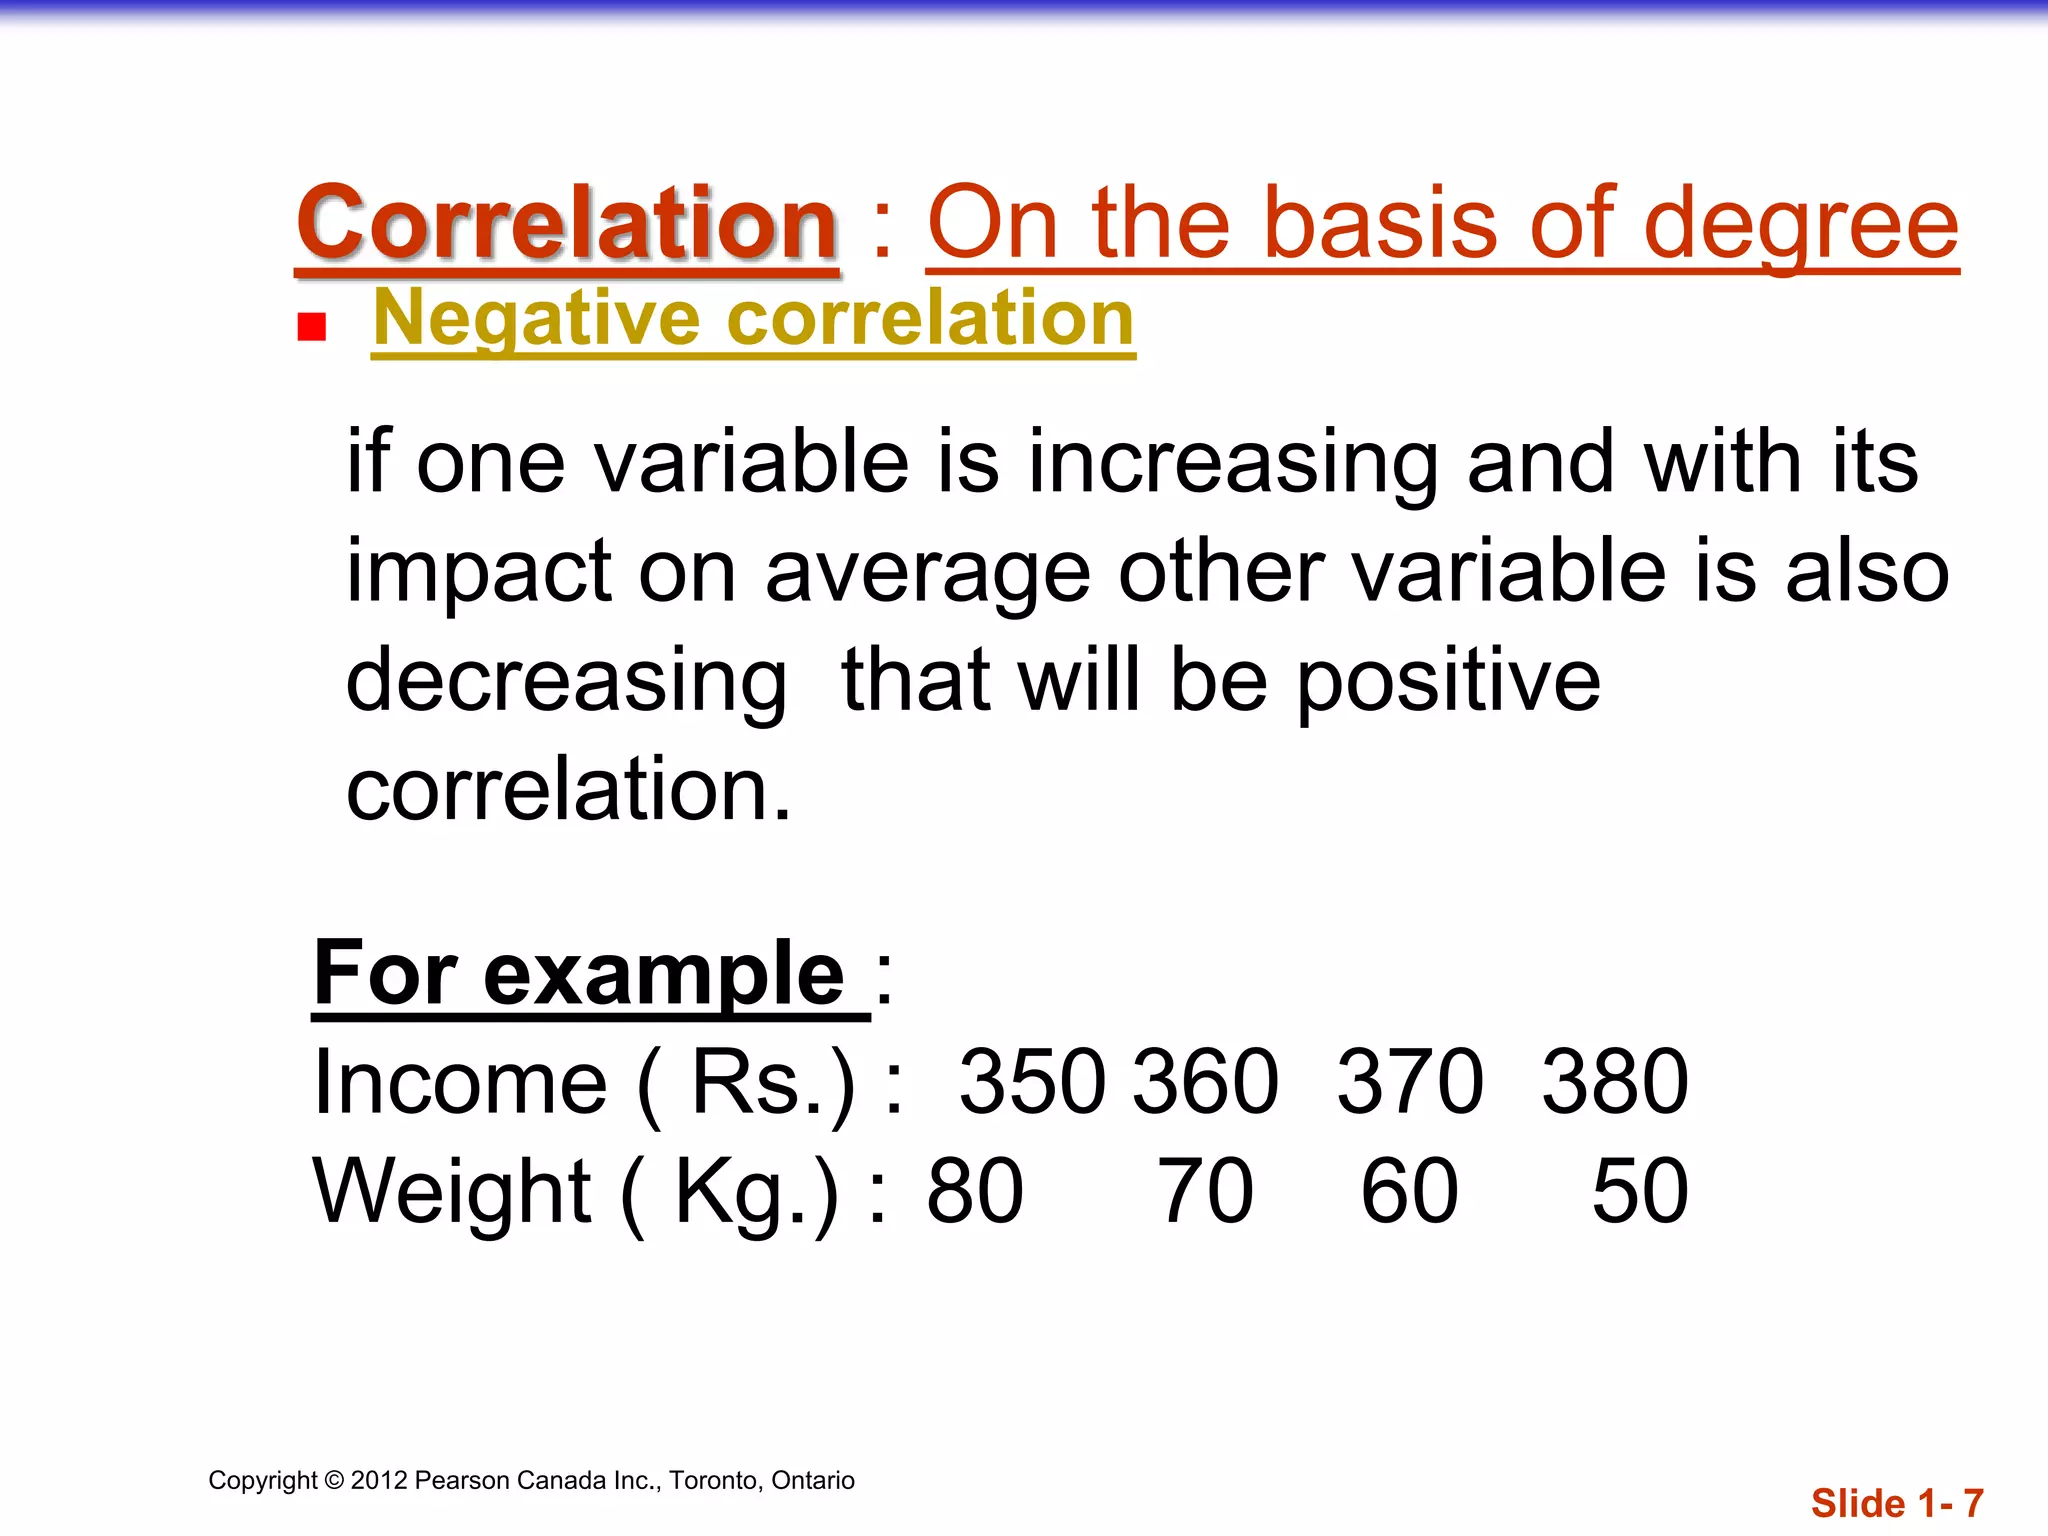
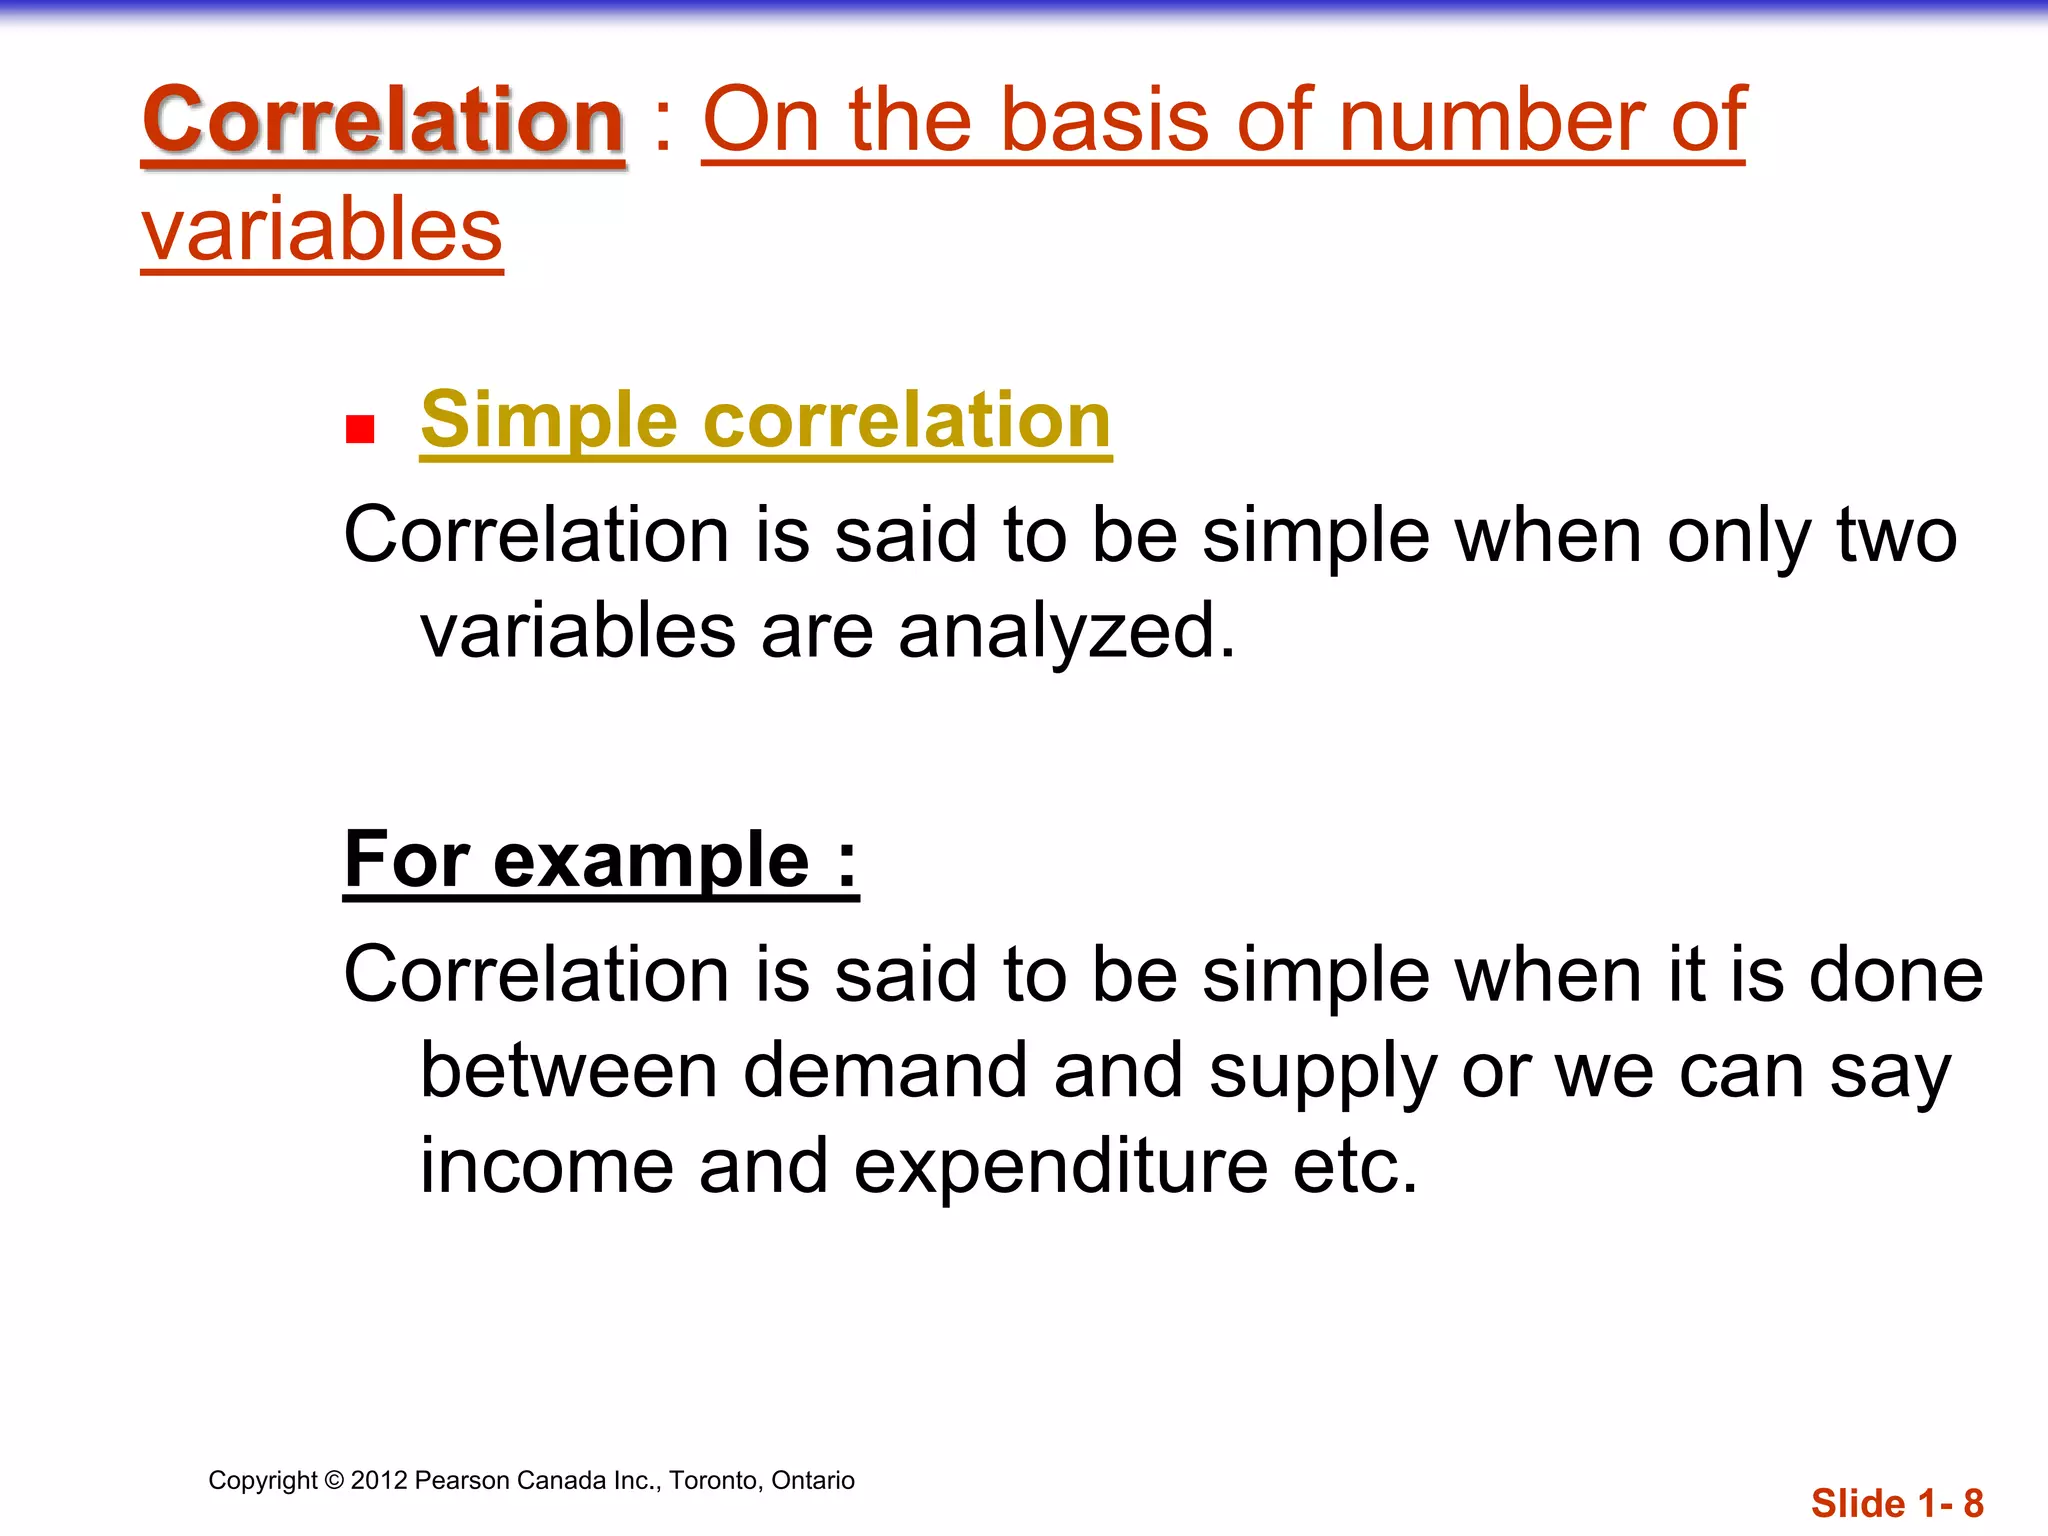
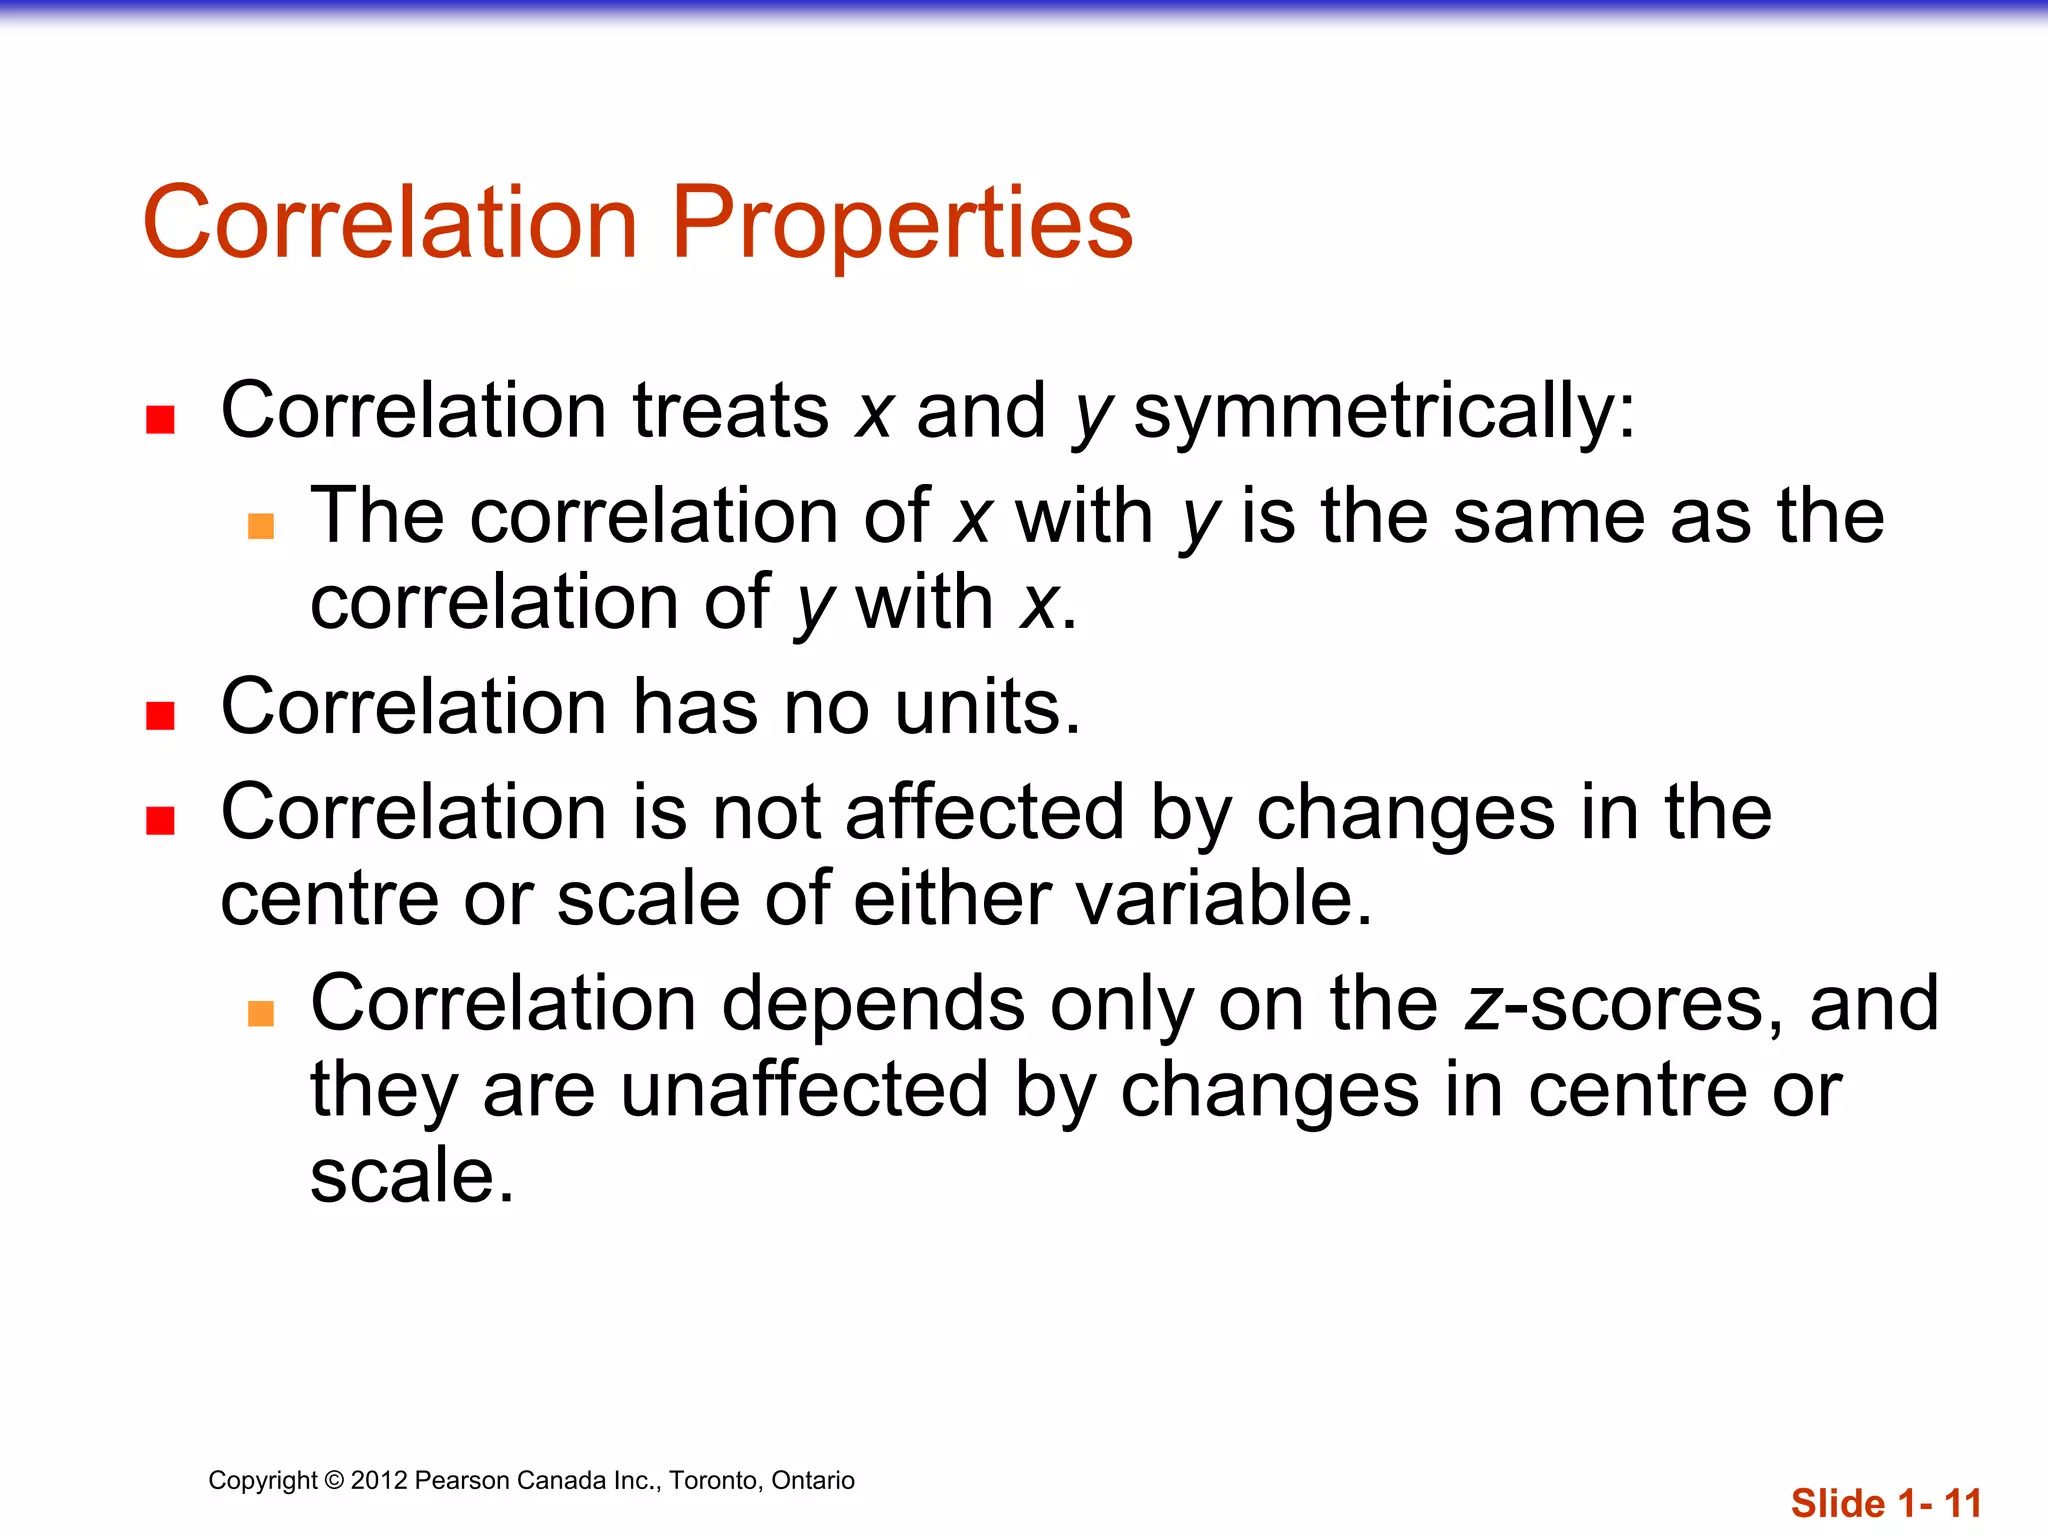
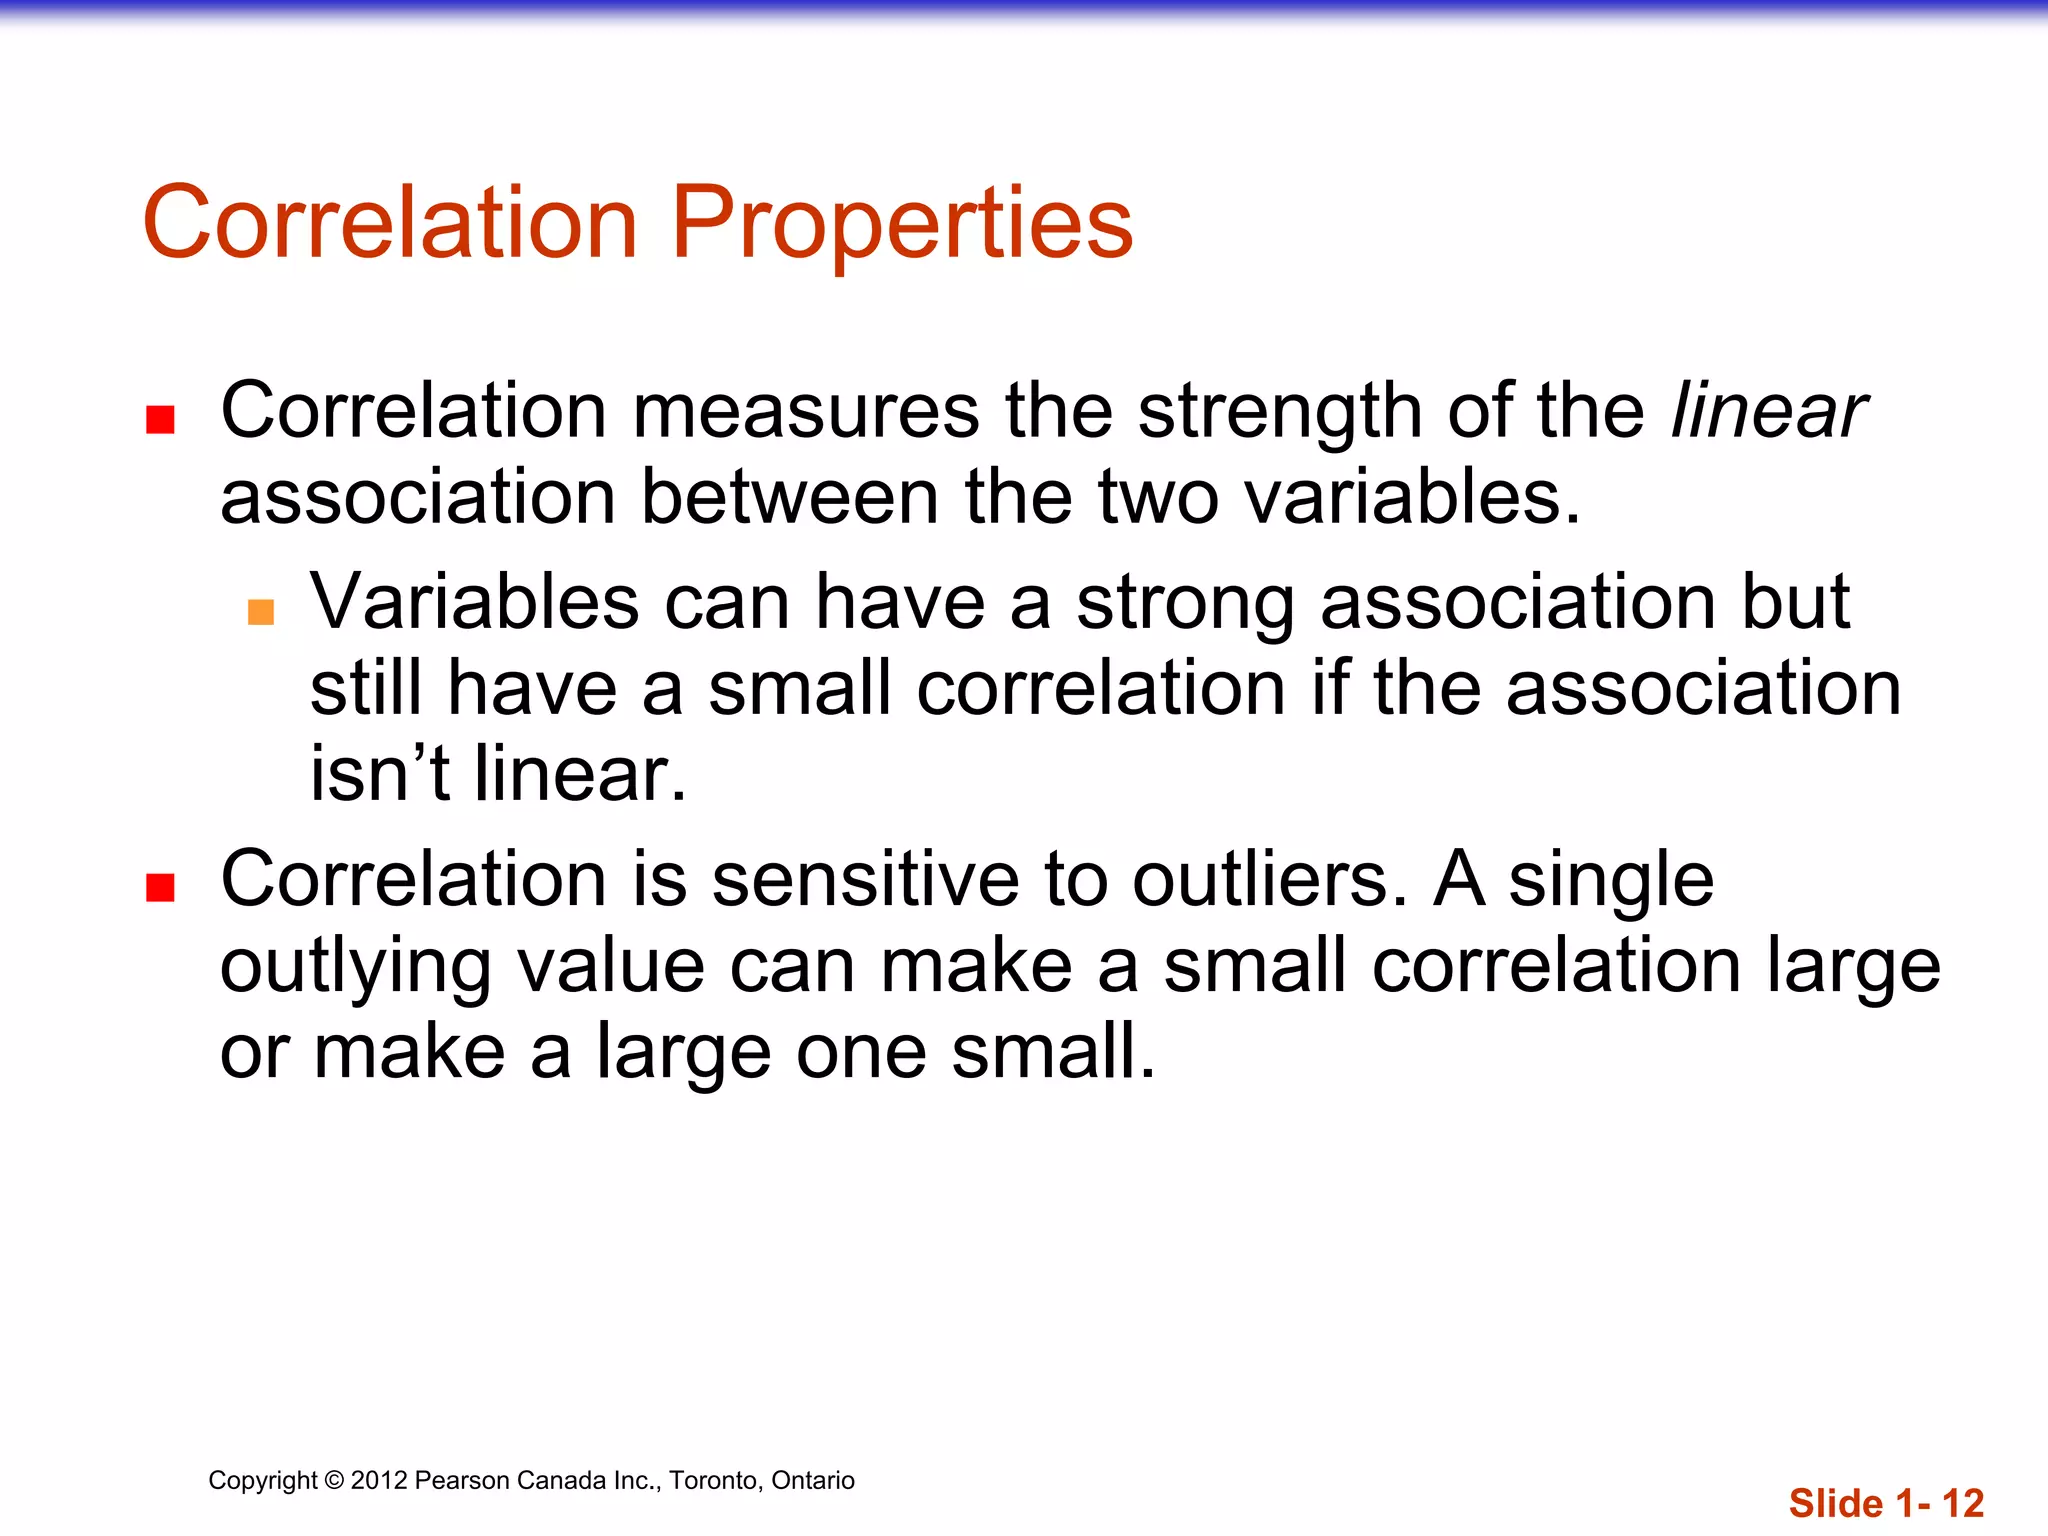
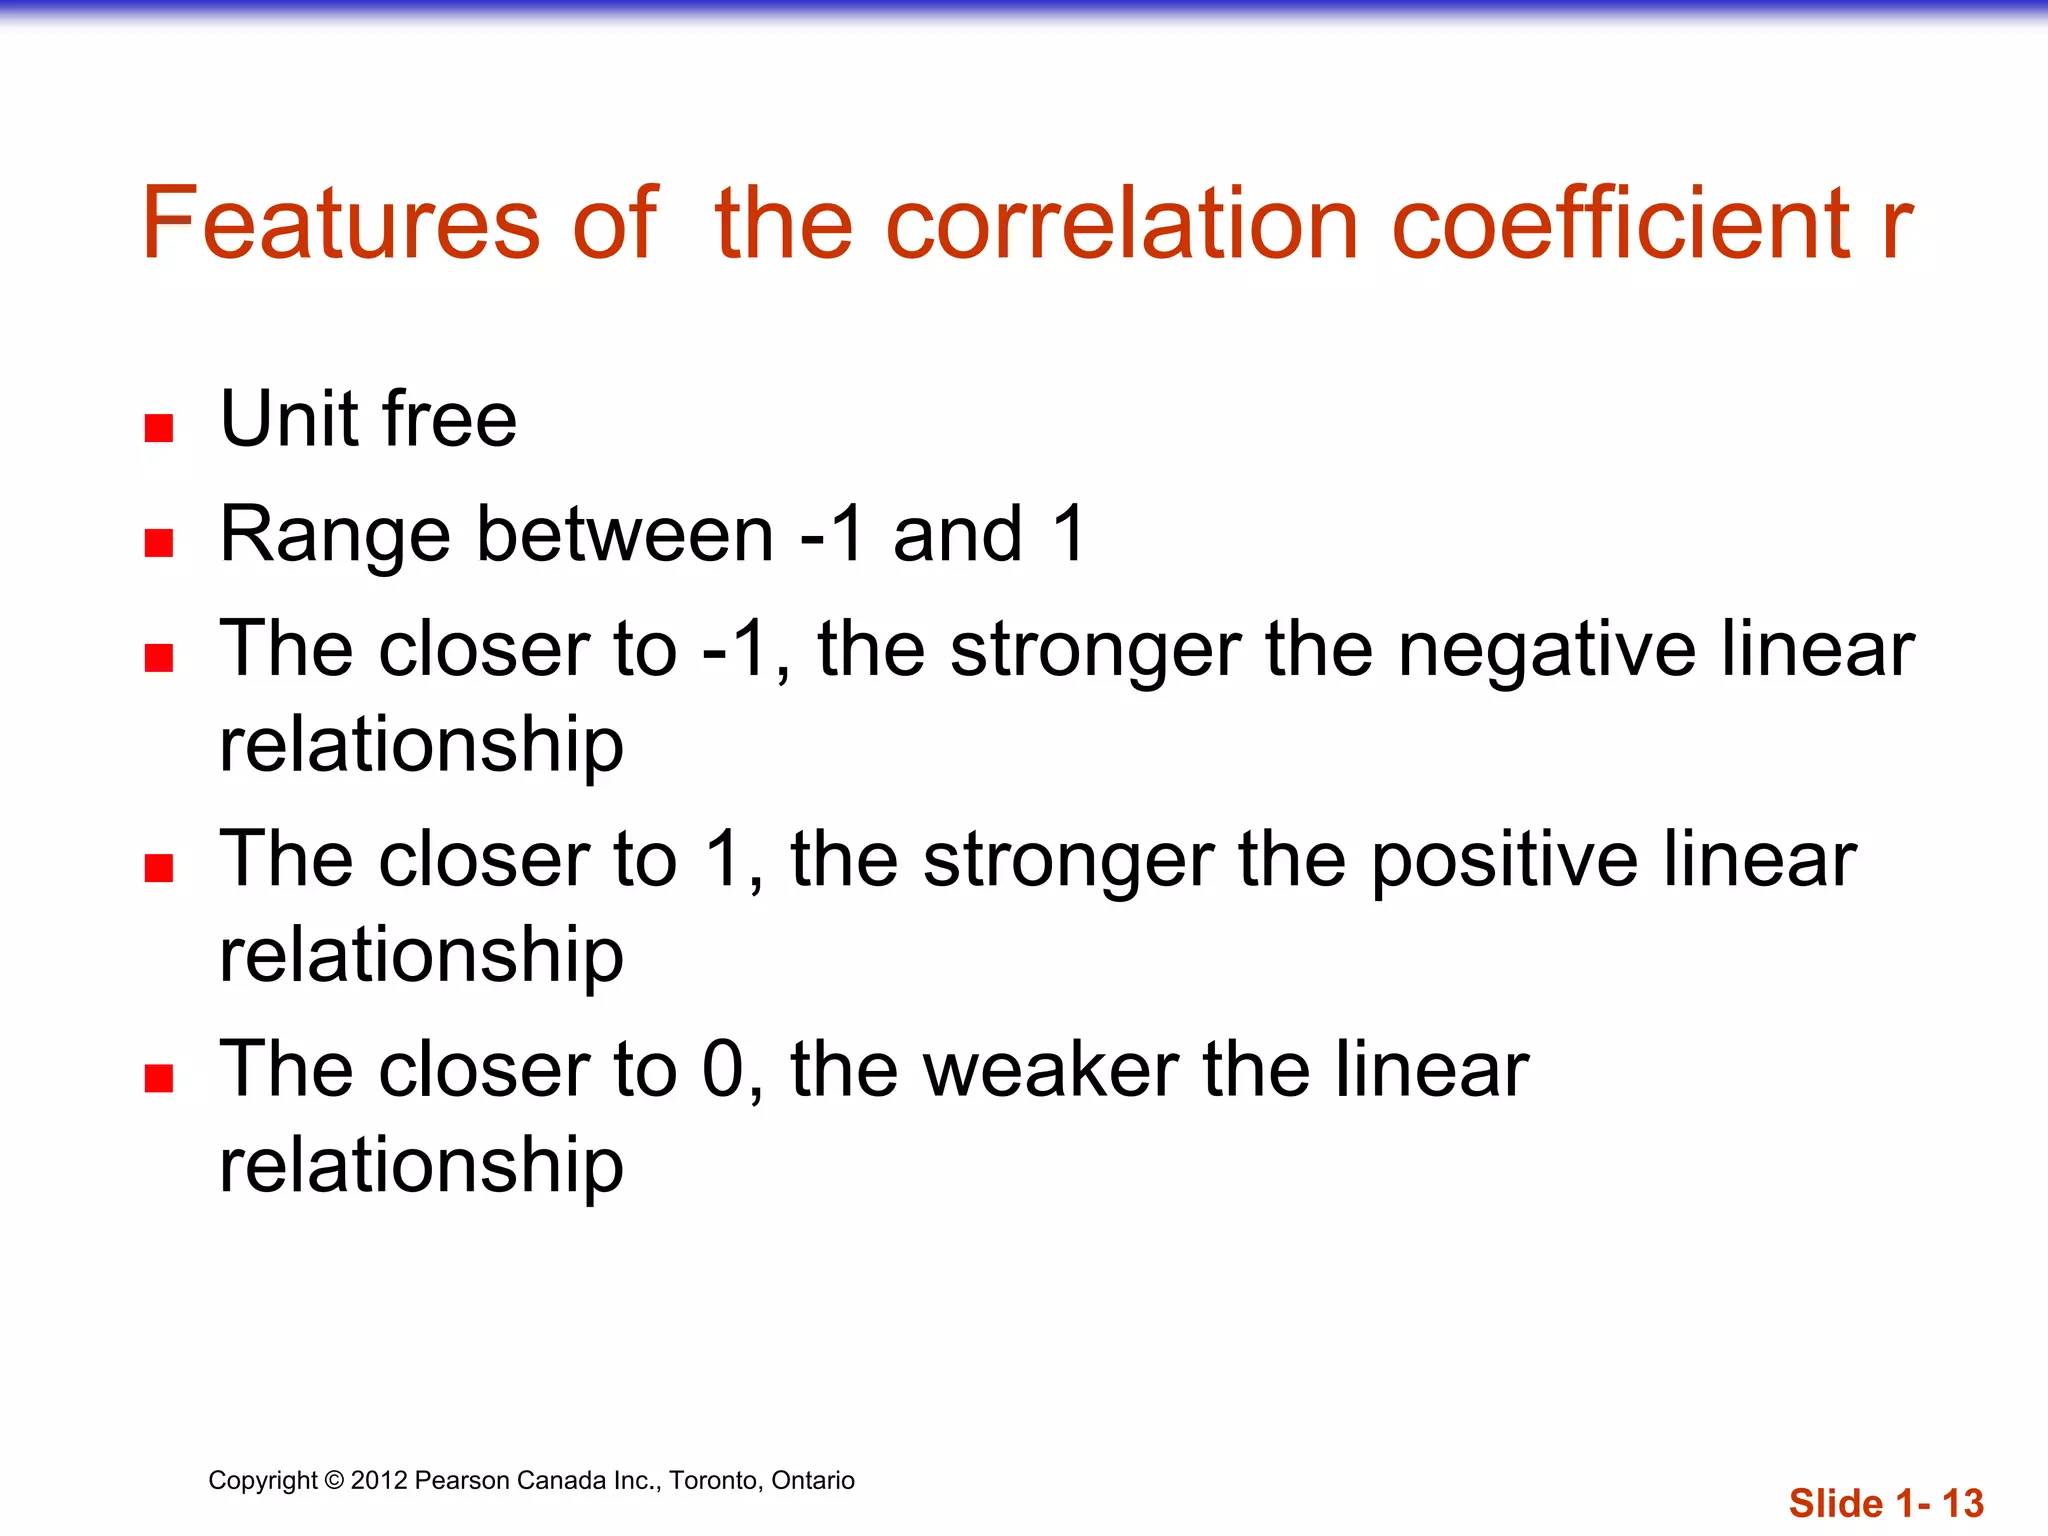
The document discusses correlation and the conditions that must be checked before calculating correlation between two quantitative variables. It explains that correlation measures the strength of the linear association between variables and can only be applied to quantitative, not categorical, variables. Additionally, the relationship must be sufficiently linear for correlation to be valid and outliers can distort results. The document also defines positive and negative correlation and different types of correlation based on the number of variables.
![Copyright © 2012 Pearson Canada Inc., Toronto, Ontario
Calculating the
Correlation Coefficient
])yy(][)xx([
)yy)(xx(
r
22
where:
r = Sample correlation coefficient
n = Sample size
x = Value of the independent variable
y = Value of the dependent variable
])y()y(n][)x()x(n[
yxxyn
r
2222
Sample correlation coefficient:
or the algebraic equivalent:
Slide 1- 15](https://image.slidesharecdn.com/correlation-140710105642-phpapp02/75/Correlation-15-2048.jpg)
][8(14111)(73)[8(713)
(73)(321)8(3142)
]y)()y][n(x)()x[n(
yxxyn
r
22
2222
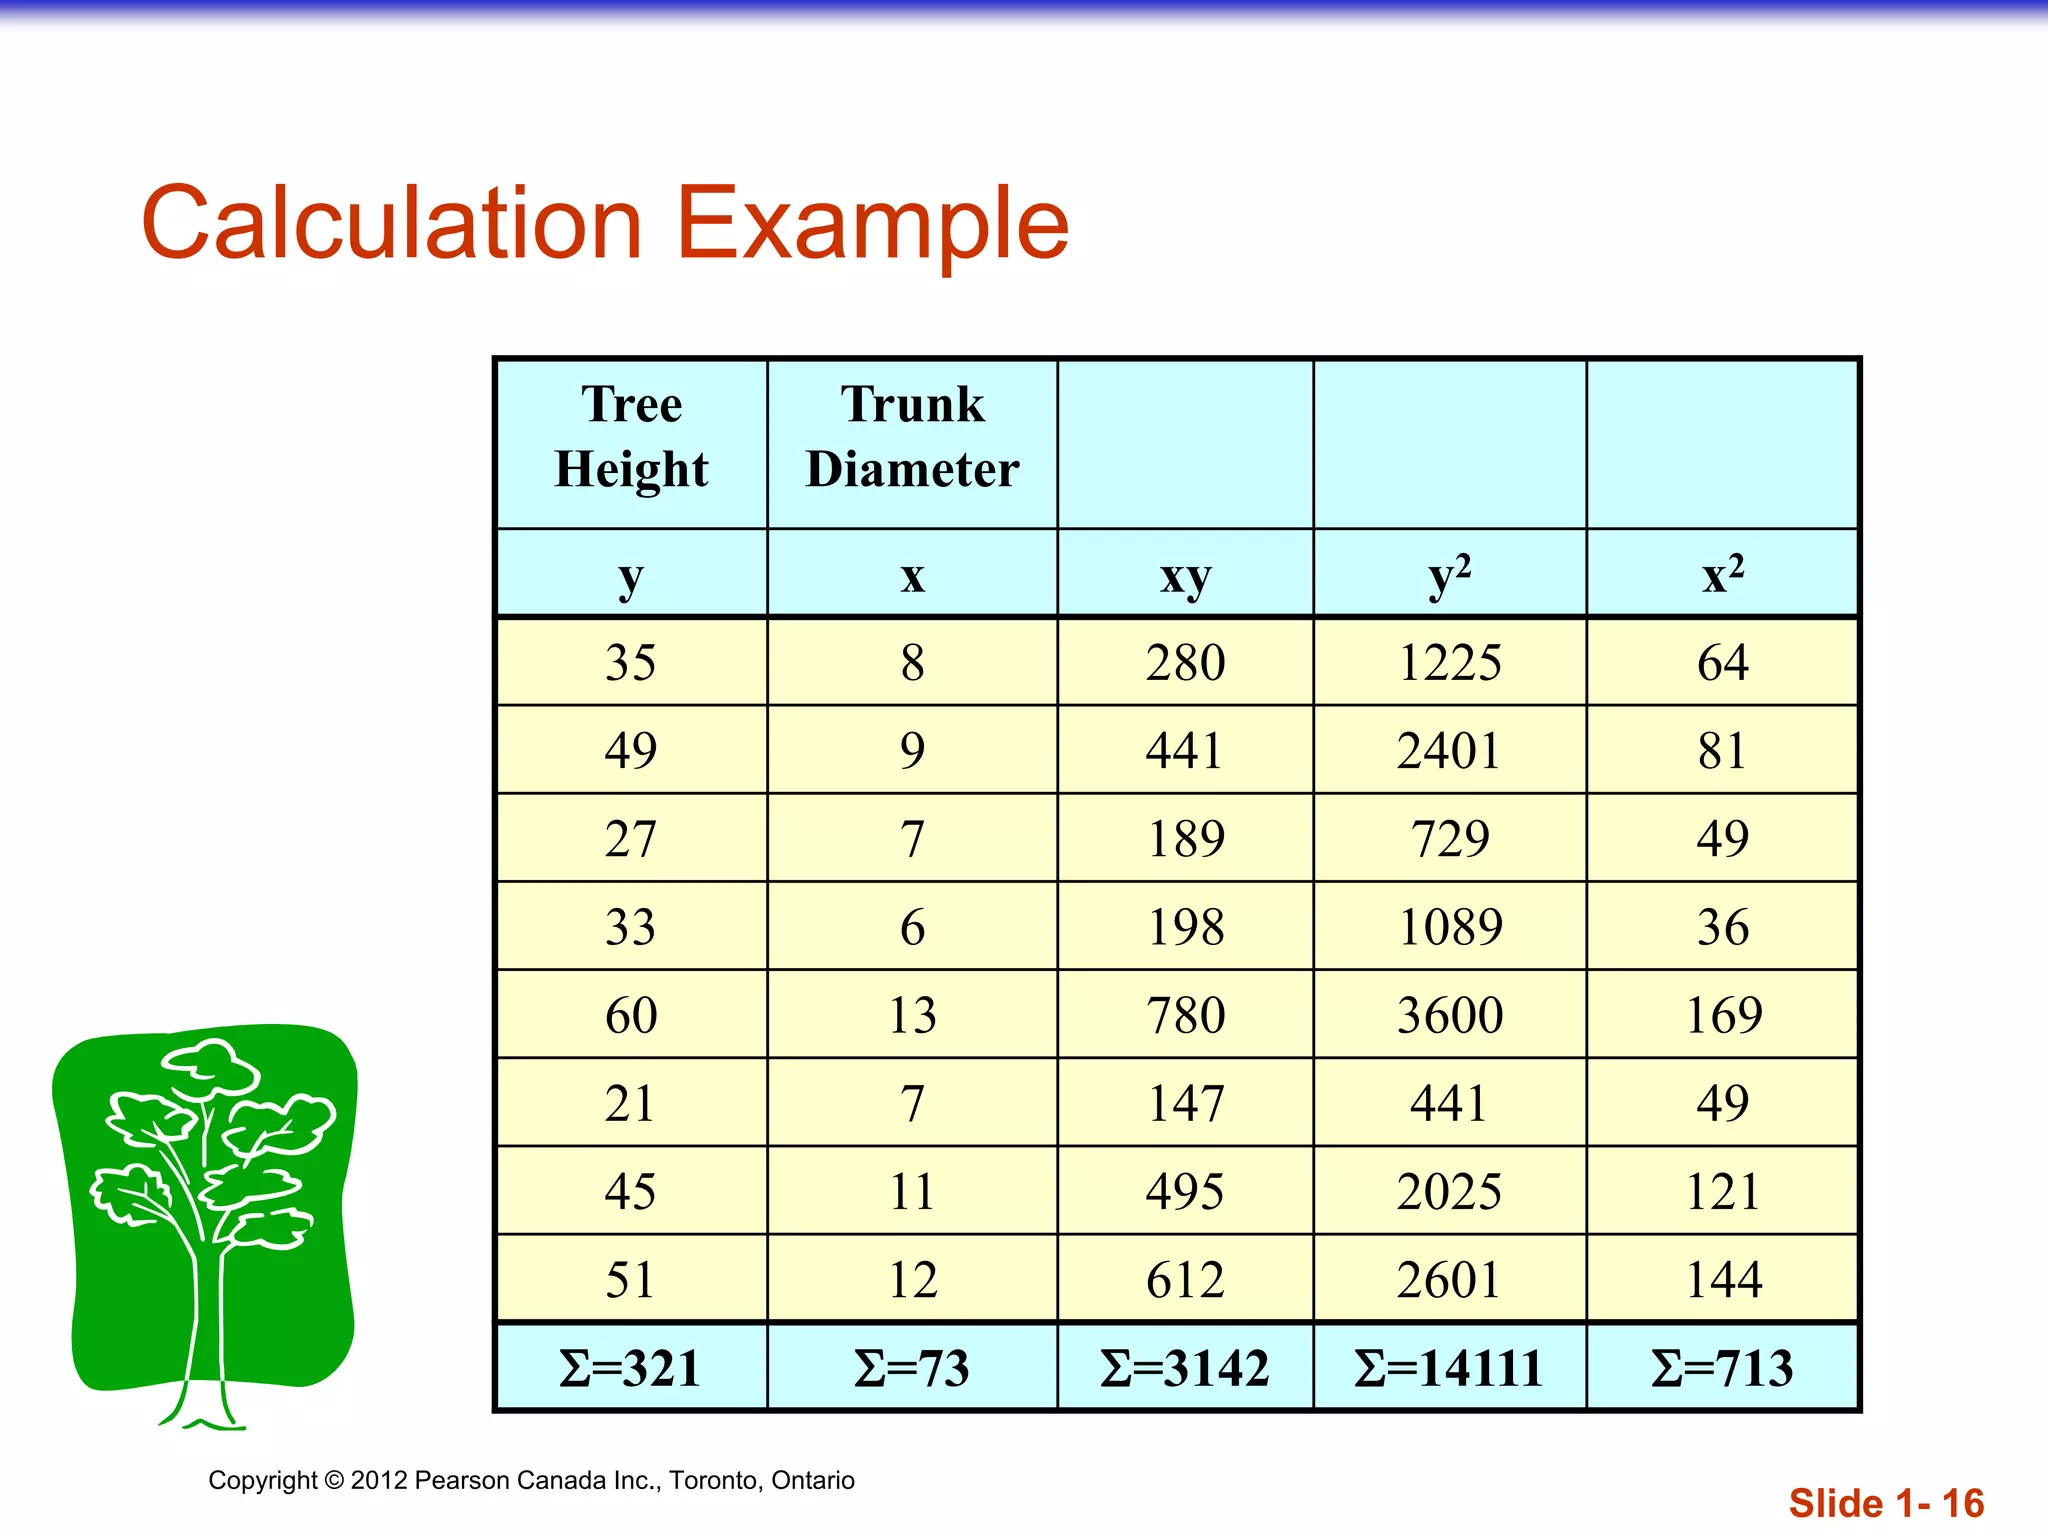
Trunk Diameter, x
Tree
Height,
y
Calculation Example
(continued)
r = 0.886 → relatively strong positive
linear association between x and y
Slide 1- 17](https://image.slidesharecdn.com/correlation-140710105642-phpapp02/75/Correlation-17-2048.jpg)


![[DSC Europe 25] Jim Sterne - Adopting Generative AI Capabilities Into the Ent...](https://cdn.slidesharecdn.com/ss_thumbnails/sxhpofuorcagxsaulkmt-3-251204082258-7e66bc48-thumbnail.jpg?width=640&height=640&fit=bounds)


![[DSC Europe 25] Marija Vlajkovic & Andrea Radonjanin - Integration of AI tool...](https://cdn.slidesharecdn.com/ss_thumbnails/qf1jrglttoc3bm8s3aop-final-integration-of-ai-tools-251208151905-394f3a6a-thumbnail.jpg?width=640&height=640&fit=bounds)


![[DSC Europe 25] Goran Obradovic - The Rise of Sovereign AI: Building the Regi...](https://cdn.slidesharecdn.com/ss_thumbnails/7nw2xxixrxqdxvrb5wca-6-251205085714-ab09a2ac-thumbnail.jpg?width=640&height=640&fit=bounds)