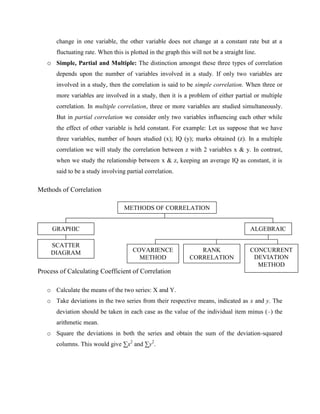
This document discusses correlation analysis and different types of correlation. It defines correlation as a statistical analysis of the relationship between two or more variables. There are three main types of correlation discussed:
1. Positive correlation means that as one variable increases, the other also tends to increase. Negative correlation means that as one variable increases, the other tends to decrease.
2. Simple correlation analyzes the relationship between two variables, while multiple correlation analyzes three or more variables simultaneously. Partial correlation holds the effect of other variables constant.
3. Methods for measuring correlation include scatter diagrams, which graphically show the relationship, and algebraic formulas that calculate a correlation coefficient to quantify the strength and direction of the relationship.
The document discusses the concept of correlation, specifically linear correlation. It provides definitions of correlation from various sources and explains that correlation refers to the relationship between two or more variables. The degree of this relationship is measured by the correlation coefficient. Common types of correlation are discussed such as positive and negative correlation. Methods for studying correlation are also outlined, including scatter diagrams and Karl Pearson's coefficient of correlation.
This document is a presentation by Dwaiti Roy on partial correlation. It begins with an acknowledgement section thanking various professors and resources that helped in preparing the presentation. It then provides definitions and explanations of key concepts related to partial correlation such as correlation, assumptions of correlation, coefficient of correlation, coefficient of determination, variates, partial correlation, assumptions and hypothesis of partial correlation, order and formula of partial correlation. Examples are provided to illustrate partial correlation. The document concludes with references and suggestions for further reading.
Correlation and regression analysis are statistical tools used to analyze relationships between variables. Correlation measures the strength and direction of association between two variables on a scale from -1 to 1. Regression analysis uses one variable to predict the value of another variable and draws a best-fit line to represent their relationship. There are always two lines of regression - one showing the regression of x on y and the other showing the regression of y on x. Regression coefficients from these lines indicate the slope and intercept of the lines and can help estimate unknown variable values based on known values.
This document discusses regression, comparing it to causation and correlation. Regression analysis estimates and predicts the average value of one variable based on the values of other variables. For example, predicting a son's average height from his father's height. Causation indicates a relationship where changing one variable affects another. Correlation measures the association between variables, while regression numerically relates an independent variable to a dependent variable to estimate or predict values.
1. The document discusses correlation and correlation coefficients, which measure the strength and direction of association between two variables.
2. A correlation coefficient ranges from 0, indicating no correlation, to 1 or -1, indicating perfect positive or negative correlation. Coefficients above 0.5 generally indicate a strong linear relationship.
3. The Pearson correlation coefficient (r) specifically measures the linear correlation between two normally distributed variables, while the Spearman correlation (rs) is nonparametric and assesses correlation between ordinal or non-normally distributed variables.
4. Correlation only indicates association, not causation. Significant correlation is also not necessarily clinically meaningful. Correlation coefficients and their statistical significance must be interpreted carefully.
This document discusses correlation and different aspects of studying correlation. It defines correlation as the association or relationship between two variables that do not cause each other. It describes different types of correlation including positive, negative, linear, non-linear, simple, multiple and partial correlation. It also discusses various methods of studying correlation including graphic methods like scattered diagrams and correlation graphs, and algebraic methods like Karl Pearson's correlation coefficient and Spearman's rank correlation coefficient. The document explains concepts like coefficient of determination and hypothesis testing in correlation. It emphasizes that correlation indicates association but does not necessarily imply causation between variables.
Kendall's tau is a nonparametric statistic that measures the ordinal association between two variables. It calculates the number of concordant and discordant pairs to determine the tau coefficient between -1 and 1, where higher positive values indicate a stronger monotonic relationship. Kendall's tau is often used as a hypothesis test of statistical dependence between variables and has advantages over Spearman's rho such as better statistical properties and direct interpretation. A partial correlation measures the relationship between two variables while controlling for one or more other variables. A scatter plot graphs the relationship between two quantitative variables with one on the x-axis and one on the y-axis to identify outliers, correlation, and the type of relationship.
The document discusses correlation and the coefficient of correlation. It defines correlation as a statistical tool used to study the relationship between two or more variables. The coefficient of correlation (r) is a measure of the strength and direction of the linear relationship between variables. r can range from -1 to 1, where -1 is perfect negative correlation, 0 is no correlation, and 1 is perfect positive correlation. A scatter diagram can be used to visually depict the relationship between variables and provide an initial assessment of correlation.
Correlation analysis measures the strength and direction of association between two or more variables. It is represented by the coefficient of correlation (r), which ranges from -1 to 1. A value of 0 indicates no association, 1 indicates perfect positive association, and -1 indicates perfect negative association. The scatter diagram is a graphical method to visualize the association between variables by plotting their values. Karl Pearson's coefficient is a commonly used algebraic method to calculate the coefficient of correlation from sample data.
This document discusses correlation and the correlation coefficient. It defines correlation as a measure of the relationship between two variables. It explains that the correlation coefficient indicates the magnitude and direction of the relationship as well as the strength of the relationship and percentage of variance explained. Values of the correlation coefficient are interpreted as showing no relationship, a low relationship, or a strong relationship. Conditions for interpreting the correlation coefficient include data forming a linear pattern and equal variances.
The document discusses correlation and regression analysis. It defines positive and negative correlation, as well as linear and non-linear correlation. It provides examples of variables that are positively and negatively correlated. It also discusses how correlation coefficients measure the strength of the relationship between two variables from -1 to 1. Regression analysis uses regression equations to predict unknown variable values from known variable values.
Fundamental of Statistics and Types of CorrelationsRajesh Verma
This document provides an overview of key concepts in statistics including parametric vs non-parametric statistics, descriptive vs inferential statistics, types of errors, significance levels, correlation, and different correlation coefficients. Parametric statistics rely on assumptions of the normal distribution while non-parametric do not. Descriptive statistics describe data and inferential statistics draw conclusions. Type I and II errors occur when the null hypothesis is incorrectly rejected or not rejected. Significance levels like 0.05 are used to determine statistical significance. Correlation measures the relationship between variables from -1 to 1. Different coefficients like Pearson, Spearman, and Kendall's Tau are used depending on the scale of measurement and data distribution.
This document defines correlation and discusses different types of correlation. It states that correlation refers to the relationship between two variables, where their values change together. There can be positive correlation, where variables change in the same direction, or negative correlation, where they change in opposite directions. Correlation can also be linear, nonlinear, simple, multiple, or partial. The degree of correlation is measured by the coefficient of correlation, which ranges from -1 to 1. Graphic and algebraic methods like scatter diagrams and calculating the coefficient can be used to study correlation.
Correlation and regression analysis are statistical methods used to determine relationships between variables. Correlation determines if a linear relationship exists between variables but does not imply causation. While correlation between age and height in children suggests a causal relationship, correlation between mood and health is less clear on causality. Regression analysis helps understand how changes in independent variables impact a dependent variable when other independent variables are held fixed. Linear regression models the dependent variable as a linear combination of parameters, while non-linear regression uses iterative procedures when the model is non-linear in parameters.
This is about the correlation analysis in statistics. It covers types, importance,Scatter diagram method
Karl pearson correlation coefficient
Spearman rank correlation coefficient
The document discusses covariance and correlation, which describe the relationship between two variables. Covariance indicates whether variables are positively or inversely related, while correlation also measures the degree of their relationship. A positive covariance/correlation means variables move in the same direction, while a negative covariance/correlation means they move in opposite directions. Correlation coefficients range from 1 to -1, with 1 indicating a perfect positive correlation and -1 a perfect inverse correlation. The document provides formulas for calculating covariance and correlation and examples to demonstrate their use.
This document discusses correlation analysis, including definitions, types of correlation (positive, negative, linear, nonlinear), and methods of studying correlation (scatter diagrams, correlation graphs, coefficient of correlation). Correlation refers to the relationship between two or more variables, where they either move in the same direction (positive correlation) or opposite directions (negative correlation). Correlation does not necessarily imply causation. Methods of measuring correlation include scatter diagrams, correlation graphs, and Karl Pearson's coefficient of correlation which provides a numerical measurement of the correlation between -1 and 1.
The document presents a presentation on coefficient correlation by Irshad Narejo. It defines correlation as a technique used to measure the relationship between two or more variables. A correlation coefficient measures the degree to which changes in one variable can predict changes in another, though correlation does not imply causation. Correlation coefficient formulas return a value between -1 and 1 to indicate the strength and direction of relationships between data. Positive correlation means high values in one variable are associated with high values in the other, while negative correlation means high values in one variable are associated with low values in the other. The document discusses Pearson's correlation coefficient formula and provides an example of calculating correlation by hand versus using SPSS.
This document discusses correlation and defines it as the statistical relationship between two variables, where a change in one variable results in a corresponding change in the other. It describes different types of correlation including positive, negative, simple, partial and multiple. Methods for studying correlation are also outlined, including scatter diagrams and Karl Pearson's coefficient of correlation (represented by r), which quantifies the strength and direction of the linear relationship between two variables from -1 to 1. The coefficient of determination (r2) is also introduced, which expresses the proportion of variance in one variable that is predictable from the other.
Correlation analysis is a statistical technique used to determine the degree of relationship between two quantitative variables. Scatterplots are used to graphically depict the relationship and identify if it is positive, negative, or no correlation. The correlation coefficient measures the strength and direction of correlation, ranging from -1 to 1. A significance test determines if a correlation is likely to have occurred by chance or is statistically significant. Different types of correlation include simple, multiple, partial, and autocorrelation.
This document discusses correlation analysis and its various types. Correlation is the degree of relationship between two or more variables. There are three stages to solve correlation problems: determining the relationship, measuring significance, and establishing causation. Correlation can be positive, negative, simple, partial, or multiple depending on the direction and number of variables. It is used to understand relationships, reduce uncertainty in predictions, and present average relationships. Conditions like probable error and coefficient of determination help interpret correlation values.
Covariance is a measure of how two random variables change together, taking any value from -∞ to +∞. Covariance can be affected by changing the units of the variables. Correlation is a scaled version of covariance that indicates the strength of the relationship between two variables on a scale of -1 to 1. Unlike covariance, correlation is not affected by changes in the location or scale of the variables and provides a standardized measure of their relationship. Correlation is therefore preferred over covariance as a measure of the relationship between two variables.
HOW IS IT USEFUL IN FIELD OF FORENSIC SCIENCE AND IN THIS I HAVE SHOWN THE TYPES OF CORRELATION, SIGNIFICANCE , METHODS AND KARL PEARSON'S METHOD OF CORRELATION
This document provides an overview of correlation coefficients and how to interpret them. It discusses the difference between correlation strength and significance. The key points covered are:
ONE: Correlation coefficients measure the strength and direction of association between two variables but do not imply causation. Strength is evaluated on a scale from -1 to 1 while significance is determined by comparing the p-value to the significance level alpha.
TWO: There are two parts to interpreting a correlation - the coefficient indicates strength (weak, moderate, strong) while the p-value determines if the correlation is statistically significant or could be due to chance.
THREE: Examples are provided to demonstrate how to interpret correlation output and determine the most strongly correlated variables
Reference/Article
Module 18: Correlational Research
Magnitude, Scatterplots, and Types of Relationships
Magnitude
Scatterplots
Positive Relationships
Negative Relationships
No Relationship
Curvilinear Relationships
Misinterpreting Correlations
The Assumptions of Causality and Directionality
The Third-Variable Problem
Restrictive Range
Curvilinear Relationships
Prediction and Correlation
Review of Key Terms
Module Exercises
Critical Thinking Check Answers
Module 19: Correlation Coefficients
The Pearson Product-Moment Correlation Coefficient: What It Is and What It Does
Calculating the Pearson Product-Moment Correlation
Interpreting the Pearson Product-Moment Correlation
Alternative Correlation Coefficients
Review of Key Terms
Module Exercises
Critical Thinking Check Answers
Module 20: Advanced Correlational Techniques: Regression Analysis
Regression Lines
Calculating the Slope and y-intercept
Prediction and Regression
Multiple Regression Analysis
Review of Key Terms
Module Exercises
Critical Thinking Check Answers
Chapter 9 Summary and Review
Chapter 9 Statistical Software Resources
In this chapter, we discuss correlational research methods and correlational statistics. As a research method, correlational designs allow us to describe the relationship between two measured variables. A correlation coefficient aids us by assigning a numerical value to the observed relationship. We begin with a discussion of how to conduct correlational research, the magnitude and the direction of correlations, and graphical representations of correlations. We then turn to special considerations when interpreting correlations, how to use correlations for predictive purposes, and how to calculate correlation coefficients. Lastly, we will discuss an advanced correlational technique, regression analysis.
MODULE 18
Correlational Research
Learning Objectives
•Describe the difference between strong, moderate, and weak correlation coefficients.
•Draw and interpret scatterplots.
•Explain negative, positive, curvilinear, and no relationship between variables.
•Explain how assuming causality and directionality, the third-variable problem, restrictive ranges, and curvilinear relationships can be problematic when interpreting correlation coefficients.
•Explain how correlations allow us to make predictions.
When conducting correlational studies, researchers determine whether two naturally occurring variables (for example, height and weight, or smoking and cancer) are related to each other. Such studies assess whether the variables are “co-related” in some way—do people who are taller tend to weigh more, or do those who smoke tend to have a higher incidence of cancer? As we saw in Chapter 1, the correlational method is a type of nonexperimental method that describes the relationship between two measured variables. In addition to describing a relationship, correlations also allow us to make predictions from one variable to another. If two variables are correlated, we can pred.
This document defines correlation and discusses different types of correlation. It states that correlation refers to the relationship between two variables, where their values change together. There can be positive correlation, where variables change in the same direction, or negative correlation, where they change in opposite directions. Correlation can also be linear, nonlinear, simple, multiple, or partial. The degree of correlation is measured using a coefficient of correlation between -1 and 1, indicating no, perfect, or limited correlation. Correlation is studied using scatter diagrams or graphs and calculated using formulas to find the coefficient.
This document discusses correlation analysis and its various types. Correlation is a measure of the relationship between two or more variables. There are three main types of correlation based on the degree, number of variables, and linearity. Correlation can be positive, negative, simple, partial, multiple, linear, or non-linear. Correlation is important for understanding relationships between variables, making predictions, and interpreting data. However, correlation does not necessarily imply causation.
This document discusses correlation analysis in agriculture. It begins by defining correlation as the relationship between two or more variables. Some key points:
- Correlation can be positive (variables move in the same direction), negative (variables move in opposite directions), linear, nonlinear, simple, multiple, partial or total.
- Common types analyzed in agriculture include the relationship between yield and rainfall, price and supply, height and weight.
- Methods for measuring correlation are discussed, including Karl Pearson's coefficient of correlation (denoted by r), Spearman's rank correlation, and scatter diagrams.
- The value of r ranges from -1 to 1, with higher positive or negative values indicating a stronger linear relationship between variables
36030 Topic Discussion1Number of Pages 2 (Double Spaced).docxrhetttrevannion
36030 Topic: Discussion1
Number of Pages: 2 (Double Spaced)
Number of sources: 1
Writing Style: APA
Type of document: Essay
Academic Level:Master
Category: Psychology
Language Style: English (U.S.)
Order Instructions: Attached
I will upload the instruction
Reference/Article
Module 18: Correlational Research
Magnitude, Scatterplots, and Types of Relationships
Magnitude
Scatterplots
Positive Relationships
Negative Relationships
No Relationship
Curvilinear Relationships
Misinterpreting Correlations
The Assumptions of Causality and Directionality
The Third-Variable Problem
Restrictive Range
Curvilinear Relationships
Prediction and Correlation
Review of Key Terms
Module Exercises
Critical Thinking Check Answers
Module 19: Correlation Coefficients
The Pearson Product-Moment Correlation Coefficient: What It Is and What It Does
Calculating the Pearson Product-Moment Correlation
Interpreting the Pearson Product-Moment Correlation
Alternative Correlation Coefficients
Review of Key Terms
Module Exercises
Critical Thinking Check Answers
Module 20: Advanced Correlational Techniques: Regression Analysis
Regression Lines
Calculating the Slope and y-intercept
Prediction and Regression
Multiple Regression Analysis
Review of Key Terms
Module Exercises
Critical Thinking Check Answers
Chapter 9 Summary and Review
Chapter 9 Statistical Software Resources
In this chapter, we discuss correlational research methods and correlational statistics. As a research method, correlational designs allow us to describe the relationship between two measured variables. A correlation coefficient aids us by assigning a numerical value to the observed relationship. We begin with a discussion of how to conduct correlational research, the magnitude and the direction of correlations, and graphical representations of correlations. We then turn to special considerations when interpreting correlations, how to use correlations for predictive purposes, and how to calculate correlation coefficients. Lastly, we will discuss an advanced correlational technique, regression analysis.
MODULE 18
Correlational Research
Learning Objectives
•Describe the difference between strong, moderate, and weak correlation coefficients.
•Draw and interpret scatterplots.
•Explain negative, positive, curvilinear, and no relationship between variables.
•Explain how assuming causality and directionality, the third-variable problem, restrictive ranges, and curvilinear relationships can be problematic when interpreting correlation coefficients.
•Explain how correlations allow us to make predictions.
When conducting correlational studies, researchers determine whether two naturally occurring variables (for example, height and weight, or smoking and cancer) are related to each other. Such studies assess whether the variables are “co-related” in some way—do people who are taller tend to weigh more, or do those who smoke tend to have a higher incidence of cancer? As we saw in Chapter 1, the correlationa.
Data analysis test for association BY Prof Sachin Udepurkarsachinudepurkar
1) The document discusses analyzing relationships between variables through bivariate analysis. Bivariate analysis examines the relationship between two variables and can determine direction, strength, and statistical significance.
2) It provides examples of using scatter plots and calculating covariance to visually represent and quantify relationships between variables. Covariance measures how much two variables change together.
3) Calculating the correlation coefficient further standardizes and quantifies relationships, resulting in a number between -1 and 1 that indicates the strength and direction of a relationship. Strong positive or negative correlations near 1 or -1 show clear relationships between variables.
It is most useful for the students of BBA for the subject of "Data Analysis and Modeling"/
It has covered the content of chapter- Data regression Model
Visit for more on www.ramkumarshah.com.np/
This document provides an overview of correlation and linear regression analysis. It defines correlation as a statistical measure of the relationship between two variables. Pearson's correlation coefficient (r) ranges from -1 to 1, with values farther from 0 indicating a stronger linear relationship. Positive values indicate an increasing relationship, while negative values indicate a decreasing relationship. The coefficient of determination (r2) represents the proportion of shared variance between variables. While correlation indicates linear association, it does not imply causation. Multiple regression allows predicting a continuous dependent variable from two or more independent variables.
Discriminant analysis (DA) is a statistical technique used to predict group membership when the dependent variable is categorical and the independent variables are continuous. It identifies which variables discriminate between two or more naturally occurring groups. DA develops a linear equation to predict group membership based on weighted combinations of predictor variables. It aims to maximize the distance between group means to achieve strong discriminatory power. Like regression, DA assumes variables are normally distributed, cases are randomly sampled, and groups are mutually exclusive and collectively exhaustive. It requires at least two groups with minimal overlap and similar group sizes of at least five cases. DA can classify new cases into groups based on the discriminant functions derived from existing data.
36033 Topic Happiness Data setNumber of Pages 2 (Double Spac.docxrhetttrevannion
36033 Topic: Happiness Data set
Number of Pages: 2 (Double Spaced)
Number of sources: 1
Writing Style: APA
Type of document: Essay
Academic Level:Master
Category: Psychology
Language Style: English (U.S.)
Order Instructions: Attached
I will upload the instructions
Reference/Article
Module 18: Correlational Research
Magnitude, Scatterplots, and Types of Relationships
Magnitude
Scatterplots
Positive Relationships
Negative Relationships
No Relationship
Curvilinear Relationships
Misinterpreting Correlations
The Assumptions of Causality and Directionality
The Third-Variable Problem
Restrictive Range
Curvilinear Relationships
Prediction and Correlation
Review of Key Terms
Module Exercises
Critical Thinking Check Answers
Module 19: Correlation Coefficients
The Pearson Product-Moment Correlation Coefficient: What It Is and What It Does
Calculating the Pearson Product-Moment Correlation
Interpreting the Pearson Product-Moment Correlation
Alternative Correlation Coefficients
Review of Key Terms
Module Exercises
Critical Thinking Check Answers
Module 20: Advanced Correlational Techniques: Regression Analysis
Regression Lines
Calculating the Slope and y-intercept
Prediction and Regression
Multiple Regression Analysis
Review of Key Terms
Module Exercises
Critical Thinking Check Answers
Chapter 9 Summary and Review
Chapter 9 Statistical Software Resources
In this chapter, we discuss correlational research methods and correlational statistics. As a research method, correlational designs allow us to describe the relationship between two measured variables. A correlation coefficient aids us by assigning a numerical value to the observed relationship. We begin with a discussion of how to conduct correlational research, the magnitude and the direction of correlations, and graphical representations of correlations. We then turn to special considerations when interpreting correlations, how to use correlations for predictive purposes, and how to calculate correlation coefficients. Lastly, we will discuss an advanced correlational technique, regression analysis.
MODULE 18
Correlational Research
Learning Objectives
•Describe the difference between strong, moderate, and weak correlation coefficients.
•Draw and interpret scatterplots.
•Explain negative, positive, curvilinear, and no relationship between variables.
•Explain how assuming causality and directionality, the third-variable problem, restrictive ranges, and curvilinear relationships can be problematic when interpreting correlation coefficients.
•Explain how correlations allow us to make predictions.
When conducting correlational studies, researchers determine whether two naturally occurring variables (for example, height and weight, or smoking and cancer) are related to each other. Such studies assess whether the variables are “co-related” in some way—do people who are taller tend to weigh more, or do those who smoke tend to have a higher incidence of cancer? As we saw in Chapter 1, the cor.
The document provides an overview of correlation, regression, and other statistical methods. It defines correlation as measuring the association between two variables, while regression finds the best fitting line to predict a dependent variable from an independent variable. Simple linear regression uses one predictor variable, while multiple linear regression uses two or more. Logistic regression is used for nominal dependent variables. Nonlinear regression fits curved lines to nonlinear data. The document provides examples and guidelines for choosing the appropriate statistical test based on the type of variables.
This document discusses correlation and regression analysis. It defines correlation as a statistical measure of how two variables are related. A correlation coefficient between -1 and 1 indicates the strength and direction of the linear relationship between variables. A scatterplot can show this graphically. Regression analysis involves using one variable to predict scores on another variable. Simple linear regression uses one independent variable to predict a dependent variable, while multiple regression uses two or more independent variables. The goal is to identify the regression line that best fits the data with the least error. The coefficient of determination, R2, indicates how much variance in the dependent variable is explained by the independent variables.
This document discusses correlation and linear regression. It defines correlation as the statistical relationship between two variables, ranging from -1 to 1. Positive correlation means the variables increase or decrease together, while negative correlation means they deviate in opposite directions. Linear regression analyzes the linear relationship between a dependent and independent variable to predict future outcomes. It allows executives to forecast sales, understand how variables influence each other, and prepare budgets based on regression equations.
The document discusses different types of correlation and methods for studying correlation. It describes Karl Pearson's coefficient of correlation, which measures the strength and direction of a linear relationship between two variables. The coefficient ranges from -1 to 1, where -1 is a perfect negative correlation, 0 is no correlation, and 1 is a perfect positive correlation. The document also discusses other types of correlation coefficients like Spearman's rank correlation coefficient and methods for analyzing correlation like scatter plots.
This document discusses correlation coefficient and different types of correlation. It defines correlation coefficient as the measure of the degree of relationship between two variables. It explains different types of correlation such as perfect positive correlation, perfect negative correlation, moderately positive correlation, moderately negative correlation, and no correlation. It also discusses different methods to study correlation including scatter diagram method, graphic method, Karl Pearson's coefficient of correlation method, and Spearman's rank correlation method. It provides examples and steps to calculate correlation coefficient using these different methods.
This document discusses correlation and regression analysis. It defines correlation as a statistical measure of how strongly two variables are related. A correlation coefficient between -1 and 1 indicates the strength and direction of the linear relationship between variables. Regression analysis allows us to predict the value of a dependent variable based on the value of one or more independent variables. Simple linear regression involves one independent variable, while multiple regression involves two or more independent variables to predict the dependent variable. The document provides examples and formulas for calculating correlation, regression lines, explained and unexplained variance, and the coefficient of determination.
Multivariate Analysis Degree of association between two variable- Test of Ho...NiezelPertimos
The document discusses multivariate analysis and correlation. It defines correlation as a measure of the degree of association between two variables. A correlation coefficient between -1 and 1 indicates the strength and direction of the linear relationship, with values closer to 1 or -1 being stronger. Positive correlation means the variables move in the same direction, while negative correlation means they move in opposite directions. The document provides examples and methods for calculating and interpreting correlation coefficients, including using scatter plots and the Pearson product-moment formula. Excel functions for finding correlation across multiple data sets are also described.
Correlation and regression are statistical techniques used to analyze relationships between variables. Correlation determines the strength and direction of a relationship, while regression describes the linear relationship to predict changes in one variable based on changes in another. There are different types of correlation including simple, multiple, and partial correlation. Regression analysis determines the regression line that best fits the data to estimate values of one variable based on the other. The correlation coefficient measures the strength of linear correlation from -1 to 1, while regression coefficients are used to predict changes in the variables.
The document discusses correlation and regression analysis. It defines correlation as the statistical relationship between two variables, where a change in one variable corresponds to a change in the other. The key types of correlation are positive, negative, simple, partial and multiple, and linear and non-linear. Regression analysis establishes the average relationship between an independent and dependent variable in order to predict or estimate values of the dependent variable based on the independent variable. Methods for studying correlation include scatter diagrams and Karl Pearson's coefficient of correlation, while regression analysis uses equations to model the linear relationship between variables.
Correlation analysis is a statistical method used to measure the strength of the linear relationship between two variables. A high correlation indicates a strong relationship, while a low correlation means the variables are weakly related. Researchers use correlation analysis in market research to identify relationships, patterns, and trends between variables. There are three types of correlation - positive, negative, and no correlation. Methods for studying correlation include scatter diagrams and Karl Pearson's coefficient of correlation. Spearman's rank correlation coefficient is used when variables are qualitative rather than quantitative.
The Single National Curriculum for mathematics aims to develop mathematical literacy, logical thinking, and the ability to solve real-life problems. It is divided into four strands: numbers and operations, algebra, measurements and geometry, and data handling. The curriculum also emphasizes developing students' spiritual, moral, social, and cultural values through mathematics. It takes a concrete-pictorial-abstract approach and uses real-life situations, stories, mental math, and inquiry to engage students in mathematical reasoning from grades 1 to 5. Assessment includes formative methods like tests and projects as well as summative term and final exams. Teaching resources include manuals, workbooks, and online materials.
This document outlines a unit on number operations from the Single National Curriculum for Class 2. It includes 1) comprehensive student learning outcomes like adding two-digit numbers, 2) using conceptual understanding with examples, 3) integrated methodologies like a lab activity using spinners to practice addition, 4) student worksheets and homework assignments, and 5) assessment measures like a class quiz with addition word problems. Remedial assistance is also provided for students who need extra help mastering the key concepts.
The document compares the mathematics curriculum and standards between the 2006 National Curriculum and the 2020 Single National Curriculum (SNC) in Pakistan. It shows that the core strands and standards of Numbers and Operations, Algebra, Geometry and Measurement, and Data Handling remain the same, but Reasoning and Logical Thinking is now underpinned across all strands in the SNC. The SNC also re-groups grades, updates benchmarks, standards, and student learning outcomes to emphasize application, problem-solving, and mathematical thinking over rote learning. Unit structures, weightages, and cognitive domains are also adjusted in the SNC.
The 2020 curriculum focuses on developing logical and procedural fluency through reasoning and situational based questions compared to the 2006 curriculum which focused on conceptual understanding and real life applications. Some key differences include introducing new concepts through warm-up activities and using math labs rather than real-life situations, assessing students through portfolios and project-based work rather than just pen and paper tests, and incorporating ICT like GeoGebra. Both curricula aim to develop conceptual understanding, but the 2020 version emphasizes linking past experiences and deriving formulas independently through activities while the 2006 version focused more on memorizing formulas through worksheets.
This document discusses the key concepts of gravitation, including:
1) Isaac Newton discovered the law of universal gravitation after observing an apple fall from a tree, realizing all objects attract each other with a gravitational force.
2) Newton's law of universal gravitation states that every object in the universe attracts every other object with a force directly proportional to the product of their masses and inversely proportional to the square of the distance between them.
3) The gravitational force between two objects follows Newton's third law of motion, with equal but opposite forces between the objects.
This document discusses Newton's law of universal gravitation. It begins by stating the aims of understanding force of gravitation and deriving the mathematical law. It then defines gravity as a force that causes every object in the universe to attract each other. The key points are that Newton's law states that the gravitational force between two objects is directly proportional to their masses and inversely proportional to the square of the distance between them. The document derives the gravitational formula and notes that gravitational force is very small between everyday objects, which is why we do not notice it.
This chapter discusses gravitation and covers:
- Isaac Newton discovered gravity by observing an apple fall from a tree.
- Newton concluded that a force called gravitation causes objects to attract each other, deriving the inverse square law of universal gravitation.
- The gravitational force between two objects is directly proportional to their masses and inversely proportional to the square of the distance between them.
This document discusses ratios and proportions. It provides a hierarchy of ratio-related concepts including fractions, equivalent ratios, ratios, unitary method, proportions, direct proportions, and inverse proportions. It includes learning objectives about understanding ratios, using ratio notation, dividing quantities in a given ratio, and recognizing the relationship between ratios and proportions. It provides examples of setting up and comparing ratios between quantities like weights of objects. It also gives examples of ratio assessment questions and converting units to the same units to simplify ratios.
The document discusses the difference between active and passive voice. In passive voice, the subject receives the action while in active voice, the subject performs the action. Passive voice uses helping verbs like "be" and "by" while active voice is more concise and direct. The document provides examples of sentences in both voices and offers tips on changing passive sentences to active sentences by identifying the subject and changing the verb form.
The document summarizes sections from Chapter 19 of Magruder's American Government textbook about civil liberties protections in the United States Constitution. It discusses the rights to freedom of religion, speech, press, assembly, and petition as protected by the First Amendment, and how the Supreme Court has interpreted and placed limits on these rights over time. It also examines how principles of limited government and federalism have impacted civil liberties.
The document discusses checks and balances in the US government. It outlines the checks that each branch of government (Congress, the presidency, and the judiciary) has on the others, such as congressional oversight of the presidency and judicial review. Potential threats to checks and balances are also examined, like executive orders and signing statements. Finally, it notes that the US has a stronger system of checks and balances than the UK to limit government power.
Federalism divides power between the national and state governments in order to limit the power of government. The national government has enumerated powers listed in the Constitution like regulating interstate commerce, while states have reserve powers like regulating intrastate commerce. This system aims to promote political participation, innovation, and diversity while avoiding concentrated power. However, it can also lead to complexity, inequity between states, and conflicts between levels of government.
This chapter introduces key concepts in the study of American government such as who governs, the purpose of government, and different theories of government. It defines political power, authority, and legitimacy. It also outlines different forms of democracy like direct and representative democracy and discusses the Framers' view of balancing popular views with limiting majority abuse of power. Finally, it summarizes theories of government like Marxism, elitism, bureaucratic, and pluralist theories.
The United States becomes involved in the Vietnam War to stop the spread of communism in Southeast Asia. Over time, the war becomes increasingly unpopular and divisive in the US as it drags on without clear progress. Protests and opposition to the war intensify during the 1960s. Finally, in the early 1970s, President Nixon begins withdrawing US troops from Vietnam as part of his Vietnamization policy. The last US troops depart in 1973 after over a decade of involvement, leaving South Vietnam to fight on its own.
This document is from an American history textbook and outlines several lessons on key issues facing the United States in the 21st century, including national security, foreign policy, poverty, and the environment. It introduces topics like terrorism, surveillance, globalization, and climate change. Each lesson contains subsections that provide more details on related policies, events, debates, and challenges. The overall document serves as a guide for students to learn about significant domestic and international concerns confronting America today.
Germany invades neighboring countries and launches the Holocaust, systematically killing millions of Jews and others. The United States remains neutral at first but begins providing military and economic aid to Britain and other Allied nations. In 1941, Japan attacks the US naval base at Pearl Harbor, bringing America fully into World War II against Germany, Italy and Japan.
The Cold War defined international affairs after World War 2, especially following the Korean War. The document outlines 6 lessons on the Cold War: 1) The Origins of the Cold War as the US and USSR emerged as superpowers with opposing political/economic systems; 2) The Cold War Heats Up as China became communist and Korea was divided; 3) The Cold War at Home and McCarthyism led to accusations against innocent US citizens; 4) Two Nations Live on the Edge as the nuclear arms race and brinksmanship brought the two countries to the edge of war; 5) Mounting Tensions in the Sixties led to further conflicts; and 6) The End of the Cold War in the late 1980s.
The document summarizes key events and policies during the Kennedy and Johnson administrations from the 1960s. It discusses Kennedy's New Frontier agenda which aimed to address social issues and confront the Soviet Union, but was cut short by his 1963 assassination. It then outlines Lyndon Johnson's Great Society programs that aimed to eliminate poverty and racial injustice through major civil rights laws and social welfare programs. However, Johnson also greatly escalated US involvement in the Vietnam War during this period of significant social change and cultural upheaval in America.
Activism and new civil rights legislation in the 1950s and 1960s advanced equal rights for African Americans. However, disagreements arose among civil rights groups about strategies and priorities, leading to a more violent period. Court decisions and laws banned segregation and expanded voting rights, but resistance remained strong in some areas.
The document summarizes key aspects of US national security policymaking, including foreign policy instruments like the military, economics, and diplomacy. It outlines actors involved in foreign relations such as international organizations, regional groups, companies, NGOs, and individuals. It describes policymakers like the President, diplomats, national security establishment, and Congress. It provides an overview of periods in US foreign policy history from isolationism to the present War on Terror. It also briefly mentions military policy areas.
Leveraging Generative AI to Drive Nonprofit InnovationTechSoup
In this webinar, participants learned how to utilize Generative AI to streamline operations and elevate member engagement. Amazon Web Service experts provided a customer specific use cases and dived into low/no-code tools that are quick and easy to deploy through Amazon Web Service (AWS.)
Beyond Degrees - Empowering the Workforce in the Context of Skills-First.pptxEduSkills OECD
Iván Bornacelly, Policy Analyst at the OECD Centre for Skills, OECD, presents at the webinar 'Tackling job market gaps with a skills-first approach' on 12 June 2024
Gender and Mental Health - Counselling and Family Therapy Applications and In...PsychoTech Services
A proprietary approach developed by bringing together the best of learning theories from Psychology, design principles from the world of visualization, and pedagogical methods from over a decade of training experience, that enables you to: Learn better, faster!
Temple of Asclepius in Thrace. Excavation resultsKrassimira Luka
The temple and the sanctuary around were dedicated to Asklepios Zmidrenus. This name has been known since 1875 when an inscription dedicated to him was discovered in Rome. The inscription is dated in 227 AD and was left by soldiers originating from the city of Philippopolis (modern Plovdiv).
ISO/IEC 27001, ISO/IEC 42001, and GDPR: Best Practices for Implementation and...PECB
Denis is a dynamic and results-driven Chief Information Officer (CIO) with a distinguished career spanning information systems analysis and technical project management. With a proven track record of spearheading the design and delivery of cutting-edge Information Management solutions, he has consistently elevated business operations, streamlined reporting functions, and maximized process efficiency.
Certified as an ISO/IEC 27001: Information Security Management Systems (ISMS) Lead Implementer, Data Protection Officer, and Cyber Risks Analyst, Denis brings a heightened focus on data security, privacy, and cyber resilience to every endeavor.
His expertise extends across a diverse spectrum of reporting, database, and web development applications, underpinned by an exceptional grasp of data storage and virtualization technologies. His proficiency in application testing, database administration, and data cleansing ensures seamless execution of complex projects.
What sets Denis apart is his comprehensive understanding of Business and Systems Analysis technologies, honed through involvement in all phases of the Software Development Lifecycle (SDLC). From meticulous requirements gathering to precise analysis, innovative design, rigorous development, thorough testing, and successful implementation, he has consistently delivered exceptional results.
Throughout his career, he has taken on multifaceted roles, from leading technical project management teams to owning solutions that drive operational excellence. His conscientious and proactive approach is unwavering, whether he is working independently or collaboratively within a team. His ability to connect with colleagues on a personal level underscores his commitment to fostering a harmonious and productive workplace environment.
Date: May 29, 2024
Tags: Information Security, ISO/IEC 27001, ISO/IEC 42001, Artificial Intelligence, GDPR
-------------------------------------------------------------------------------
Find out more about ISO training and certification services
Training: ISO/IEC 27001 Information Security Management System - EN | PECB
ISO/IEC 42001 Artificial Intelligence Management System - EN | PECB
General Data Protection Regulation (GDPR) - Training Courses - EN | PECB
Webinars: https://pecb.com/webinars
Article: https://pecb.com/article
-------------------------------------------------------------------------------
For more information about PECB:
Website: https://pecb.com/
LinkedIn: https://www.linkedin.com/company/pecb/
Facebook: https://www.facebook.com/PECBInternational/
Slideshare: http://www.slideshare.net/PECBCERTIFICATION
RHEOLOGY Physical pharmaceutics-II notes for B.pharm 4th sem students
S1 pb
1. CORRELATION ANALYSIS
Concept and Importance of Correlation
We may come across certain series wherein there may be more than one variable. A distribution
in which each variable assumes two values is called a Bivariate Distribution. If we measure more
than two variables on each unit of a distribution, it is called Multivariate Distribution. In a
bivariate distribution, we may be interested to find if there is any relationship between the two
variables under study. The Correlation is a statistical tool which studies the relationship between
two variables and the correlation analysis involves various methods and techniques used for
studying and measuring the extent of the relationship between the two variables. Correlation
analysis is used as a statistical tool to ascertain the association between two variables.
“When the relationship is of a quantitative nature, the appropriate statistical tool for discovering
& measuring the relationship and expressing it in a brief formula is known as correlation.”
- Croxton & Cowden
“Correlation is an analysis of the covariation between two or more variables.”
- A. M. Tuttle
“Correlation Analysis contributes to the understanding of economic behaviour, aids in locating
the critically important variables on which others depend, may reveal to the economist the
connections by which disturbances spread and suggest to him the paths through which
stabilizing forces may become effective.”
-W. A. Neiswanger
“The effect of correlation is to relation is to reduce the range of uncertainty of our prediction.”
- Tippett
The problem in analyzing the association between two variables can be broken down into three
steps.
o We try to know whether the two variables are related or independent of each other.
2. o If we find that there is a relationship between the two variables, we try to know its nature
and strength. This means whether these variables have a positive or a negative
relationship and how close that relationship is.
o We may like to know if there is a causal relationship between them. This means that the
variation in one variable causes variation in another.
When data regarding two or more variables are available, we may study the related variation of
these variables. For e.g. in a data regarding heights (x) and weights (y) of students of a college,
we find that those students who have greater height would have greater weight. Also, students
who have lesser height would have lesser weight. This type of related variation among variables
is called correlation. Correlation may be (i) Simple correlation (ii) Multiple correlation (iii)
Partial correlation.
Simple correlation concerns with related variation among two variables. Multiple correlation and
partial correlation concern with related variation among three or more variables.
Two variables are said to be correlated when they vary such that
a. The higher values of one variable correspond to the higher values of the other and the
lower values of the variable correspond to the lower values of the other. or
b. The higher values of one variable correspond to the lower values of the other.
Generally, it can be seen that those who are tall will have greater weight, and those who are short
will have lesser weight. Thus height (x) and weight (y) of persons show related variation. And so
they are correlated. On the other hand production (x) and price (y) of vegetables show variation
in opposite directions. Here the higher the production the lower would be the price.
In both the above examples, the variables x and y show related variation. And so they are
correlated.
TYPES OF CORRELATION
Correlation is positive (direct) if the variables vary in the same directions, that is, if they increase
and decrease together.
3. Height (x) and weight (y) of persons are positively correlated.
Correlation is negative (inverse) if the variables vary in the opposite directions, that is, if one
variable increases the other variable decreases. Production (x) and price (y) of vegetables are
negatively correlated.
If variables do not show related variation, they are said to be non – correlated. If variables show
exact linear relationship, they are said to be perfectly correlated. Perfect correlation may be
positive or negative.
Correlation and Causation
o The correlation may be due to chance particularly when the data pertain to a small
sample.
o It is possible that both the variables are influenced by one or more other variables.
o There may be another situation where both the variables may be influencing each other so
that we cannot say which is the cause and which is the effect.
Types of Correlation
o Positive and Negative: If the values of the two variables deviate in the same direction
i.e., if the increase in the values of one variable results, on an average, in a corresponding
increase in the values of the other variable or if a decrease in the values of one variable
results, on an average, in a corresponding decrease in the values of the other variable,
correlation is said to be positive or direct. For example: Price & Supply of the
commodity. On the other hand, correlation is said to be negative or inverse if the
variables deviate in the opposite direction i.e., if the increase (decrease) in the values of
one variable results, on the average, in a corresponding decrease (increase) in the values
of the other variable. For example: Temperature and Sale of Woolen Garments.
o Linear and Non-Linear: The correlation between two variables is said to be linear if
corresponding to a unit change in one variable, there is a constant change in the other
variable over the entire range of the values. For example: y = ax + b. The relationship
between two variables is said to be non-linear or curvilinear if corresponding to a unit
4. change in one variable, the other variable does not change at a constant rate but at a
fluctuating rate. When this is plotted in the graph this will not be a straight line.
o Simple, Partial and Multiple: The distinction amongst these three types of correlation
depends upon the number of variables involved in a study. If only two variables are
involved in a study, then the correlation is said to be simple correlation. When three or
more variables are involved in a study, then it is a problem of either partial or multiple
correlation. In multiple correlation, three or more variables are studied simultaneously.
But in partial correlation we consider only two variables influencing each other while
the effect of other variable is held constant. For example: Let us suppose that we have
three variables, number of hours studied (x); IQ (y); marks obtained (z). In a multiple
correlation we will study the correlation between z with 2 variables x & y. In contrast,
when we study the relationship between x & z, keeping an average IQ as constant, it is
said to be a study involving partial correlation.
Methods of Correlation
METHODS OF CORRELATION
GRAPHIC ALGEBRAIC
SCATTER
DIAGRAM CONCURRENT
Process of Calculating Coefficient of Correlation
o Calculate the means of the two series: X and Y.
o Take deviations in the two series from their respective means, indicated as x and y. The
deviation should be taken in each case as the value of the individual item minus (–) the
arithmetic mean.
o Square the deviations in both the series and obtain the sum of the deviation-squared
columns. This would give Σx2 and Σy2.
DEVIATION
METHOD
RANK
CORRELATION
COVARIENCE
METHOD
5. o Take the product of the deviations, that is, Σxy. This means individual deviations are to
be multiplied by the corresponding deviations in the other series and then their sum is
obtained.
o The values thus obtained in the preceding steps Σxy, Σx2 and Σy2 are to be used in the
formula for correlation.
SCATTER DIAGRAM METHOD
Scatter diagram is a graphic presentation of bivariate data. Here, bivariate data with n pairs of
values is represented by n points on the xy – plane. The two variables are taken along the two
axes, and every pair of values in the data is represented by a point on the graph.
The pattern of distribution of points on the graph can be made use of for the rough estimation of
degree of correlation between the variables.
In the scatter diagram –
a. If the points form a line with positive sloe (a line moving upwards), the variables are
positively and perfectly correlated.
b. If the points form a line with negative slope (a line moving downwards), the variables are
negatively and perfectly correlated.
c. If the points cluster around a line with positive slope the variables are positively
correlated.
d. If the points cluster around a line with negative slope, the variables are negatively
correlated.
e. If the points are spread all over the graph, the variables are non correlated.
f. Any other curve – form of spread of points indicates curvilinear relation between the
variables.
Scatter diagram is one of the simplest ways of diagrammatic representation of a bivariate
distribution and provides us one of the simplest tools of ascertaining the correlation between two
variables. Suppose we are given n pairs of values of two variables X and Y. For example, if the
variables X and Y denote the height and weight respectively, then the pairs my represent the
6. heights and weights (in pairs) of n individuals. These n points may be plotted as dots (.) on the x
– axis and y – axis in the xy – plane. (It is customary to take the dependent variable along the x –
axis.) the diagram of dots so obtained is known as scatter diagram. From the scatter diagram we
can form a fairly good, though rough idea about the relationship between the two variables. The
following points may be borne in mind in interpreting the scatter diagram regarding the
correlation between the two variables:
1. If the points are very dense i.e very close to each other, a fairly good amount of
correlation may be expected between the two variables. On the other hand, if the points
are widely scattered, a poor correlation may be expected between them.
2. If the points on the scatter diagram reveal any trend (either upward or downward), the
variables are said to be correlated and if no trend is revealed, the variables are
uncorrelated.
3. If there is an upward trend rising from lower left hand corner and going upward to the
upper right hand corner , the correlation is positive since this reveals that the values of
the two variables are move in the same direction. If, on the other hand the points depict a
downward trend from the upper left hand corner, the correlation is negative since in this
case the values of the two variables move in the opposite directions.
4. In particular , if all the points lie on a straight line starting from the left bottom and going
up towards the right top, the correlation is perfect and positive , and if all the points lie on
a straight line starting from the left top and coming down to right bottom , the correlation
is perfect and negative.
5. The method of scatter diagram is readily comprehensible and enables us to form a rough
idea of the nature of the relationship between the two variables merely by inspection of
the graph. Moreover, this method is not affected by extreme observation whereas all
mathematical formulae of ascertaining correlation between two variables are affected by
extreme observations. However, this method is not suitable if the number of observations
is fairly large.
6. The method of scatter diagram tells us about the nature of the relationship whether it is
positive or negative and whether it is high or low. It does not provide us exact measure of
the extent of the relationship between the two variables.
7. 7. The scatter diagram enables us to obtain an approximate estimating line or line of best fit
by free hand method. The method generally consists in stretching a piece of thread
through the plotted points to locate the best possible line.
KARL PEARSON’S COEFFICIENT OF CORRELATION (COVARIENCE METHOD;
PRODUCT MOMENT)
This is a measure of linear relationship between the two variables. It indicates the degree of
correlation between the two variables. It is denoted by ‘r’.
INTERPRETATION OF COEFFICIENT OF CORRELATION
a. A positive value of r indicates positive correlation
b. A negative value of r indicates negative correlation
c. r = +1 means, correlation is perfect positive.
d. r = -1 means, correlation is perfect negative.
e. r = 0 (or low) means, the variables are non – correlated.
Karl Pearson’s measure known as Pearsonian correlation co efficient between two variables (
series) X and Y , usually donated by r , is a numerical measure of linear relationship between
them and is defined as the ratio of the covariance between X and Y , written as Cov (x, y) to the
product of standard deviation of X and Y .
Assumptions of the Karl Pearson’s Correlation
o The two variables X and Y are linearly related.
o The two variables are affected by several causes, which are independent, so as to form a
normal distribution.
Coefficient of Determination
The strength of r is judged by coefficient of determination, r2 for r = 0.9, r2 = 0.81. We multiply
it by 100, thus getting 81 per cent. This suggests that when r is 0.9 then we can say that 81 per
cent of the total variation in the Y series can be attributed to the relationship with X.
8. Rank Correlation
Limitations of Spearman’s Method of Correlation
o Spearman’s r is a distribution-free or non parametric measure of correlation.
o As such, the result may not be as dependable as in the case of ordinary correlation where
the distribution is known.
o Another limitation of rank correlation is that it cannot be applied to a grouped frequency
distribution.
o When the number of observations is quite large and one has to assign ranks to the
observations in the two series, then such an exercise becomes rather tedious and time-consuming.
This becomes a major limitation of rank correlation.
Some Limitations of Correlation Analysis
o Correlation analysis cannot determine cause-and-effect relationship.
o Another mistake that occurs frequently is on account of misinterpretation of the
coefficient of correlation and the coefficient of determination.
o Another mistake in the interpretation of the coefficient of correlation occurs when one
concludes a positive or negative relationship even though the two variables are actually
unrelated.