Online Classroom Rules:
Finda quiet place free of distractions (TV, parents, toys, pets,
siblings, etc.).
Show up in time for class and wait to be admitted into it if
needed.
Be respectful at all times when your video is on. No
inappropriate language or hand gestures.
Stay on mute. Click the “raise hand” button if you have a
question or something to share.
• Stay on task and focused so you don’t miss anything the
speaker says.
Learning objective
a. identifythe types of correlation
(Positive,Negative,Zero);
b. understand the different types of correlation;
c. Demonstrate calculating the correlation
coefficient and plotting data to identify the
correlation type.
At the end of the lesson the students shall be
able to;
• There aretwo ways of describing
the relationships of the scores of
the students in two or more
subjects: using the correlation
coefficient and the graphical
representation of the scores in the
distribution.
30.
Correlation-refers to theextent to which the
distributions are linearly related or associated
between the two variables. The extent of
correlation is indicated numerically by the
coefficient of correlation or ®. The correlation
coefficient ® is also known as the Pearson
Product-Moment Correlation Coefficient in
honor of Karl Pearson who developed the said
formula. The correlation coefficient ranges
from 1 to +1.
31.
• There arethree kinds of correlation based
on correlation coefficient: (1) positive
correlation; (2) negative correlation; and (3)
zero correlation. There are two ways of
identifying the correlation between the two
variables: (1) using the formula; and (2)
using the scatter plot or scatter gram.
32.
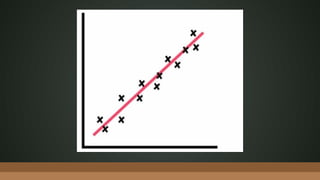
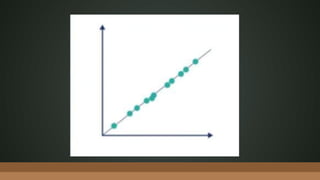
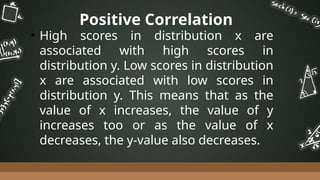
Positive Correlation
• Highscores in distribution x are
associated with high scores in
distribution y. Low scores in distribution
x are associated with low scores in
distribution y. This means that as the
value of x increases, the value of y
increases too or as the value of x
decreases, the y-value also decreases.
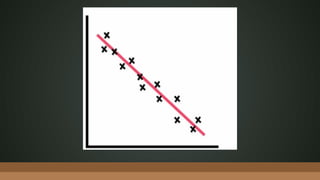
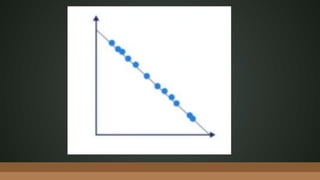
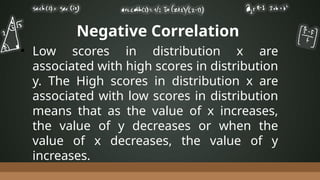
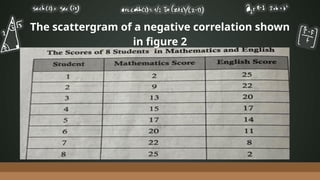
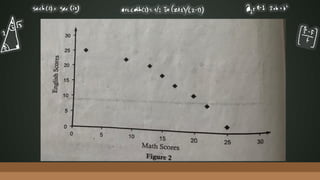
Negative Correlation
• Lowscores in distribution x are
associated with high scores in distribution
y. The High scores in distribution x are
associated with low scores in distribution
means that as the value of x increases,
the value of y decreases or when the
value of x decreases, the value of y
increases.
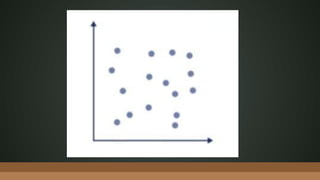
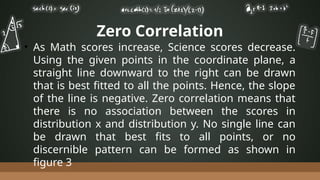
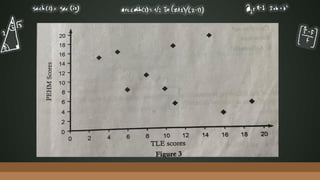
Zero Correlation
• AsMath scores increase, Science scores decrease.
Using the given points in the coordinate plane, a
straight line downward to the right can be drawn
that is best fitted to all the points. Hence, the slope
of the line is negative. Zero correlation means that
there is no association between the scores in
distribution x and distribution y. No single line can
be drawn that best fits to all points, or no
discernible pattern can be formed as shown in
figure 3
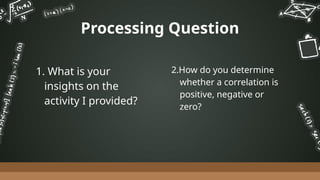
41.
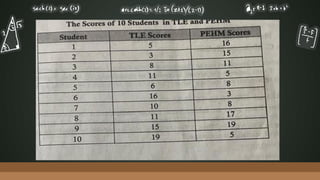
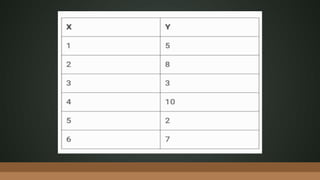
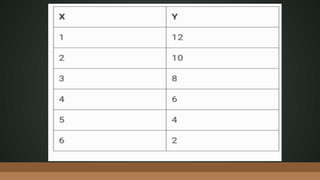
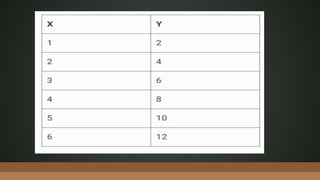
Activity
Instructions: Solve thegiven
numerical data, create a scatterplot,
and determine whether the
correlation is positive, negative, or
zero.


![Correlation analysis[1]](https://cdn.slidesharecdn.com/ss_thumbnails/correlationanalysis1-210225123614-thumbnail.jpg?width=640&height=640&fit=bounds)


![Polymer [ बहुलक ] Chemistry Notes PDF - Irfanullah Mehar - JJ Sir Chemistry.pdf](https://cdn.slidesharecdn.com/ss_thumbnails/polymerchemistrynotespdf-irfanullahmehar-jjsirchemistry-260210172118-3f9b37f7-thumbnail.jpg?width=640&height=640&fit=bounds)


