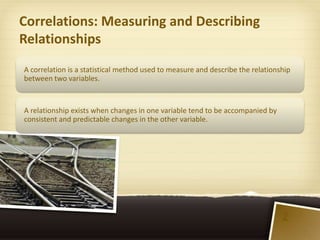
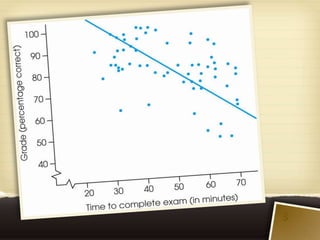
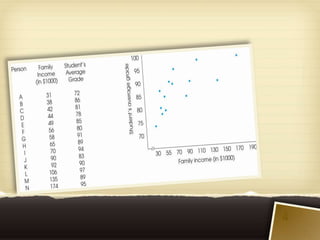
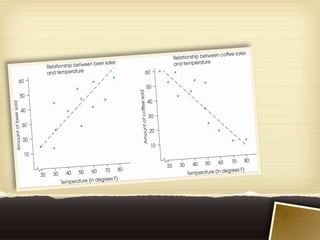
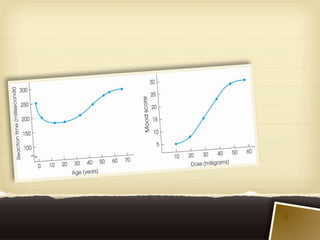
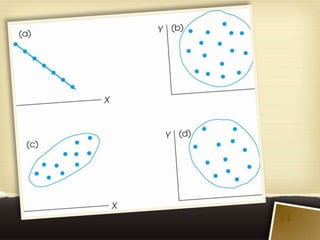
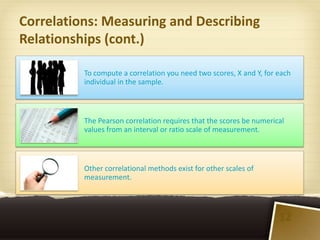
Chapter 16: Correlation
Correlations: Measuring and Describing
Relationships
A correlation is a statistical method used to measure and describe the relationship
between two variables.


A relationship exists when changes in one variable tend to be accompanied by
consistent and predictable changes in the other variable.


                                                                                2
3
4
Correlations: Measuring and Describing
Relationships (cont.)

    A correlation typically
  evaluates three aspects of
       the relationship:
• the direction
• the form
• the degree

                                         5
Correlations: Measuring and Describing
Relationships (cont.)
  The direction of the relationship is measured
 by the sign of the correlation (+ or -). A
 positive correlation means that the two
 variables tend to change in the same
 direction; as one increases, the other also
 tends to increase. A negative correlation
 means that the two variables tend to change
 in opposite directions; as one increases, the
 other tends to decrease.

                                                  6
7
Correlations: Measuring and Describing
Relationships (cont.)
  The most common form of
 relationship is a straight line or linear
 relationship which is measured by the
 Pearson correlation.


                                             8
9
Correlations: Measuring and Describing
Relationships (cont.)
  The degree of relationship (the
 strength or consistency of the
 relationship) is measured by the
 numerical value of the correlation. A
 value of 1.00 indicates a perfect
 relationship and a value of zero
 indicates no relationship.


                                         10
11
Correlations: Measuring and Describing
Relationships (cont.)

          To compute a correlation you need two scores, X and Y, for each
          individual in the sample.


          The Pearson correlation requires that the scores be numerical
          values from an interval or ratio scale of measurement.


          Other correlational methods exist for other scales of
          measurement.


                                                                     12
The Pearson Correlation
The Pearson correlation measures the direction and
degree of linear (straight line) relationship between two
variables.

To compute the Pearson correlation, you first measure
the variability of X and Y scores separately by computing
SS for the scores of each variable (SSX and SSY).

Then, the covariability (tendency for X and Y to vary
together) is measured by the sum of products (SP).


The Pearson correlation is found by computing the
ratio, SP/ (SSX)(SSY) .


                                                            13
The Pearson Correlation
(cont.)
Thus the Pearson correlation is comparing the amount
of covariability (variation from the relationship between
X and Y) to the amount X and Y vary separately.


The magnitude of the Pearson correlation ranges from
0 (indicating no linear relationship between X and Y) to
1.00 (indicating a perfect straight-line relationship
between X and Y).


The correlation can be either positive or negative
depending on the direction of the relationship.


                                                            14
15
The Spearman Correlation
  The Spearman correlation is used in two general
 situations:
 (1) It measures the relationship between two ordinal
 variables; that is, X and Y both consist of ranks.
 (2) It measures the consistency of direction of the
 relationship between two variables. In this case, the
 two variables must be converted to ranks before the
 Spearman correlation is computed.


                                                   16
The Spearman Correlation (cont.)
The calculation of the Spearman correlation requires:
1. Two variables are observed for each individual.
2. The observations for each variable are rank ordered. Note that
   the X values and the Y values are ranked separately.
3. After the variables have been ranked, the Spearman correlation
   is computed by either:
a. Using the Pearson formula with the ranked data.
b. Using the special Spearman formula (assuming        there are
   few, if any, tied ranks).


                                                            17
18
The Point-Biserial Correlation and the Phi
Coefficient

           The Pearson correlation formula can also be used to measure
           the relationship between two variables when one or both of
           the variables is dichotomous.


           A dichotomous variable is one for which there are exactly two
           categories: for example, men/women or succeed/fail.


                                                                    19
The Point-Biserial Correlation and the Phi
Coefficient (cont.)
With either one or two dichotomous variables the
   calculation of the correlation precedes as
   follows:
1. Assign numerical values to the two categories of
   the dichotomous variable(s). Traditionally, one
   category is assigned a value of 0 and the other
   is assigned a value of 1.
2. Use the regular Pearson correlation formula to
   calculate the correlation.


                                                      20
The Point-Biserial Correlation and the Phi
Coefficient (cont.)


 In situations where one variable is     When both variables are
 dichotomous and the other               dichotomous, the resulting
 consists of regular numerical           correlation is called a phi-
 scores (interval or ratio scale), the   coefficient.
 resulting correlation is called a
 point-biserial correlation.


                                                                        21
The Point-Biserial Correlation and the Phi
Coefficient (cont.)

          The point-biserial correlation is closely related to the
          independent-measures t test introduced in Chapter 10.


          When the data consists of one dichotomous variable and one
          numerical variable, the dichotomous variable can also be used to
          separate the individuals into two groups.


          Then, it is possible to compute a sample mean for the numerical
          scores in each group.


                                                                     22
The Point-Biserial Correlation and the Phi
Coefficient (cont.)
  In this case, the independent-measures t
 test can be used to evaluate the mean
 difference between groups.
  If the effect size for the mean difference is
 measured by computing r2 (the percentage
 of variance explained), the value of r2 will
 be equal to the value obtained by squaring
 the point-biserial correlation.


                                                  23
24

Chapter 16: Correlation (enhanced by VisualBee)

  • 1.
  • 2.
    Correlations: Measuring andDescribing Relationships A correlation is a statistical method used to measure and describe the relationship between two variables. A relationship exists when changes in one variable tend to be accompanied by consistent and predictable changes in the other variable. 2
  • 3.
  • 4.
  • 5.
    Correlations: Measuring andDescribing Relationships (cont.) A correlation typically evaluates three aspects of the relationship: • the direction • the form • the degree 5
  • 6.
    Correlations: Measuring andDescribing Relationships (cont.) The direction of the relationship is measured by the sign of the correlation (+ or -). A positive correlation means that the two variables tend to change in the same direction; as one increases, the other also tends to increase. A negative correlation means that the two variables tend to change in opposite directions; as one increases, the other tends to decrease. 6
  • 7.
  • 8.
    Correlations: Measuring andDescribing Relationships (cont.) The most common form of relationship is a straight line or linear relationship which is measured by the Pearson correlation. 8
  • 9.
  • 10.
    Correlations: Measuring andDescribing Relationships (cont.) The degree of relationship (the strength or consistency of the relationship) is measured by the numerical value of the correlation. A value of 1.00 indicates a perfect relationship and a value of zero indicates no relationship. 10
  • 11.
  • 12.
    Correlations: Measuring andDescribing Relationships (cont.) To compute a correlation you need two scores, X and Y, for each individual in the sample. The Pearson correlation requires that the scores be numerical values from an interval or ratio scale of measurement. Other correlational methods exist for other scales of measurement. 12
  • 13.
    The Pearson Correlation ThePearson correlation measures the direction and degree of linear (straight line) relationship between two variables. To compute the Pearson correlation, you first measure the variability of X and Y scores separately by computing SS for the scores of each variable (SSX and SSY). Then, the covariability (tendency for X and Y to vary together) is measured by the sum of products (SP). The Pearson correlation is found by computing the ratio, SP/ (SSX)(SSY) . 13
  • 14.
    The Pearson Correlation (cont.) Thusthe Pearson correlation is comparing the amount of covariability (variation from the relationship between X and Y) to the amount X and Y vary separately. The magnitude of the Pearson correlation ranges from 0 (indicating no linear relationship between X and Y) to 1.00 (indicating a perfect straight-line relationship between X and Y). The correlation can be either positive or negative depending on the direction of the relationship. 14
  • 15.
  • 16.
    The Spearman Correlation The Spearman correlation is used in two general situations: (1) It measures the relationship between two ordinal variables; that is, X and Y both consist of ranks. (2) It measures the consistency of direction of the relationship between two variables. In this case, the two variables must be converted to ranks before the Spearman correlation is computed. 16
  • 17.
    The Spearman Correlation(cont.) The calculation of the Spearman correlation requires: 1. Two variables are observed for each individual. 2. The observations for each variable are rank ordered. Note that the X values and the Y values are ranked separately. 3. After the variables have been ranked, the Spearman correlation is computed by either: a. Using the Pearson formula with the ranked data. b. Using the special Spearman formula (assuming there are few, if any, tied ranks). 17
  • 18.
  • 19.
    The Point-Biserial Correlationand the Phi Coefficient The Pearson correlation formula can also be used to measure the relationship between two variables when one or both of the variables is dichotomous. A dichotomous variable is one for which there are exactly two categories: for example, men/women or succeed/fail. 19
  • 20.
    The Point-Biserial Correlationand the Phi Coefficient (cont.) With either one or two dichotomous variables the calculation of the correlation precedes as follows: 1. Assign numerical values to the two categories of the dichotomous variable(s). Traditionally, one category is assigned a value of 0 and the other is assigned a value of 1. 2. Use the regular Pearson correlation formula to calculate the correlation. 20
  • 21.
    The Point-Biserial Correlationand the Phi Coefficient (cont.) In situations where one variable is When both variables are dichotomous and the other dichotomous, the resulting consists of regular numerical correlation is called a phi- scores (interval or ratio scale), the coefficient. resulting correlation is called a point-biserial correlation. 21
  • 22.
    The Point-Biserial Correlationand the Phi Coefficient (cont.) The point-biserial correlation is closely related to the independent-measures t test introduced in Chapter 10. When the data consists of one dichotomous variable and one numerical variable, the dichotomous variable can also be used to separate the individuals into two groups. Then, it is possible to compute a sample mean for the numerical scores in each group. 22
  • 23.
    The Point-Biserial Correlationand the Phi Coefficient (cont.) In this case, the independent-measures t test can be used to evaluate the mean difference between groups. If the effect size for the mean difference is measured by computing r2 (the percentage of variance explained), the value of r2 will be equal to the value obtained by squaring the point-biserial correlation. 23
  • 24.

Editor's Notes

  • #4 Figure 16.1The relationship between exam grade and time needed to complete the exam. Notice the general trend in these data: Students who finish the exam early tend to have better grades.
  • #5 Figure 16.2Correlational data showing the relationship between family income (X) and student grades (Y) for a sample of n = 14 high school students. The scores are listed in order from lowest to highest family income and are shown in a scatter plot.
  • #8 Figure 16.3Examples of positive and negative relationships. (a) Beer sales are positively related to temperature. (b) Coffee sales are negatively related to temperature.
  • #10 Figure 16.4Examples of relationships that are not linear: (a) relationship between reaction time and age; (b) relationship between mood and drug dose.
  • #12 Figure 16.5Examples of different values for linear correlations: (a) a perfect negative correlation, −1.00; (b) no linear trend, 0.00; (c) a strong positive relationship, approximately +0.90; (d) a relatively weak negative correlation, approximately −0.40.
  • #16 Figure 16.8In this example, the full range of X and Y values shows a strong, positive correlation, but the restricted range of scores produces a correlation near zero.
  • #19 Figure 16.3Examples of positive and negative relationships. (a) Beer sales are positively related to temperature. (b) Coffee sales are negatively related to temperature.