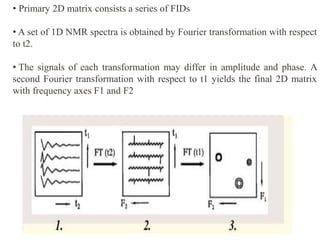
1D AND 2D NMR
Prepared By
MAHENDRA G S
Pharmaceutical Chemistry
JSSCP,Mysuru.
OBJECTIVES
1-D NMR
1. Principle
2. Sequence Scheme
3. Name Proposed
2-D NMR
1.Principle
2.Sequence Scheme
3.Name proposed
4.Why 2D NMR Types
1-D NMR
1. Simple FT-NMR Technique
2. 1-D NMR spectroscopy is simple technique In which we provide 90 degree pulse to sample
which is placed in uniform magnetic field. As a result we get a FID signal (raw form). To get
meaningful data we apply Fourier Transform program on FID to get desire signal.
3. Data in form of frequency vs intensity is plotted along x-axis and y-axis respectively
Sequence Scheme
If we divide the 1-D NMR into a general periods , we get two steps
•Preparation: (do something with nuclei)
1.What we can do ???
•Simply we provide a 90 degree pulse
2.Detection: ( detect the signal)
.Simply we measure the signal
Why Named 1-D NMR ??
• We call it 1-D NMR , not because of graph. Graph is actually in 2-d.
• Since one of the time domain is changing into frequency dimension
Thats why we call it 1D NMR .
• The first two-dimensional experiment was proposed by
Jean Jenner
. • 2D NMR is a set of nuclear magnetic resonance
spectroscopy (NMR) methods which give data plotted in a
space defined by two frequency axes rather than one.
• 2D NMR spectra provide more information about a
molecule than one-dimensional NMR spectra
2-D NMR
Principle :
 2D NMR is Nuclear magnetic resonance spectroscopy in which we
provide a 90 degree pulse to our sample which is placed in uniform
magnetic field then we wait for (0ms-5ms) depending upon the experiment
type then again we provide again 90 degree pulse and this time we measure
signal as FID.
 As a result we get Two FID signals which are plotted with respect to time
domain.
To get a meaningful data , we apply Fourier transform program on FIDs to
get frequency in terms of ppm.
• Primary 2D matrix consists a series of FIDs
• A set of 1D NMR spectra is obtained by Fourier transformation with respect
to t2.
• The signals of each transformation may differ in amplitude and phase. A
second Fourier transformation with respect to t1 yields the final 2D matrix
with frequency axes F1 and F2
REFERENCES
INSTRUMETAL ANALYSIS- CHATWAL
ORGANIC SPECTROSCOPY-WILLAM KEMP
THANK YOU

2d NMR

  • 1.
    1D AND 2DNMR Prepared By MAHENDRA G S Pharmaceutical Chemistry JSSCP,Mysuru.
  • 2.
    OBJECTIVES 1-D NMR 1. Principle 2.Sequence Scheme 3. Name Proposed 2-D NMR 1.Principle 2.Sequence Scheme 3.Name proposed 4.Why 2D NMR Types
  • 3.
    1-D NMR 1. SimpleFT-NMR Technique 2. 1-D NMR spectroscopy is simple technique In which we provide 90 degree pulse to sample which is placed in uniform magnetic field. As a result we get a FID signal (raw form). To get meaningful data we apply Fourier Transform program on FID to get desire signal. 3. Data in form of frequency vs intensity is plotted along x-axis and y-axis respectively
  • 4.
    Sequence Scheme If wedivide the 1-D NMR into a general periods , we get two steps •Preparation: (do something with nuclei) 1.What we can do ??? •Simply we provide a 90 degree pulse 2.Detection: ( detect the signal) .Simply we measure the signal
  • 5.
    Why Named 1-DNMR ?? • We call it 1-D NMR , not because of graph. Graph is actually in 2-d. • Since one of the time domain is changing into frequency dimension Thats why we call it 1D NMR .
  • 7.
    • The firsttwo-dimensional experiment was proposed by Jean Jenner . • 2D NMR is a set of nuclear magnetic resonance spectroscopy (NMR) methods which give data plotted in a space defined by two frequency axes rather than one. • 2D NMR spectra provide more information about a molecule than one-dimensional NMR spectra 2-D NMR
  • 8.
    Principle :  2DNMR is Nuclear magnetic resonance spectroscopy in which we provide a 90 degree pulse to our sample which is placed in uniform magnetic field then we wait for (0ms-5ms) depending upon the experiment type then again we provide again 90 degree pulse and this time we measure signal as FID.  As a result we get Two FID signals which are plotted with respect to time domain. To get a meaningful data , we apply Fourier transform program on FIDs to get frequency in terms of ppm.
  • 9.
    • Primary 2Dmatrix consists a series of FIDs • A set of 1D NMR spectra is obtained by Fourier transformation with respect to t2. • The signals of each transformation may differ in amplitude and phase. A second Fourier transformation with respect to t1 yields the final 2D matrix with frequency axes F1 and F2
  • 17.
  • 18.