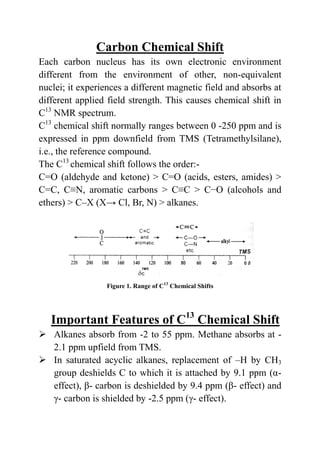
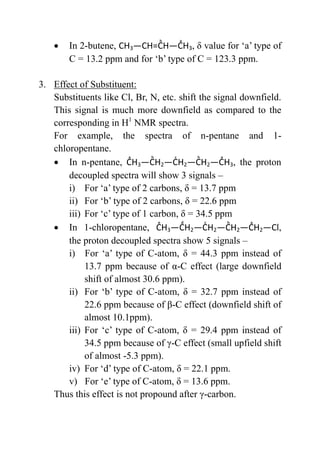
C13
NMR Spectroscopy
Introduction
Carbon-13 Nuclear Magnetic Resonance Spectroscopy
Technique is based on the fact that the net nuclear spin for C13
isotope of carbon is half unlike C12
isotope for which it is zero
(thus C12
is non-magnetic and does not give any NMR signal).
Though C13
has a low natural abundance of only 1.11% and is
inherently less sensitive than H1
NMR (so in order to observe
the weak signals the spectra is scanned repeatedly), but it is
simpler to interpret.
Characteristics of C13
NMR Spectra
1. Since it is impossible that a particular C13
molecule will
have another C13
nucleus as an immediate neighbour, thus
splitting of C13
signal due to C13
―C13
coupling is
negligible and the signal is easy to interpret.
2. The proton decoupled C13
NMR spectrum gives single
unsplit peak for each magnetically non-equivalent carbon
thus providing direct information about the carbon
skeleton.
3. In C13
NMR, signals are spread over a chemical shift
range of 200 ppm as compared to H1
NMR for which the
range is only 15 ppm, and thus only fewer peaks overlap.
4. In proton coupled spectra, signal for each carbon is split
by number of H+
bonded directly to that carbon by (n+1)
rule, where ‘n’ is the number of H-atoms present on the
carbon.
Carbon Chemical Shift
Each carbon nucleus has its own electronic environment
different from the environment of other, non-equivalent
nuclei; it experiences a different magnetic field and absorbs at
different applied field strength. This causes chemical shift in
C13
NMR spectrum.
C13
chemical shift normally ranges between 0 -250 ppm and is
expressed in ppm downfield from TMS (Tetramethylsilane),
i.e., the reference compound.
The C13
chemical shift follows the order:-
C=O (aldehyde and ketone) > C=O (acids, esters, amides) >
C=C, C≡N, aromatic carbons > C≡C > C−O (alcohols and
ethers) > C–X (X→ Cl, Br, N) > alkanes.
Figure 1. Range of C13
Chemical Shifts
Important Features of C13
Chemical Shift
 Alkanes absorb from -2 to 55 ppm. Methane absorbs at -
2.1 ppm upfield from TMS.
 In saturated acyclic alkanes, replacement of –H by CH3
group deshields C to which it is attached by 9.1 ppm (α-
effect), β- carbon is deshielded by 9.4 ppm (β- effect) and
γ- carbon is shielded by -2.5 ppm (γ- effect).
 Increasing alkylation moves the carbon resonance
downfield.
 In functionalized alkanes, when a H is replaced by a
heteroatom like >C=O, deshielding effect is caused due to
such electronegative substituents and downfield shift
occurs.
 The value of chemical shift indicates the type of
hybridization. The signal for sp3
hybridized carbons occur
upfield in the range of -2 to 55 ppm. For sp2
hybridized
carbons (in alkenes and arenes), signals appear in the
region of 80 to 170 ppm downfield from TMS. The triply
bonded hybridized carbons (sp hybridization) absorb in
the region between sp3
and sp2
carbons, i.e., 65 to 90 ppm.
 Carbon of carbonyl group absorbs far downfield (almost
220 ppm). This is due to:-
i) sp2
hybridization
ii) The presence of electronegative O atom directly
bonded to the carbon.
Factors Affecting C13
Chemical Shift
1. Deshielding effect of electronegative moiety:
Presence of electronegative groups like >C=O, ―OH, etc.
brings about a downfield shift in the resonance at α and β
positions and a small upfield at γ position.
For example, the spectra of butane and 1-butanol.
 In butane, H3 2 2 3, the spectrum shows
2 signals –
i) For ‘a’ type of 2 carbons at 13.2 ppm.
ii) For ‘b’ type of 2 carbons at 25.0 ppm.
 In 1-butanol, 3 2 2 2 O , the spectrum
shows 4 signals –
i) For ‘a’ type carbon, δ = 61.7 ppm (high downfield
shift, α-effect).
ii) For ‘b’ type carbon, δ = 35.3 ppm (downfield
shift, β-effect).
iii) For ‘c’ type carbon, δ = 19.4 ppm (upfield shift, γ-
effect).
iv) For ‘d’ type carbon, δ = 13.9 ppm.
2. Effect of Hybridization:
The signal for sp3
hybridized carbons occur upfield in the
range of -2 to 55 ppm as compared to sp2
hybridization for
which the range is 110 to 170 ppm; while for sp
hybridized carbons the range is 65 to 90 ppm which is an
intermediate to sp3
and sp2
.
For example, the values chemical shifts for ethane, ethene
and ethyne. For all the three, the spectra shows only 1
signal –
i) For CH3 3, δ = 5.9 ppm
ii) For CH2=CH2, δ = 122.8 ppm
iii) For ≡ , δ = 71.9 ppm
It is generally found that terminal =CH2 group absorbs
upfield than an internal =CH― group.
For example, the spectra of 1-butene and 2-butene.
 In 1-butene, CH3 2 2, δ value for ‘a’ type
of C = 112.8 ppm and for ‘b’ type of C = 140.2 ppm.
 In 2-butene, CH3 3, δ value for ‘a’ type of
C = 13.2 ppm and for ‘b’ type of C = 123.3 ppm.
3. Effect of Substituent:
Substituents like Cl, Br, N, etc. shift the signal downfield.
This signal is much more downfield as compared to the
corresponding in H1
NMR spectra.
For example, the spectra of n-pentane and 1-
chloropentane.
 In n-pentane, 3 2 2 2 3, the proton
decoupled spectra will show 3 signals –
i) For ‘a’ type of 2 carbons, δ = 13.7 ppm
ii) For ‘b’ type of 2 carbons, δ = 22.6 ppm
iii) For ‘c’ type of 1 carbon, δ = 34.5 ppm
 In 1-chloropentane, 3 2 2 2 2 l,
the proton decoupled spectra show 5 signals –
i) For ‘a’ type of C-atom, δ = 44.3 ppm instead of
13.7 ppm because of α-C effect (large downfield
shift of almost 30.6 ppm).
ii) For ‘b’ type of C-atom, δ = 32.7 ppm instead of
22.6 ppm because of β-C effect (downfield shift of
almost 10.1ppm).
iii) For ‘c’ type of C-atom, δ = 29.4 ppm instead of
34.5 ppm because of γ-C effect (small upfield shift
of almost -5.3 ppm).
iv) For ‘d’ type of C-atom, δ = 22.1 ppm.
v) For ‘e’ type of C-atom, δ = 13.6 ppm.
Thus this effect is not propound after γ-carbon.
References
1. Spectroscopy; Kaur, H.
2. Spectroscopy of Organic Compounds; Kalsi, P.S.
3. Experiments and Techniques in Organic Chemistry; Pasto,
Daniel J., Johnson, Carl R. and Miller, Marvin J.
THANKS

C13 NMR spectroscopy

  • 1.
    C13 NMR Spectroscopy Introduction Carbon-13 NuclearMagnetic Resonance Spectroscopy Technique is based on the fact that the net nuclear spin for C13 isotope of carbon is half unlike C12 isotope for which it is zero (thus C12 is non-magnetic and does not give any NMR signal). Though C13 has a low natural abundance of only 1.11% and is inherently less sensitive than H1 NMR (so in order to observe the weak signals the spectra is scanned repeatedly), but it is simpler to interpret. Characteristics of C13 NMR Spectra 1. Since it is impossible that a particular C13 molecule will have another C13 nucleus as an immediate neighbour, thus splitting of C13 signal due to C13 ―C13 coupling is negligible and the signal is easy to interpret. 2. The proton decoupled C13 NMR spectrum gives single unsplit peak for each magnetically non-equivalent carbon thus providing direct information about the carbon skeleton. 3. In C13 NMR, signals are spread over a chemical shift range of 200 ppm as compared to H1 NMR for which the range is only 15 ppm, and thus only fewer peaks overlap. 4. In proton coupled spectra, signal for each carbon is split by number of H+ bonded directly to that carbon by (n+1) rule, where ‘n’ is the number of H-atoms present on the carbon.
  • 2.
    Carbon Chemical Shift Eachcarbon nucleus has its own electronic environment different from the environment of other, non-equivalent nuclei; it experiences a different magnetic field and absorbs at different applied field strength. This causes chemical shift in C13 NMR spectrum. C13 chemical shift normally ranges between 0 -250 ppm and is expressed in ppm downfield from TMS (Tetramethylsilane), i.e., the reference compound. The C13 chemical shift follows the order:- C=O (aldehyde and ketone) > C=O (acids, esters, amides) > C=C, C≡N, aromatic carbons > C≡C > C−O (alcohols and ethers) > C–X (X→ Cl, Br, N) > alkanes. Figure 1. Range of C13 Chemical Shifts Important Features of C13 Chemical Shift  Alkanes absorb from -2 to 55 ppm. Methane absorbs at - 2.1 ppm upfield from TMS.  In saturated acyclic alkanes, replacement of –H by CH3 group deshields C to which it is attached by 9.1 ppm (α- effect), β- carbon is deshielded by 9.4 ppm (β- effect) and γ- carbon is shielded by -2.5 ppm (γ- effect).
  • 3.
     Increasing alkylationmoves the carbon resonance downfield.  In functionalized alkanes, when a H is replaced by a heteroatom like >C=O, deshielding effect is caused due to such electronegative substituents and downfield shift occurs.  The value of chemical shift indicates the type of hybridization. The signal for sp3 hybridized carbons occur upfield in the range of -2 to 55 ppm. For sp2 hybridized carbons (in alkenes and arenes), signals appear in the region of 80 to 170 ppm downfield from TMS. The triply bonded hybridized carbons (sp hybridization) absorb in the region between sp3 and sp2 carbons, i.e., 65 to 90 ppm.  Carbon of carbonyl group absorbs far downfield (almost 220 ppm). This is due to:- i) sp2 hybridization ii) The presence of electronegative O atom directly bonded to the carbon. Factors Affecting C13 Chemical Shift 1. Deshielding effect of electronegative moiety: Presence of electronegative groups like >C=O, ―OH, etc. brings about a downfield shift in the resonance at α and β positions and a small upfield at γ position. For example, the spectra of butane and 1-butanol.  In butane, H3 2 2 3, the spectrum shows 2 signals – i) For ‘a’ type of 2 carbons at 13.2 ppm.
  • 4.
    ii) For ‘b’type of 2 carbons at 25.0 ppm.  In 1-butanol, 3 2 2 2 O , the spectrum shows 4 signals – i) For ‘a’ type carbon, δ = 61.7 ppm (high downfield shift, α-effect). ii) For ‘b’ type carbon, δ = 35.3 ppm (downfield shift, β-effect). iii) For ‘c’ type carbon, δ = 19.4 ppm (upfield shift, γ- effect). iv) For ‘d’ type carbon, δ = 13.9 ppm. 2. Effect of Hybridization: The signal for sp3 hybridized carbons occur upfield in the range of -2 to 55 ppm as compared to sp2 hybridization for which the range is 110 to 170 ppm; while for sp hybridized carbons the range is 65 to 90 ppm which is an intermediate to sp3 and sp2 . For example, the values chemical shifts for ethane, ethene and ethyne. For all the three, the spectra shows only 1 signal – i) For CH3 3, δ = 5.9 ppm ii) For CH2=CH2, δ = 122.8 ppm iii) For ≡ , δ = 71.9 ppm It is generally found that terminal =CH2 group absorbs upfield than an internal =CH― group. For example, the spectra of 1-butene and 2-butene.  In 1-butene, CH3 2 2, δ value for ‘a’ type of C = 112.8 ppm and for ‘b’ type of C = 140.2 ppm.
  • 5.
     In 2-butene,CH3 3, δ value for ‘a’ type of C = 13.2 ppm and for ‘b’ type of C = 123.3 ppm. 3. Effect of Substituent: Substituents like Cl, Br, N, etc. shift the signal downfield. This signal is much more downfield as compared to the corresponding in H1 NMR spectra. For example, the spectra of n-pentane and 1- chloropentane.  In n-pentane, 3 2 2 2 3, the proton decoupled spectra will show 3 signals – i) For ‘a’ type of 2 carbons, δ = 13.7 ppm ii) For ‘b’ type of 2 carbons, δ = 22.6 ppm iii) For ‘c’ type of 1 carbon, δ = 34.5 ppm  In 1-chloropentane, 3 2 2 2 2 l, the proton decoupled spectra show 5 signals – i) For ‘a’ type of C-atom, δ = 44.3 ppm instead of 13.7 ppm because of α-C effect (large downfield shift of almost 30.6 ppm). ii) For ‘b’ type of C-atom, δ = 32.7 ppm instead of 22.6 ppm because of β-C effect (downfield shift of almost 10.1ppm). iii) For ‘c’ type of C-atom, δ = 29.4 ppm instead of 34.5 ppm because of γ-C effect (small upfield shift of almost -5.3 ppm). iv) For ‘d’ type of C-atom, δ = 22.1 ppm. v) For ‘e’ type of C-atom, δ = 13.6 ppm. Thus this effect is not propound after γ-carbon.
  • 6.
    References 1. Spectroscopy; Kaur,H. 2. Spectroscopy of Organic Compounds; Kalsi, P.S. 3. Experiments and Techniques in Organic Chemistry; Pasto, Daniel J., Johnson, Carl R. and Miller, Marvin J. THANKS