Download to read offline
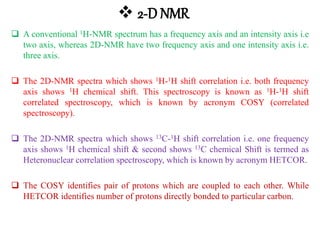
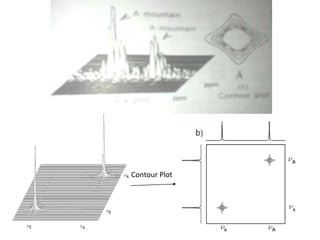
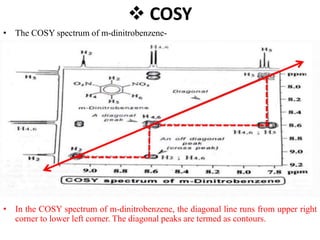
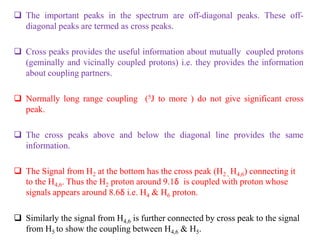
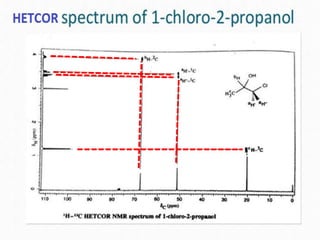
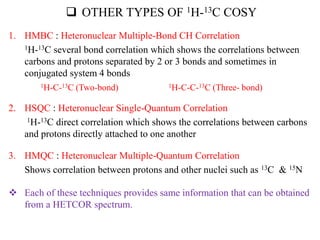
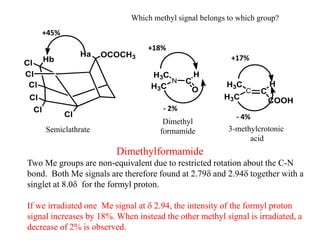
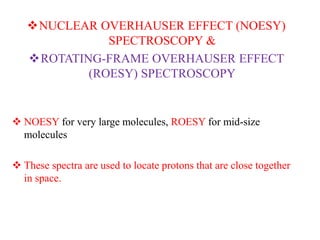
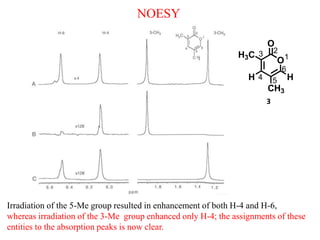
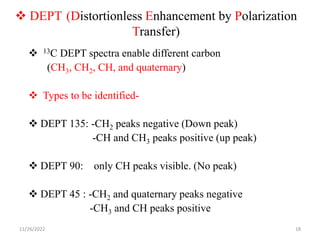
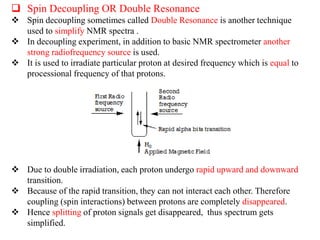
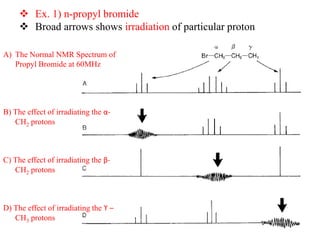

2D NMR techniques provide additional information beyond conventional 1D NMR. COSY identifies pairs of coupled protons, while HETCOR identifies the number of protons directly bonded to a particular carbon. NOESY and ROESY spectra locate protons that are close in space. DEPT distinguishes between carbon types such as CH3, CH2, CH, and quaternary carbons. Spin decoupling simplifies spectra by removing coupling between irradiated and non-irradiated protons.


![Noesy [autosaved]](https://cdn.slidesharecdn.com/ss_thumbnails/noesyautosaved-200728183752-thumbnail.jpg?width=640&height=640&fit=bounds)

![PHASE TRANSFER CATALYSIS [PTC]](https://cdn.slidesharecdn.com/ss_thumbnails/64-191219161253-thumbnail.jpg?width=640&height=640&fit=bounds)


![SMILES REARRANGEMENT [REACTION AND MECHANISM]](https://cdn.slidesharecdn.com/ss_thumbnails/58-191219140707-thumbnail.jpg?width=640&height=640&fit=bounds)