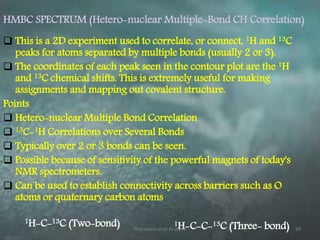
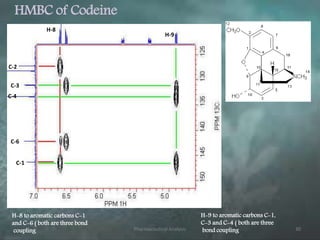
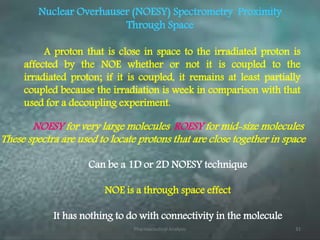
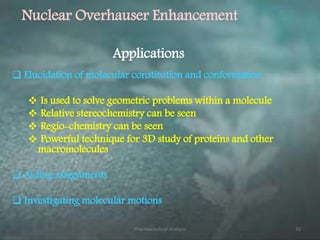
Pharmaceutical Analysis 2
Pharmaceutical Analysis 3
scope
NMR
spectrum
Structure
Chem. Shift
J Coupling
Peak Int.
NOE
Correlation
H-H,C-H
Chemical shift ----- local nuclear environment
J Coupling ---- torsion angles
Nuclear Overhauser effect --- inter-nuclear distances
Pharmaceutical Analysis 4
Why 2d nmr spectroscopy.?
Pharmaceutical Analysis 5
Comparison of 1D with 2d
A conventional H1NMR has a frequency axis
and intensity axis, 2d NMR spectra have two
frequency axis and intensity axis.
A normal NMR spectrum is obtained by
plotting amplitude against one frequency
dimension(F1) where as in 2d NMR the
spectrum is obtained by plotting amplitude
against two frequency dimension(F1 and F2).
Every peak in 2d NMR spectrum has two
frequency co-ordinates which corresponds to
F1 & F2.
Pharmaceutical Analysis 6
Cont…
Pharmaceutical Analysis 7
history
1967 Fourier transforms
1971 Jean Jenner - Two dimensional NMR -
COSY
1976 Richard Ernst - First two dimensional NMR
experiment
1980s - application of NMR to protein structures
 In 1991- Ernst won a Nobel Prize in Chemistry
for his contributions to Fourier Transform NMR
Pharmaceutical Analysis 8
Introduction
It is a set of NMR methods which give data
plotted in a space defined by two frequency
axes rather than one.
In general, 2d’s can be divided into 2 types.,
Homo-nuclear
Hetero-nuclear
Each type can provide either through –
bond(COSY-type) or through space (NOESY-
type) coupling information.
Pharmaceutical Analysis 9
Preparation spin system relaxes and then excited by r.f.
Evolution (t1) chemical shifts & spin-spin couplings evolve.
This is the time domain which is incremented
during a 2D experiment
Mixing r.f. pulses are applied and create observable
transverse magnetization
Detection (t2) observable transverse magnetization is recorded.
It is usually labeled with t2
Four periods in 2D experiment
Pharmaceutical Analysis 10
Free Induction Decay
The signals decay away due to interactions with the surroundings.
A free induction decay, FID, is the result.
Fourier transformation, FT, of this time domain signal
produces a frequency domain signal.
FT
Time Frequency
Pharmaceutical Analysis 11
Spin Relaxation
There are two primary causes of spin relaxation:
Spin - lattice relaxation, T1, longitudinal relaxation.
Spin - spin relaxation, T2, transverse relaxation.
lattice
Pharmaceutical Analysis 12
 Primary 2D matrix consists a series of FIDs.
 A set of 1D NMR spectra is obtained by Fourier
transformation with respect to t2
 The signals of each transformation may differ in amplitude
and phase. A second Fourier transformation with respect to
t1 yields the final 2D matrix with frequency axes F1 and F2
1. 2. 3.
2D NMR
Pharmaceutical Analysis 13
Cont…
Pharmaceutical Analysis 14
GENERAL PROCEDURE FOR RUNNING 2D SPECTRA:
 Insert sample, Lock, tune 1H channel and shim (determine 900
pulse width)
 Acquire 1H NMR spectrum
 Re-acquire 1H spectrum with reduced sweep width, and then
determine the number of scans required. Record parameter values
 Acquire 13C spectrum in optimum spectral window to run HSQC
and HMBC (if any)
 Call up macro for 2D experiment and check 2D pulse program
 Load prosol parameters and set up the reference, sweep width,
transmitter, frequency, number of scans and the number of points.
 Set receiver gain, acquire
 Transform 2D data, phase and load projection
Pharmaceutical Analysis 15
Choice of 2d NMR
 NMR signal assignment, improve resolution
(dispersion)
- COSY, HSQC, HMBC
Confirmation
- NOESY, ROESY
Kinetic studies (chemical exchange)
- NOSEY, DOSY
Pharmaceutical Analysis 16
1H-1H COSY (Correlation Spectroscopy)
2-D NMR spectra have two frequency axes and one
intensity axis. The most common 2-D spectra involve 1H-1H
shift correlation; they identify protons that are coupled (i.e.,
that split each other’s signal). This is called 1H-1H shift-
correlated spectroscopy, which is known by the acronym
COSY.
 1H-1H correlation spectra
 2-D dimensional plot with 1H spectrum along each axis and
on the diagonal
 Protons coupling to one another produce off diagonal correlations
This allows assignment of proton groups that are connected
in the molecule
 Shows connectivity in the compound
Pharmaceutical Analysis 17
COSY spectrum of Ethyl Vinyl Ether
Fig: 2 Contour plotFig:1 Stack plot
x
y
Pharmaceutical Analysis 18
1H-1H COSY Spectrum of Ethyl Vinyl Ether
Fig:1. It looks like a mountain range viewed from the air because
intensity is the third axis.
These “mountain-like” spectra (known as stack plots) are not the
spectra actually used to identify a compound.
Instead, the compound is identified using a contour plot Fig:2,
where each mountain in Fig:1 is represented by a large dot (as if its
top had been cut off). The two mountains shown in Fig:1 correspond
to the dots labelled B and C in Fig: 2
Fig:2, the usual one-dimensional 1H NMR spectrum is plotted on both the
x- and y- axes.
To analyze the spectrum, a diagonal line is drawn through the
dots that bisect the spectrum.
Pharmaceutical Analysis 19
1H-1H COSY Spectrum of Ethyl Vinyl Ether
The dots that are not on the diagonal (A, B, C) are called
cross peaks. Cross peaks indicate pairs of protons that are
coupled.
For example, if we start at the cross peak labelled A and draw a
straight line parallel to the y-axis back to the diagonal, we hit
the dot on the diagonal at ~ 1.1 ppm produced by the Ha
protons
If we next go back to A and draw a straight line parallel to
the x-axis back to the diagonal, we hit the dot on the diagonal
at ~ 3.8 ppm produced by the Hb protons. This means that the
Ha and Hb protons are coupled.
Pharmaceutical Analysis 20
1H-1H COSY Spectrum of Ethyl Vinyl Ether
 If we then go to the cross peak labelled B and draw two
perpendicular line back to the diagonal, we see that the Hc and
He protons are coupled; the cross peak labelled C shows that
the Hd and He protons are coupled.
 Notice that we used only cross peaks below the diagonal; the
cross peaks above the diagonal give the same information.
 Notice also that there is no cross peak due to the coupling of
Hc and Hd, consistent with the absence of coupling for two
protons bonded to an sp2 carbon.
Pharmaceutical Analysis 21
HETCOR Spectrum or (1H- 13C COSY)
2-D NMR spectra that show 13C-1H shift correlation are
called HETCOR (from heteronuclear correlation) spectra. HETCOR
spectra indicate coupling between protons and the carbon to
which they are attached.
Example: 2-methyl-3-pentanone
The 13C NMR spectrum is shown on the x-axis and the 1H
NMR spectrum is shown on the y-axis. The cross peaks in a
HETCOR spectrum identify which hydrogens are attached to
which carbons.
For example, cross peak A indicates that the hydrogens that shows a
signal at ~ 0.9 ppm in the 1H NMR are bonded to the carbon that shows
a signal at ~ 6 ppm in the 13CNMR spectrum.
Cross peak C shows that the hydrogens that show a signal at
~ 2.5 ppm are bonded to the carbon that shows a signal at ~
34ppm.
Pharmaceutical Analysis 22
HETCOR spectrum of 2-methyl-3-pentanone
y
x CH3
CH3
CH2CH
Pharmaceutical Analysis 23
DEPT 13C NMR SPECTRA
13C DEPT spectra enable different carbon
(CH3, CH2, CH, and quaternary)
Types to be identified
DEPT 90: only CH peaks visible
DEPT 135: -CH2 peaks negative
-CH and CH3 peaks positive
PENDANT: -CH2 and quaternary peaks negative
-CH3 and CH peaks positive
Pharmaceutical Analysis 24
DEPT 13C NMR SPECTRA
 DEPT: stands for distortion less enhancement by polarization transfer.
 This technique to distinguish among CH3, CH2, and CH group
 It is now much more widely used than proton coupling to determine the
number of hydrogens attached to a carbon.
 DEPT 13C spectrum does not show a signal for a carbon that is not
attached to a hydrogen.
 For example: 13C NMR spectrum of 2-butanone shows 4 signals because
it has 4 non-equivalent carbons, whereas the DEPT 13C NMR of 2-
butanone shows only three signals because the carbonyl carbon is not
bonded to a hydrogen, so it will not produce a signal.
CH3-CH2-CO-CH3
Normal 13C NMR gives 4 signals
DEPT 13C NMR gives 3 signals
1234
Pharmaceutical Analysis 25
DEPT 13C NMR Spectra of Ipsenol
In CDCl3 at 75.6 MHz:
Sub-spectrum A, CH up.
Sub-spectrum B, CH3 and CH up, CH2 down.
The conventional 13C NMR spectrum is at the Bottom.
HO
1
2
3
4
5
6
7
8
3X CH-
3X CH, 2X CH3
4X CH2
Pharmaceutical Analysis 26
Other Types Of 1H-13C COSY
 HSQC: 1H-13C carbon and protons direct correlation
can give considerably better 13C resolution and
sensitivity than HMQC for CH2 groups of natural products.
 HMQC: correlation between protons and other nuclei such
as 13C or 15N
has simpler pulse sequence and it is more robust and
easier to perform.
 HMBC: 1H-13C several bond correlation
Long range connections or connections between spin
systems
Pharmaceutical Analysis 27
HSQC (Hetero-nuclear Single Quantum Coherence)
13C-1H correlation spectra
2 Dimensional plot -1H spectrum on one axis, 13C on the other
Shows Correlations between carbons and protons
directly attached to one another
allows further connectivity within the molecule to be established
Pharmaceutical Analysis 28
HMBC SPECTRUM (Hetero-nuclear Multiple-Bond CH Correlation)
 This is a 2D experiment used to correlate, or connect, 1H and 13C
peaks for atoms separated by multiple bonds (usually 2 or 3).
 The coordinates of each peak seen in the contour plot are the 1H
and 13C chemical shifts. This is extremely useful for making
assignments and mapping out covalent structure.
Points
 Hetero-nuclear Multiple Bond Correlation
 13C-1H Correlations over Several Bonds
 Typically over 2 or 3 bonds can be seen.
 Possible because of sensitivity of the powerful magnets of today's
NMR spectrometers.
 Can be used to establish connectivity across barriers such as O
atoms or quaternary carbon atoms
1H-C-13C (Two-bond) 1H-C-C-13C (Three- bond)Pharmaceutical Analysis 29
HMBC of Codeine
H-8 to aromatic carbons C-1
and C-6 ( both are three bond
coupling
C-6
C-1
C-2
H-8
H-9 to aromatic carbons C-1,
C-3 and C-4 ( both are three
bond coupling
H-9
C-3
C-4
Pharmaceutical Analysis 30
Nuclear Overhauser (NOESY) Spectrometry Proximity
Through Space
A proton that is close in space to the irradiated proton is
affected by the NOE whether or not it is coupled to the
irradiated proton; if it is coupled, it remains at least partially
coupled because the irradiation is week in comparison with that
used for a decoupling experiment.
Can be a 1D or 2D NOESY technique
NOE is a through space effect
It has nothing to do with connectivity in the molecule
NOESY for very large molecules, ROESY for mid-size molecules
These spectra are used to locate protons that are close together in space
Pharmaceutical Analysis 31
 Elucidation of molecular constitution and conformation
 Is used to solve geometric problems within a molecule
 Relative stereochemistry can be seen
 Regio-chemistry can be seen
 Powerful technique for 3D study of proteins and other
macromolecules
 Aiding assignments
 Investigating molecular motions
Nuclear Overhauser Enhancement
Applications
Pharmaceutical Analysis 32
Ha OCOCH3
Cl Hb
Cl
Cl
Cl
Cl
Cl
N C
O
HH3C
H3C
C C
COOH
HH3C
H3C
+45%
+18%
- 2%
+17%
- 4%
semiclathrate
Dimethylformamide
3-methylcrotonic
acid
Nuclear Overhauser Enhancement
two Me groups are non-
equivalent owing to hindered
rotation about the C-N bond.
Both Me signals are therefore found
At  2.79 and  2.94, together with a singlet
at  8.0 for the formyl proton. If one now saturates
the Me signal at  2.94, the intensity of the formyl
proton signal increases by 18%. When instead the
other methyl signal is saturated, a decrease of 2% is
observed.
Which methyl signal belongs to which group?
Pharmaceutical Analysis 33
Nuclear Overhauser Effect Difference (NOESY) Spectrometry,
1H 1H Proximity Through Space
O
O
R
CH3
H H
O
O
H3C
R
H H
O
O
H3C
CH3
H H
1
23
4 5
6
1 2 3
NOE difference spectrometry determined the substitution pattern of a
natural product, whose structure was either 1 or 2.
NOE difference spectrometry of compound 3 will help us to
settle the final structure
readily
available
natural product
Pharmaceutical Analysis 34
NOE difference spectrometry for Compound-3
3
Irradiation of the 5-Me group resulted in enhancement of both H-4
and H-6, whereas irradiation of the 3-Me group enhanced only H-4; the
assignments of these entities to the absorption peaks is now clear.
O
O
H3C
CH3
H H
1
23
4 5
6
Pharmaceutical Analysis 35
2-D 13C-13C Correlations: INADEQUATE Spectra
2D INADEQUATE provides direct carbon
connectivities enabling us to sketch the carbon skeleton
unambiguously
2-D INADEQUATE has very limited applicability
because of its extremely low sensitivity
(Incredible Natural Abundance Double quantum Transfer Experiment)
Pharmaceutical Analysis 36
INADEQUATE spectrum of 2-methyl-1-butanol
Pharmaceutical Analysis 37
SPECTRUM OF 2-METHYL-1-BUTANOL
Pharmaceutical Analysis 38
The low-field chemical shift at 67ppm identifies
it as C1 , the carbon bearing the –OH substituent. The
C1 resonance has only one cross peck in the
spectrum at the same frequency in F1 and this must
corresponds to C2 (at 37ppm). C2 must be branch
point in the carbon chain since it shows correlations
to two additional cross pecks, which correspond to C3
(at 26ppm) and C5 (at 17ppm). C3 has one additional
cross-peck which identifies C4 (at 11ppm).
APPLICATIONS
Structural identification in organic and
biological chemistry. Since its creation, 2D NMR
has been useful for elucidating the structure of
small molecules
Advanced computing power now allows the
structure of large , biological molecules to be
solved.
 Used COSY and NOESY to obtain individual
assignments for each proton in the protein
backbone in the β-sheet secondary structure of
pancreatic trypsin inhibitor
Pharmaceutical Analysis 39
Cont…
COSY NMR was used to determine the J
connectivities on the protein backbone
2D NMR uses a sequence of two pulses with a
series of different evolution times to determine
which nuclear spins are coupled to one another.
 COSY spectra indicate through-bond coupling,
and can be used to gain structural information
about molecules of a wide range of sizes.
Pharmaceutical Analysis 40
Today’s NMR Experiments
Pharmaceutical Analysis 41
Pharmaceutical Analysis 42
Reference:
Organic spectroscopy by William Kemp
Instrumental methods of chemical analysis by
Chatwal
Instrumental methods of analysis by Willard
Spectrometric Identification of Organic compounds
(six edition): Robert M. Silverstein and Francis X.
Webster
Spectroscopic Methods in Organic Chemistry (fifth
edition): Dudley H. Williams and Ian Fleming
Wikipedia.org
Pharmaceutical Analysis 43
Pharmaceutical Analysis 44
Pharmaceutical Analysis 45

2D NMR Spectroscopy

  • 2.
  • 3.
  • 4.
    scope NMR spectrum Structure Chem. Shift J Coupling PeakInt. NOE Correlation H-H,C-H Chemical shift ----- local nuclear environment J Coupling ---- torsion angles Nuclear Overhauser effect --- inter-nuclear distances Pharmaceutical Analysis 4
  • 5.
    Why 2d nmrspectroscopy.? Pharmaceutical Analysis 5
  • 6.
    Comparison of 1Dwith 2d A conventional H1NMR has a frequency axis and intensity axis, 2d NMR spectra have two frequency axis and intensity axis. A normal NMR spectrum is obtained by plotting amplitude against one frequency dimension(F1) where as in 2d NMR the spectrum is obtained by plotting amplitude against two frequency dimension(F1 and F2). Every peak in 2d NMR spectrum has two frequency co-ordinates which corresponds to F1 & F2. Pharmaceutical Analysis 6
  • 7.
  • 8.
    history 1967 Fourier transforms 1971Jean Jenner - Two dimensional NMR - COSY 1976 Richard Ernst - First two dimensional NMR experiment 1980s - application of NMR to protein structures  In 1991- Ernst won a Nobel Prize in Chemistry for his contributions to Fourier Transform NMR Pharmaceutical Analysis 8
  • 9.
    Introduction It is aset of NMR methods which give data plotted in a space defined by two frequency axes rather than one. In general, 2d’s can be divided into 2 types., Homo-nuclear Hetero-nuclear Each type can provide either through – bond(COSY-type) or through space (NOESY- type) coupling information. Pharmaceutical Analysis 9
  • 10.
    Preparation spin systemrelaxes and then excited by r.f. Evolution (t1) chemical shifts & spin-spin couplings evolve. This is the time domain which is incremented during a 2D experiment Mixing r.f. pulses are applied and create observable transverse magnetization Detection (t2) observable transverse magnetization is recorded. It is usually labeled with t2 Four periods in 2D experiment Pharmaceutical Analysis 10
  • 11.
    Free Induction Decay Thesignals decay away due to interactions with the surroundings. A free induction decay, FID, is the result. Fourier transformation, FT, of this time domain signal produces a frequency domain signal. FT Time Frequency Pharmaceutical Analysis 11
  • 12.
    Spin Relaxation There aretwo primary causes of spin relaxation: Spin - lattice relaxation, T1, longitudinal relaxation. Spin - spin relaxation, T2, transverse relaxation. lattice Pharmaceutical Analysis 12
  • 13.
     Primary 2Dmatrix consists a series of FIDs.  A set of 1D NMR spectra is obtained by Fourier transformation with respect to t2  The signals of each transformation may differ in amplitude and phase. A second Fourier transformation with respect to t1 yields the final 2D matrix with frequency axes F1 and F2 1. 2. 3. 2D NMR Pharmaceutical Analysis 13
  • 14.
  • 15.
    GENERAL PROCEDURE FORRUNNING 2D SPECTRA:  Insert sample, Lock, tune 1H channel and shim (determine 900 pulse width)  Acquire 1H NMR spectrum  Re-acquire 1H spectrum with reduced sweep width, and then determine the number of scans required. Record parameter values  Acquire 13C spectrum in optimum spectral window to run HSQC and HMBC (if any)  Call up macro for 2D experiment and check 2D pulse program  Load prosol parameters and set up the reference, sweep width, transmitter, frequency, number of scans and the number of points.  Set receiver gain, acquire  Transform 2D data, phase and load projection Pharmaceutical Analysis 15
  • 16.
    Choice of 2dNMR  NMR signal assignment, improve resolution (dispersion) - COSY, HSQC, HMBC Confirmation - NOESY, ROESY Kinetic studies (chemical exchange) - NOSEY, DOSY Pharmaceutical Analysis 16
  • 17.
    1H-1H COSY (CorrelationSpectroscopy) 2-D NMR spectra have two frequency axes and one intensity axis. The most common 2-D spectra involve 1H-1H shift correlation; they identify protons that are coupled (i.e., that split each other’s signal). This is called 1H-1H shift- correlated spectroscopy, which is known by the acronym COSY.  1H-1H correlation spectra  2-D dimensional plot with 1H spectrum along each axis and on the diagonal  Protons coupling to one another produce off diagonal correlations This allows assignment of proton groups that are connected in the molecule  Shows connectivity in the compound Pharmaceutical Analysis 17
  • 18.
    COSY spectrum ofEthyl Vinyl Ether Fig: 2 Contour plotFig:1 Stack plot x y Pharmaceutical Analysis 18
  • 19.
    1H-1H COSY Spectrumof Ethyl Vinyl Ether Fig:1. It looks like a mountain range viewed from the air because intensity is the third axis. These “mountain-like” spectra (known as stack plots) are not the spectra actually used to identify a compound. Instead, the compound is identified using a contour plot Fig:2, where each mountain in Fig:1 is represented by a large dot (as if its top had been cut off). The two mountains shown in Fig:1 correspond to the dots labelled B and C in Fig: 2 Fig:2, the usual one-dimensional 1H NMR spectrum is plotted on both the x- and y- axes. To analyze the spectrum, a diagonal line is drawn through the dots that bisect the spectrum. Pharmaceutical Analysis 19
  • 20.
    1H-1H COSY Spectrumof Ethyl Vinyl Ether The dots that are not on the diagonal (A, B, C) are called cross peaks. Cross peaks indicate pairs of protons that are coupled. For example, if we start at the cross peak labelled A and draw a straight line parallel to the y-axis back to the diagonal, we hit the dot on the diagonal at ~ 1.1 ppm produced by the Ha protons If we next go back to A and draw a straight line parallel to the x-axis back to the diagonal, we hit the dot on the diagonal at ~ 3.8 ppm produced by the Hb protons. This means that the Ha and Hb protons are coupled. Pharmaceutical Analysis 20
  • 21.
    1H-1H COSY Spectrumof Ethyl Vinyl Ether  If we then go to the cross peak labelled B and draw two perpendicular line back to the diagonal, we see that the Hc and He protons are coupled; the cross peak labelled C shows that the Hd and He protons are coupled.  Notice that we used only cross peaks below the diagonal; the cross peaks above the diagonal give the same information.  Notice also that there is no cross peak due to the coupling of Hc and Hd, consistent with the absence of coupling for two protons bonded to an sp2 carbon. Pharmaceutical Analysis 21
  • 22.
    HETCOR Spectrum or(1H- 13C COSY) 2-D NMR spectra that show 13C-1H shift correlation are called HETCOR (from heteronuclear correlation) spectra. HETCOR spectra indicate coupling between protons and the carbon to which they are attached. Example: 2-methyl-3-pentanone The 13C NMR spectrum is shown on the x-axis and the 1H NMR spectrum is shown on the y-axis. The cross peaks in a HETCOR spectrum identify which hydrogens are attached to which carbons. For example, cross peak A indicates that the hydrogens that shows a signal at ~ 0.9 ppm in the 1H NMR are bonded to the carbon that shows a signal at ~ 6 ppm in the 13CNMR spectrum. Cross peak C shows that the hydrogens that show a signal at ~ 2.5 ppm are bonded to the carbon that shows a signal at ~ 34ppm. Pharmaceutical Analysis 22
  • 23.
    HETCOR spectrum of2-methyl-3-pentanone y x CH3 CH3 CH2CH Pharmaceutical Analysis 23
  • 24.
    DEPT 13C NMRSPECTRA 13C DEPT spectra enable different carbon (CH3, CH2, CH, and quaternary) Types to be identified DEPT 90: only CH peaks visible DEPT 135: -CH2 peaks negative -CH and CH3 peaks positive PENDANT: -CH2 and quaternary peaks negative -CH3 and CH peaks positive Pharmaceutical Analysis 24
  • 25.
    DEPT 13C NMRSPECTRA  DEPT: stands for distortion less enhancement by polarization transfer.  This technique to distinguish among CH3, CH2, and CH group  It is now much more widely used than proton coupling to determine the number of hydrogens attached to a carbon.  DEPT 13C spectrum does not show a signal for a carbon that is not attached to a hydrogen.  For example: 13C NMR spectrum of 2-butanone shows 4 signals because it has 4 non-equivalent carbons, whereas the DEPT 13C NMR of 2- butanone shows only three signals because the carbonyl carbon is not bonded to a hydrogen, so it will not produce a signal. CH3-CH2-CO-CH3 Normal 13C NMR gives 4 signals DEPT 13C NMR gives 3 signals 1234 Pharmaceutical Analysis 25
  • 26.
    DEPT 13C NMRSpectra of Ipsenol In CDCl3 at 75.6 MHz: Sub-spectrum A, CH up. Sub-spectrum B, CH3 and CH up, CH2 down. The conventional 13C NMR spectrum is at the Bottom. HO 1 2 3 4 5 6 7 8 3X CH- 3X CH, 2X CH3 4X CH2 Pharmaceutical Analysis 26
  • 27.
    Other Types Of1H-13C COSY  HSQC: 1H-13C carbon and protons direct correlation can give considerably better 13C resolution and sensitivity than HMQC for CH2 groups of natural products.  HMQC: correlation between protons and other nuclei such as 13C or 15N has simpler pulse sequence and it is more robust and easier to perform.  HMBC: 1H-13C several bond correlation Long range connections or connections between spin systems Pharmaceutical Analysis 27
  • 28.
    HSQC (Hetero-nuclear SingleQuantum Coherence) 13C-1H correlation spectra 2 Dimensional plot -1H spectrum on one axis, 13C on the other Shows Correlations between carbons and protons directly attached to one another allows further connectivity within the molecule to be established Pharmaceutical Analysis 28
  • 29.
    HMBC SPECTRUM (Hetero-nuclearMultiple-Bond CH Correlation)  This is a 2D experiment used to correlate, or connect, 1H and 13C peaks for atoms separated by multiple bonds (usually 2 or 3).  The coordinates of each peak seen in the contour plot are the 1H and 13C chemical shifts. This is extremely useful for making assignments and mapping out covalent structure. Points  Hetero-nuclear Multiple Bond Correlation  13C-1H Correlations over Several Bonds  Typically over 2 or 3 bonds can be seen.  Possible because of sensitivity of the powerful magnets of today's NMR spectrometers.  Can be used to establish connectivity across barriers such as O atoms or quaternary carbon atoms 1H-C-13C (Two-bond) 1H-C-C-13C (Three- bond)Pharmaceutical Analysis 29
  • 30.
    HMBC of Codeine H-8to aromatic carbons C-1 and C-6 ( both are three bond coupling C-6 C-1 C-2 H-8 H-9 to aromatic carbons C-1, C-3 and C-4 ( both are three bond coupling H-9 C-3 C-4 Pharmaceutical Analysis 30
  • 31.
    Nuclear Overhauser (NOESY)Spectrometry Proximity Through Space A proton that is close in space to the irradiated proton is affected by the NOE whether or not it is coupled to the irradiated proton; if it is coupled, it remains at least partially coupled because the irradiation is week in comparison with that used for a decoupling experiment. Can be a 1D or 2D NOESY technique NOE is a through space effect It has nothing to do with connectivity in the molecule NOESY for very large molecules, ROESY for mid-size molecules These spectra are used to locate protons that are close together in space Pharmaceutical Analysis 31
  • 32.
     Elucidation ofmolecular constitution and conformation  Is used to solve geometric problems within a molecule  Relative stereochemistry can be seen  Regio-chemistry can be seen  Powerful technique for 3D study of proteins and other macromolecules  Aiding assignments  Investigating molecular motions Nuclear Overhauser Enhancement Applications Pharmaceutical Analysis 32
  • 33.
    Ha OCOCH3 Cl Hb Cl Cl Cl Cl Cl NC O HH3C H3C C C COOH HH3C H3C +45% +18% - 2% +17% - 4% semiclathrate Dimethylformamide 3-methylcrotonic acid Nuclear Overhauser Enhancement two Me groups are non- equivalent owing to hindered rotation about the C-N bond. Both Me signals are therefore found At  2.79 and  2.94, together with a singlet at  8.0 for the formyl proton. If one now saturates the Me signal at  2.94, the intensity of the formyl proton signal increases by 18%. When instead the other methyl signal is saturated, a decrease of 2% is observed. Which methyl signal belongs to which group? Pharmaceutical Analysis 33
  • 34.
    Nuclear Overhauser EffectDifference (NOESY) Spectrometry, 1H 1H Proximity Through Space O O R CH3 H H O O H3C R H H O O H3C CH3 H H 1 23 4 5 6 1 2 3 NOE difference spectrometry determined the substitution pattern of a natural product, whose structure was either 1 or 2. NOE difference spectrometry of compound 3 will help us to settle the final structure readily available natural product Pharmaceutical Analysis 34
  • 35.
    NOE difference spectrometryfor Compound-3 3 Irradiation of the 5-Me group resulted in enhancement of both H-4 and H-6, whereas irradiation of the 3-Me group enhanced only H-4; the assignments of these entities to the absorption peaks is now clear. O O H3C CH3 H H 1 23 4 5 6 Pharmaceutical Analysis 35
  • 36.
    2-D 13C-13C Correlations:INADEQUATE Spectra 2D INADEQUATE provides direct carbon connectivities enabling us to sketch the carbon skeleton unambiguously 2-D INADEQUATE has very limited applicability because of its extremely low sensitivity (Incredible Natural Abundance Double quantum Transfer Experiment) Pharmaceutical Analysis 36
  • 37.
    INADEQUATE spectrum of2-methyl-1-butanol Pharmaceutical Analysis 37
  • 38.
    SPECTRUM OF 2-METHYL-1-BUTANOL PharmaceuticalAnalysis 38 The low-field chemical shift at 67ppm identifies it as C1 , the carbon bearing the –OH substituent. The C1 resonance has only one cross peck in the spectrum at the same frequency in F1 and this must corresponds to C2 (at 37ppm). C2 must be branch point in the carbon chain since it shows correlations to two additional cross pecks, which correspond to C3 (at 26ppm) and C5 (at 17ppm). C3 has one additional cross-peck which identifies C4 (at 11ppm).
  • 39.
    APPLICATIONS Structural identification inorganic and biological chemistry. Since its creation, 2D NMR has been useful for elucidating the structure of small molecules Advanced computing power now allows the structure of large , biological molecules to be solved.  Used COSY and NOESY to obtain individual assignments for each proton in the protein backbone in the β-sheet secondary structure of pancreatic trypsin inhibitor Pharmaceutical Analysis 39
  • 40.
    Cont… COSY NMR wasused to determine the J connectivities on the protein backbone 2D NMR uses a sequence of two pulses with a series of different evolution times to determine which nuclear spins are coupled to one another.  COSY spectra indicate through-bond coupling, and can be used to gain structural information about molecules of a wide range of sizes. Pharmaceutical Analysis 40
  • 41.
  • 42.
  • 43.
    Reference: Organic spectroscopy byWilliam Kemp Instrumental methods of chemical analysis by Chatwal Instrumental methods of analysis by Willard Spectrometric Identification of Organic compounds (six edition): Robert M. Silverstein and Francis X. Webster Spectroscopic Methods in Organic Chemistry (fifth edition): Dudley H. Williams and Ian Fleming Wikipedia.org Pharmaceutical Analysis 43
  • 44.
  • 45.