Downloaded 161 times
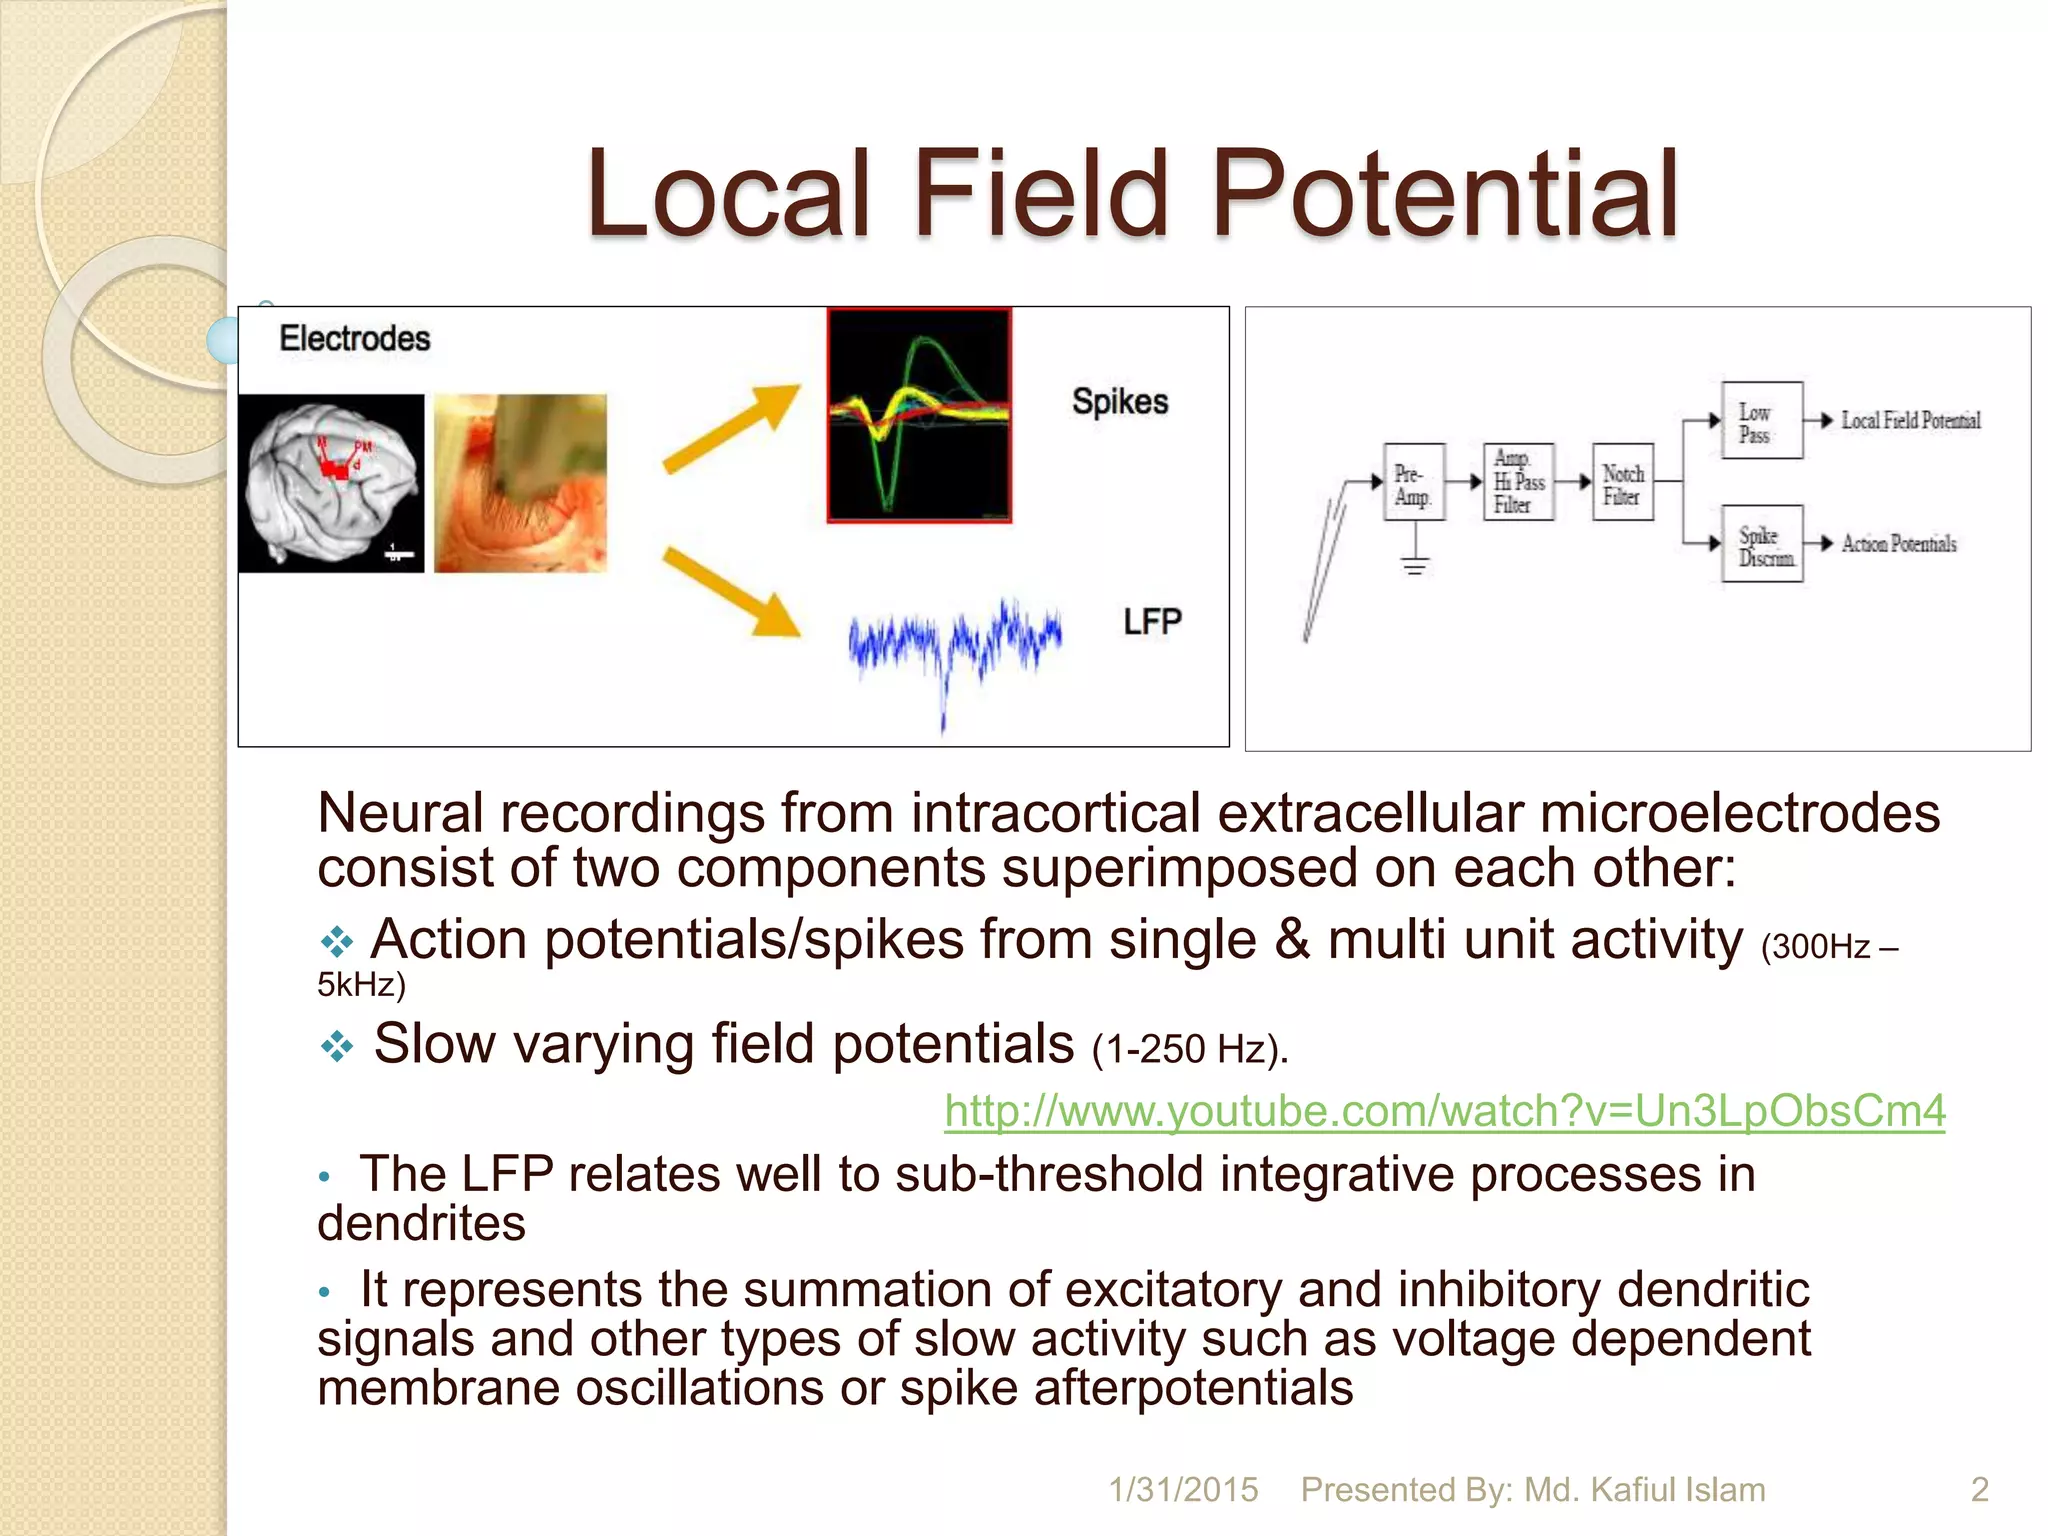
![Origin of LFP
LFP mostly represents the inputs to a particular
brain region and local processing taking place
around the recording electrode, while the
spikes represent the outputs generated by the
region.
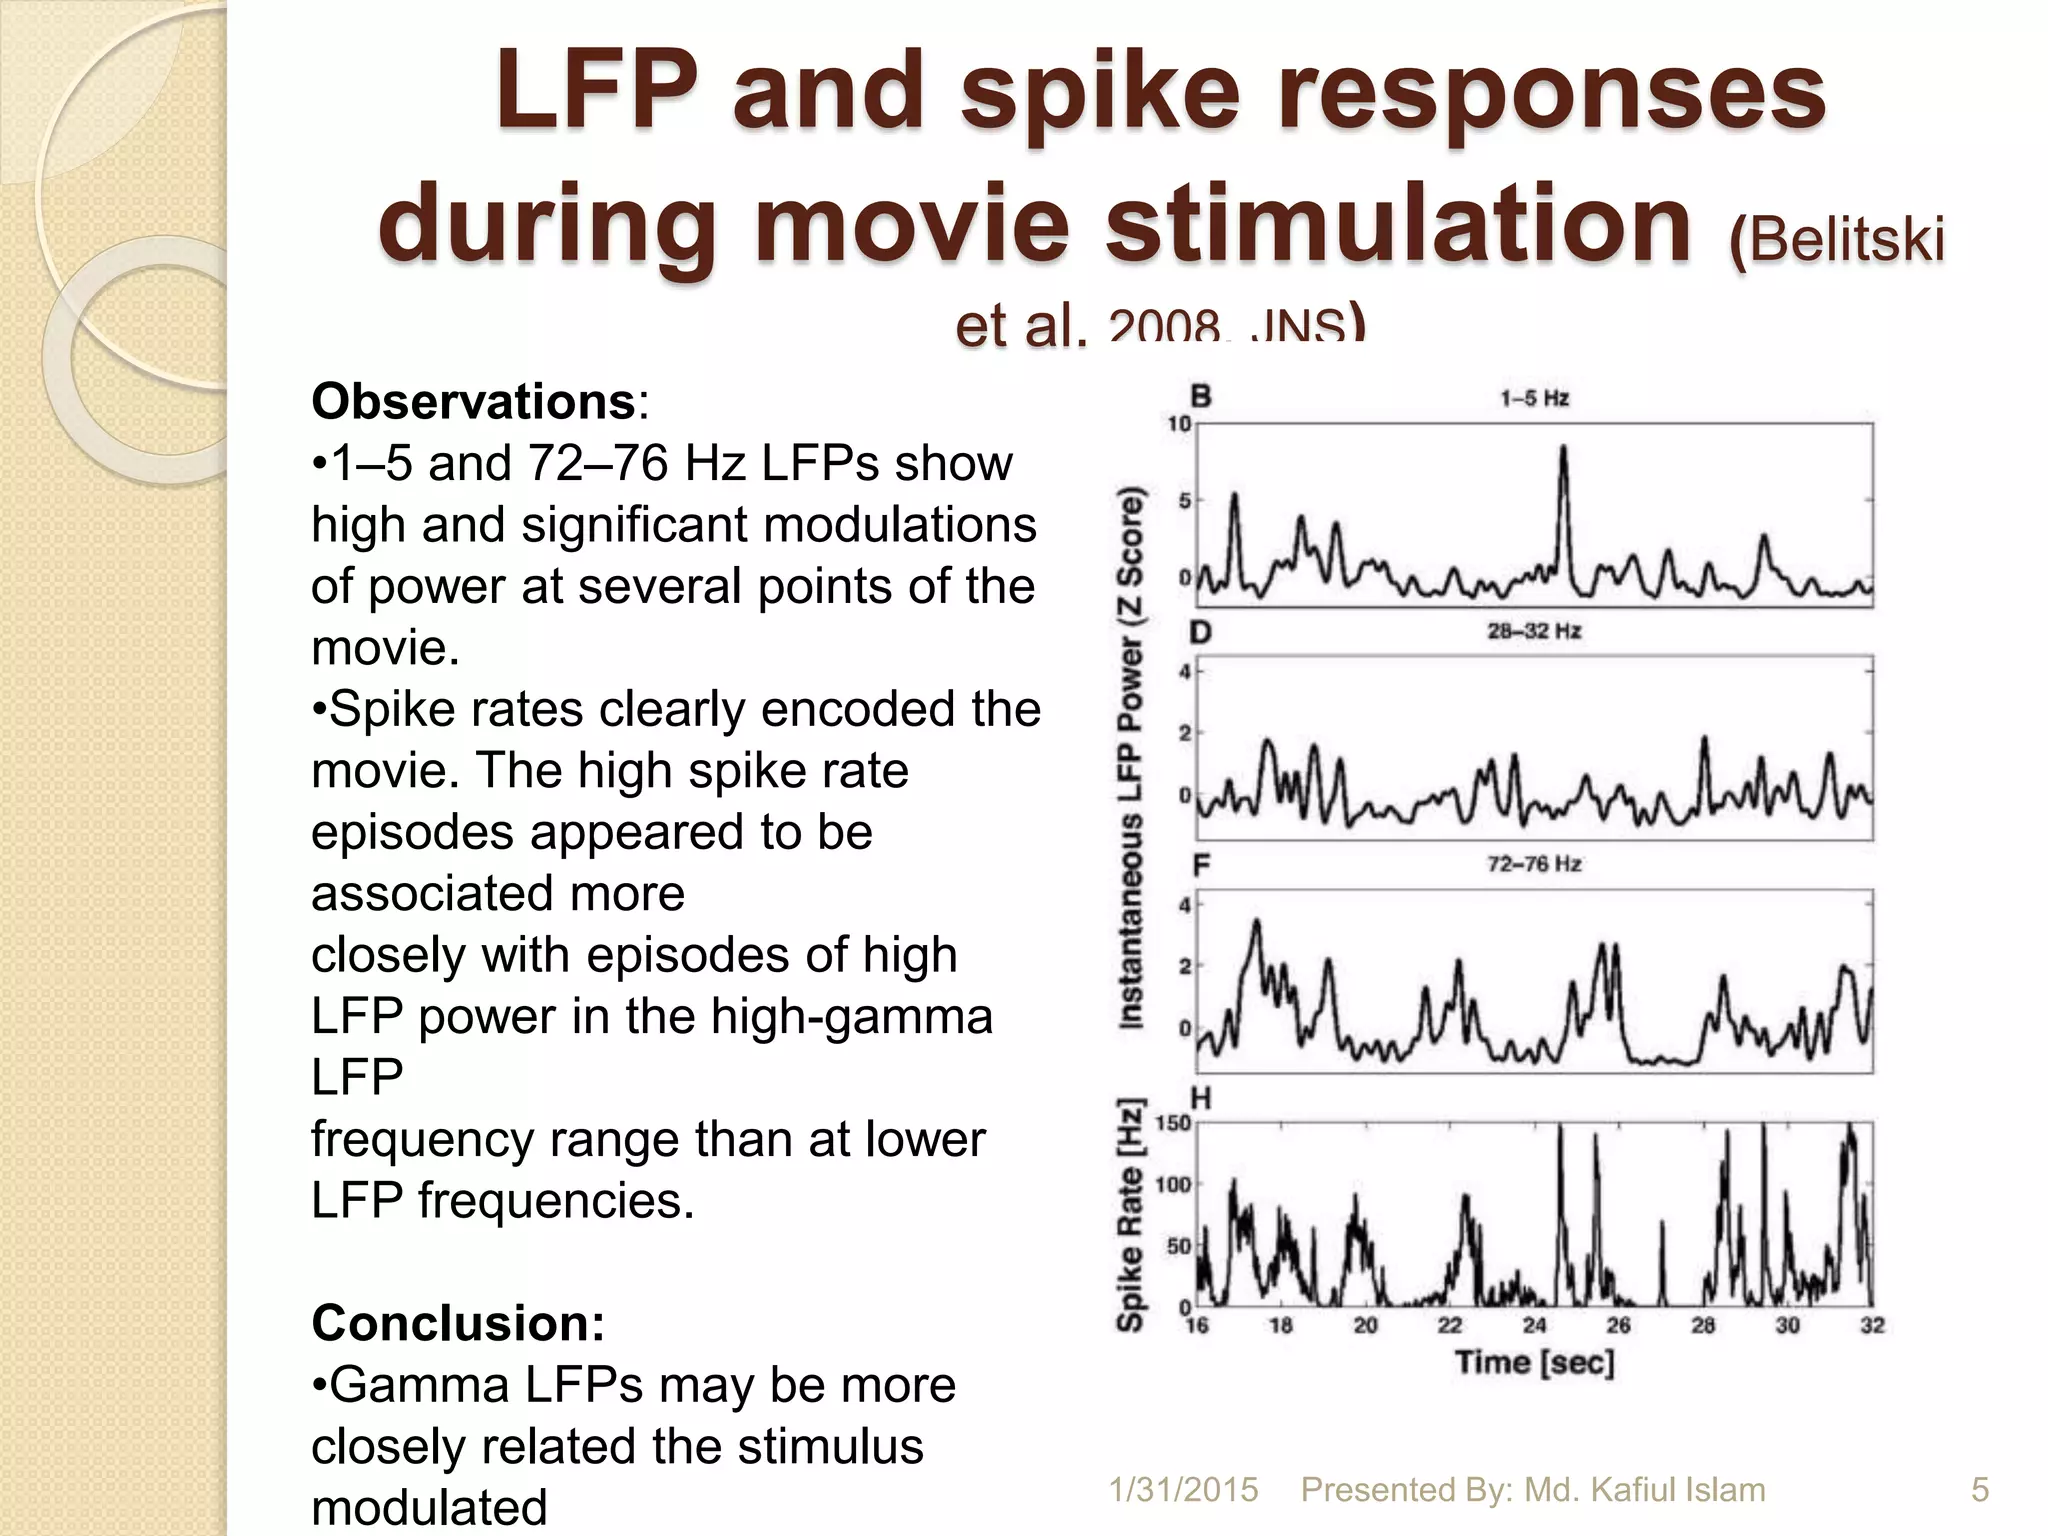
Belitski et al. examined correlations between
the stimulus and spikes and LFP recorded on
the same electrode in the visual cortex of an
anesthetized macaque while presenting a color
movie [later slide].
Nicolelis et al. reported correlations between
spikes and the 8-10 Hz LFP signal.1/31/2015 3Presented By: Md. Kafiul Islam](https://image.slidesharecdn.com/localfieldpotentialreview-150130231633-conversion-gate02/75/Local-Field-Potential-LFP-Literature-Review-3-2048.jpg)

The document provides an overview of local field potentials (LFPs), describing their components, origins, and frequency bands relevant to neural activity. It details findings from various studies correlating LFPs with behavior, emphasizing the importance of gamma oscillations and their relationship to stimulus encoding and spiking activity. Additionally, it discusses the complexities of neuronal oscillations within cortical networks and their role in information processing.


