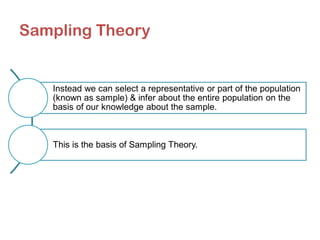
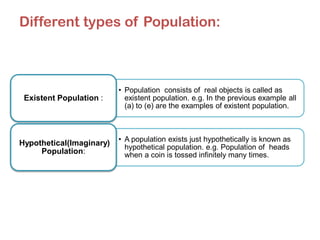
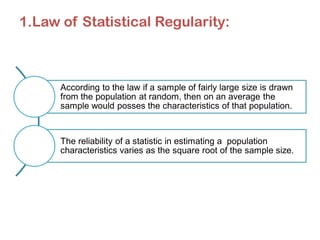
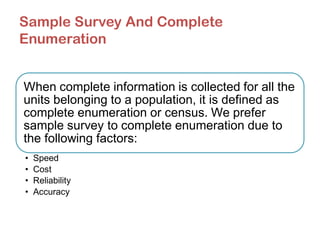
Sampling Theory
CPT Section D Quantitative Aptitude
Chapter 15
Prof. Bharat Koshti
Learning Objectives :
The different procedures of sampling which will be best
representative of the population.
The Concept of Sampling Distribution
The techniques of construction of Class Interval & its
interpretation.
How to determine the sample size with pre defined degree of
precision?.
Why Sampling?
We come across situations whose where we would like to know
about vast population.
But the factors like time, money, cost and large size of the
population make it almost impossible to go for the complete
enumeration of all the population.
Sampling Theory
Instead we can select a representative or part of the population
(known as sample) & infer about the entire population on the
basis of our knowledge about the sample.
This is the basis of Sampling Theory.
What is sampling ?
It is a process of learning about a population on the basis of
samples drawn from it.
Some important terms in sampling theory:
• (A) Population
• (B) Sample
• (C) Parameter
• (D) Statistic
A)Population
Population: It is a set of all units under consideration. e.g.
(a) Population of Income-tax Payers in India
(b) Population of all people living in Kolkata
(c) Population of employees working in a certain factory
(d) Population of cars produced by a certain company
(e) Population of flowers in a certain town.
Population Size:
The no. of members in the population is called
as the size of the population. It is denoted by N.
Different types of Population:
• Population consists of finite no. of elements is
called as finite population. e.g. In the previous
example all (a) to (d) are the examples of finite
population.
Finite
Population:
• Population consists of infinite or uncountable number
of units is known as infinite population. e.g. (e)
Infinite
Population:
Different types of Population:
• Population consists of real objects is called as
existent population. e.g. In the previous example all
(a) to (e) are the examples of existent population.
Existent Population :
• A population exists just hypothetically is known as
hypothetical population. e.g. Population of heads
when a coin is tossed infinitely many times.
Hypothetical(Imaginary)
Population:
(B) Sample
(B) Sample : It is a part of the population which is selected at random from the
population.
The number of members/units in the sample is known as the
sample size & is denoted by ‘n’.
-These units are known as “Sampling Units”.
-A detailed & complete list of sampling units is known as “Sampling frame”. It
must be updated.
Principles of Sample Survey
Sample Survey is the study of unknown population on the
basis of a proper representative sample drawn from it.
This study is based on the following principles:
• 1.Law of statistical regularity
• 2. Principle of Inertia
• 3. Principle of Optimization
• 4. Principle of Validity
1.Law of Statistical Regularity:
According to the law if a sample of fairly large size is drawn
from the population at random, then on an average the
sample would posses the characteristics of that population.
The reliability of a statistic in estimating a population
characteristics varies as the square root of the sample size.
2. Principle of Inertia :
According to this law as the results derived from the sample are
more likely to be reliable, accurate and precise as the sample size
increases, provided other factors are kept constant.
3.Principle of Optimization:
The principle of optimization ensures that an optimum level
of efficiency at a minimum cost or the maximum efficiency
at a given level of cost can be achieved if the selection of
an appropriate sampling design is done.
4. Principle of Validity :
The principle of validity states that a sampling design is valid
only if it is possible to obtain valid estimates and valid tests
about population parameters. Only a probability sampling
ensures this validity.
Sample Survey And Complete
Enumeration
When complete information is collected for all the
units belonging to a population, it is defined as
complete enumeration or census. We prefer
sample survey to complete enumeration due to
the following factors:
• Speed
• Cost
• Reliability
• Accuracy
Errors In Sample Survey
Every sampling is subjected to what is known as sampling fluctuation
which is called as sampling error. However, errors due to recording
observations, biases on the part of the enumerators, wrong and faulty
interpretation of data etc. are present in both sampling and census
and this type of error is termed as non-sampling errors.
(C) Parameter:
A parameter may be defined as a characteristic of a
population based on all the units of the population. It is
unknown and is estimated from the sample observations
taken from the population. e.g.
• Population Mean(µ)
• Population Proportion(P)
• Population Variance(σ2)
(D) Statistic
A statistic may be defined as a function of sample observations. If the
sample observations are denoted by (x1x2 x3……….. xn) then a statistic T
may be expressed as T = f(x1x2 x3……….. xn)
A statistic is used to estimate a particular population parameter. The
estimates of population mean, variance and population proportion are given
by Sample Mean(x̅),Sample Variance(s) and Sample Proportion(p).
Sampling Fluctuation
The variation in the values of a statistic is termed as “Sampling
Fluctuation”.
If we compute the value of a statistic, say mean, it is quite natural that the
value of the sample mean may vary from sample to sample as the sampling
units of one sample may be different from that of another sample.
e.g. If we take a random sample of 5 observations i.e. {20,27,38,30,35}
from the population of 100 units. Then its sample mean (x̅) is 30.
Now if we take another sample of 5 observations from the same population
as {25,36,33,37,44} then its sample mean (x̅) is 35. The difference between
these two sample means i.e. 35-30 = 5 is called as sampling fluctuation.
Sampling Distribution
We can obtain values of statistic from all possible samples of
given size with corresponding probabilities. This is called as
sampling distribution of a statistic.
• The mean of the statistic, obtained from its sampling distribution, is known
as “Expectation” and the standard deviation of the statistic T is known as
the “Standard Error (SE)“ of T.
• SE can be regarded as a measure of precision achieved by sampling.
• SE is inversely proportional to the square root of sample size. Thus
S.E.(T) α 1/√n̅
Standard Error for Mean
( )X
N n
SE (for SRS WOR)
N 1n
σ −
=
−
Standard Error(SE) of Mean
For sampling with replacement (SRSWR) SE(x̅) = σ / √n̅
For sampling without replacement(SRSWOR)
SE for Sample Proportion (P)
• SE for sample proportion (p)
Parameter
µ - Population Mean
s - Sample Standard Deviation
x̅ - Sample Mean
Statistic
σ – Population Standard
deviation
P - Population Proportion p - Sample Proportion
Notations in Parameter V/S Statistic
Number of Samples can be Drawn
In case of sampling with replacement the total
no. of samples that can be drawn is N
n
In case of sampling without replacement the
total no. of samples that can be drawn is NCn
Question Time
MCQ's
1. Statistical data may be collected by
complete enumeration is called
(a) Census inquiry
(b) Sample inquiry
(c) both
(d) none
Answer: A
2. Sampling can be described as a
statistical procedure
(a) To infer about the unknown universe from a knowledge of any
sample.
(b) To infer about the known universe from a knowledge of a
sample drawn from it.
(c) To infer about the unknown universe from a knowledge of a
random sample drawn from it.
(d) Both (a) and (b).
Answer: C
3. Statistical decision about an unknown
universe is taken on the basis of
(a) Sample observations
(b) A sampling frame
(c) Sample survey
(d) Complete enumeration
Answer: A
4. A Statistic is
(a) a function of sample observations.
(b) a function of a population units.
(c) a characteristic of a population.
(d) a part of a population.
Answer: A
5.The law of Statistical Regularity says
that
(a) Sample drawn from the population under discussion possesses the
characteristics of the population.
(b) A large sample drawn at random from the population would
possesses the characteristics of the population.
(c) A large sample drawn at random from the population would posses
the characteristics of the population on an average.
(d) An optimum level of efficiency can be attained at a minimum cost.
Answer: C
(a) The distribution of sample observations.
(b) The distribution of random sample.
(c) The distribution of a parameter.
(d) The probability distribution of a statistic.
Answer: d
MCQ.6:The sampling distribution is
(a) The variation in the values of a statistic.
(b) The variation in the values of a sample.
(c) The differences in the values of a parameter.
(d) The variation in the values of observations.
Answer: A
MCQ.7:Sampling fluctuations may be
described as
(a) Error in statistic
(b) Absolute error
(c) Percentage error
(d) Relative error.
Answer: A
MCQ. 8:The difference of the actual value and
the expected value using a model is
(a) square root of(N-1)/(N-n)
(b) square root of(N-n)/(N-1)
(c) square of(N-1)/(N-n)
(d) square of(N-n)/(N-1)
Answer: B
MCQ.9:Finite population multiplier is
(a) n/N
(b) N/n
(c) (n+1)/N
(d) (N+1)/n
Answer: A
MCQ.10:Sampling fraction is

Sampling Theory Part 1

  • 1.
    Sampling Theory CPT SectionD Quantitative Aptitude Chapter 15 Prof. Bharat Koshti
  • 2.
    Learning Objectives : Thedifferent procedures of sampling which will be best representative of the population. The Concept of Sampling Distribution The techniques of construction of Class Interval & its interpretation. How to determine the sample size with pre defined degree of precision?.
  • 3.
    Why Sampling? We comeacross situations whose where we would like to know about vast population. But the factors like time, money, cost and large size of the population make it almost impossible to go for the complete enumeration of all the population.
  • 4.
    Sampling Theory Instead wecan select a representative or part of the population (known as sample) & infer about the entire population on the basis of our knowledge about the sample. This is the basis of Sampling Theory.
  • 5.
    What is sampling? It is a process of learning about a population on the basis of samples drawn from it. Some important terms in sampling theory: • (A) Population • (B) Sample • (C) Parameter • (D) Statistic
  • 6.
    A)Population Population: It isa set of all units under consideration. e.g. (a) Population of Income-tax Payers in India (b) Population of all people living in Kolkata (c) Population of employees working in a certain factory (d) Population of cars produced by a certain company (e) Population of flowers in a certain town.
  • 7.
    Population Size: The no.of members in the population is called as the size of the population. It is denoted by N.
  • 8.
    Different types ofPopulation: • Population consists of finite no. of elements is called as finite population. e.g. In the previous example all (a) to (d) are the examples of finite population. Finite Population: • Population consists of infinite or uncountable number of units is known as infinite population. e.g. (e) Infinite Population:
  • 9.
    Different types ofPopulation: • Population consists of real objects is called as existent population. e.g. In the previous example all (a) to (e) are the examples of existent population. Existent Population : • A population exists just hypothetically is known as hypothetical population. e.g. Population of heads when a coin is tossed infinitely many times. Hypothetical(Imaginary) Population:
  • 10.
    (B) Sample (B) Sample: It is a part of the population which is selected at random from the population. The number of members/units in the sample is known as the sample size & is denoted by ‘n’. -These units are known as “Sampling Units”. -A detailed & complete list of sampling units is known as “Sampling frame”. It must be updated.
  • 11.
    Principles of SampleSurvey Sample Survey is the study of unknown population on the basis of a proper representative sample drawn from it. This study is based on the following principles: • 1.Law of statistical regularity • 2. Principle of Inertia • 3. Principle of Optimization • 4. Principle of Validity
  • 12.
    1.Law of StatisticalRegularity: According to the law if a sample of fairly large size is drawn from the population at random, then on an average the sample would posses the characteristics of that population. The reliability of a statistic in estimating a population characteristics varies as the square root of the sample size.
  • 13.
    2. Principle ofInertia : According to this law as the results derived from the sample are more likely to be reliable, accurate and precise as the sample size increases, provided other factors are kept constant.
  • 14.
    3.Principle of Optimization: Theprinciple of optimization ensures that an optimum level of efficiency at a minimum cost or the maximum efficiency at a given level of cost can be achieved if the selection of an appropriate sampling design is done.
  • 15.
    4. Principle ofValidity : The principle of validity states that a sampling design is valid only if it is possible to obtain valid estimates and valid tests about population parameters. Only a probability sampling ensures this validity.
  • 16.
    Sample Survey AndComplete Enumeration When complete information is collected for all the units belonging to a population, it is defined as complete enumeration or census. We prefer sample survey to complete enumeration due to the following factors: • Speed • Cost • Reliability • Accuracy
  • 17.
    Errors In SampleSurvey Every sampling is subjected to what is known as sampling fluctuation which is called as sampling error. However, errors due to recording observations, biases on the part of the enumerators, wrong and faulty interpretation of data etc. are present in both sampling and census and this type of error is termed as non-sampling errors.
  • 18.
    (C) Parameter: A parametermay be defined as a characteristic of a population based on all the units of the population. It is unknown and is estimated from the sample observations taken from the population. e.g. • Population Mean(µ) • Population Proportion(P) • Population Variance(σ2)
  • 19.
    (D) Statistic A statisticmay be defined as a function of sample observations. If the sample observations are denoted by (x1x2 x3……….. xn) then a statistic T may be expressed as T = f(x1x2 x3……….. xn) A statistic is used to estimate a particular population parameter. The estimates of population mean, variance and population proportion are given by Sample Mean(x̅),Sample Variance(s) and Sample Proportion(p).
  • 20.
    Sampling Fluctuation The variationin the values of a statistic is termed as “Sampling Fluctuation”. If we compute the value of a statistic, say mean, it is quite natural that the value of the sample mean may vary from sample to sample as the sampling units of one sample may be different from that of another sample. e.g. If we take a random sample of 5 observations i.e. {20,27,38,30,35} from the population of 100 units. Then its sample mean (x̅) is 30. Now if we take another sample of 5 observations from the same population as {25,36,33,37,44} then its sample mean (x̅) is 35. The difference between these two sample means i.e. 35-30 = 5 is called as sampling fluctuation.
  • 21.
    Sampling Distribution We canobtain values of statistic from all possible samples of given size with corresponding probabilities. This is called as sampling distribution of a statistic. • The mean of the statistic, obtained from its sampling distribution, is known as “Expectation” and the standard deviation of the statistic T is known as the “Standard Error (SE)“ of T. • SE can be regarded as a measure of precision achieved by sampling. • SE is inversely proportional to the square root of sample size. Thus S.E.(T) α 1/√n̅
  • 22.
    Standard Error forMean ( )X N n SE (for SRS WOR) N 1n σ − = − Standard Error(SE) of Mean For sampling with replacement (SRSWR) SE(x̅) = σ / √n̅ For sampling without replacement(SRSWOR)
  • 23.
    SE for SampleProportion (P) • SE for sample proportion (p)
  • 24.
    Parameter µ - PopulationMean s - Sample Standard Deviation x̅ - Sample Mean Statistic σ – Population Standard deviation P - Population Proportion p - Sample Proportion Notations in Parameter V/S Statistic
  • 25.
    Number of Samplescan be Drawn In case of sampling with replacement the total no. of samples that can be drawn is N n In case of sampling without replacement the total no. of samples that can be drawn is NCn
  • 26.
  • 27.
    1. Statistical datamay be collected by complete enumeration is called (a) Census inquiry (b) Sample inquiry (c) both (d) none Answer: A
  • 28.
    2. Sampling canbe described as a statistical procedure (a) To infer about the unknown universe from a knowledge of any sample. (b) To infer about the known universe from a knowledge of a sample drawn from it. (c) To infer about the unknown universe from a knowledge of a random sample drawn from it. (d) Both (a) and (b). Answer: C
  • 29.
    3. Statistical decisionabout an unknown universe is taken on the basis of (a) Sample observations (b) A sampling frame (c) Sample survey (d) Complete enumeration Answer: A
  • 30.
    4. A Statisticis (a) a function of sample observations. (b) a function of a population units. (c) a characteristic of a population. (d) a part of a population. Answer: A
  • 31.
    5.The law ofStatistical Regularity says that (a) Sample drawn from the population under discussion possesses the characteristics of the population. (b) A large sample drawn at random from the population would possesses the characteristics of the population. (c) A large sample drawn at random from the population would posses the characteristics of the population on an average. (d) An optimum level of efficiency can be attained at a minimum cost. Answer: C
  • 32.
    (a) The distributionof sample observations. (b) The distribution of random sample. (c) The distribution of a parameter. (d) The probability distribution of a statistic. Answer: d MCQ.6:The sampling distribution is
  • 33.
    (a) The variationin the values of a statistic. (b) The variation in the values of a sample. (c) The differences in the values of a parameter. (d) The variation in the values of observations. Answer: A MCQ.7:Sampling fluctuations may be described as
  • 34.
    (a) Error instatistic (b) Absolute error (c) Percentage error (d) Relative error. Answer: A MCQ. 8:The difference of the actual value and the expected value using a model is
  • 35.
    (a) square rootof(N-1)/(N-n) (b) square root of(N-n)/(N-1) (c) square of(N-1)/(N-n) (d) square of(N-n)/(N-1) Answer: B MCQ.9:Finite population multiplier is
  • 36.
    (a) n/N (b) N/n (c)(n+1)/N (d) (N+1)/n Answer: A MCQ.10:Sampling fraction is