SlideShare a Scribd company logo
1 of 74
SAMPLING
Dr. Perini PraveenaSri, Associate Professor
Atria Institute of Technology
Learning Objectives
Comprehend the basic concepts of sampling theory.
Understand the reasons for sampling.
Identify the basic sampling techniques.
Comparing pros and cons of different probability sampling methods
Demonstrate knowledge of basic sampling methods.
Apply sampling theory in business and economics.
BASIC CONCEPTS OF SAMPLING
Why Sample?
In many situations even though we are very much interested in some characteristics of a specific
population , we cannot physically examine the entire population due to
Cost
Time
And other Limitations
In such instances , we examine only a part of population by means of sample with the
expectation that the sample will be the representative of the population under study.
(A) POPULATION:
It is a group of all elements /observations (persons, animals, objects, measurements, etc) under consideration in a
certain problem. It is also collection of objects having certain well defined attributes.
Examples :
(i) The population of AICTE accredited technical colleges in Tamil Nadu
(ii) The population of private hospitals in Karnataka
(iii) All households in Bellary town.
(B) Sample:
It is a portion of population
Examples:
(i) Collection of AICTE accredited technical colleges of Tamilnadu with minority status ie. ST/SC
(ii) Collection of Private Hospitals in Bangalore
(iii) Collection of households who are possessed with white colour jobs (A group of persons performing
professional, administrative and managerial work)
(C)Parameter:
It is any measurable characteristic of a population.
Example: Population means, Population standard deviations, population medians, etc.
(D)Statistic:
It is a number resulting from manipulation of sample data. That is, it is any measurable characteristic of a sample.
Example: sample means, sample standard deviations, sample medians, etc. A statistic is used to estimate a
population parameter such as Population mean , Population standard deviation etc.
(E) The sampling error:
It is the difference between a sample statistic and its corresponding population parameter. It is the error that
occurs because a sample has been taken instead of a census. For example: the sample mean may differ from the
true population mean.
Sampling error is the deviation of the selected sample from the true characteristics, traits, behaviors, qualities or
figures of the entire population.
(F) Census:
It is a collection of data from the whole population (that is, complete enumeration). It is the actual measurement
or observation of all possible elements from the population or it is a survey of everyone in the population.
(G) Target population:
It is the population of interest, to which the researcher would like to generalize the results of the study.
Example: If a researcher would like to study the effect of a new fertilizer on crop yield in Ethiopia, then the
reference population is all farmers in Ethiopia who are using the new fertilizer.
(E)Sampling:
It is the process conducting the selection of a finite number of elements from a given population of
interest for purposes of an inquiry. it is a process of taking samples from a population of interest for
purpose of an inquiry.
Example: in industry, the quality of a product is assessed through sampling; the public opinion on
social, economical and political problems is ascertained through sampling.
(I) Sampling unit:
It is the ultimate unit to be sampled (elements of the population to be sampled).it is the unit of selection in the
sampling process.
Examples: in a sample of households, the sampling unit is a household; in a sample of students, a student is
the sampling unit. in a sample of districts, the sampling unit is a district, etc.
(J) Sampling Frame:
It is the list of all possible units in the reference population, from which a sample is to be drawn.
Example: If a researcher would like to do a research on poverty levels of residents in a town and if he decided
that the sampling unit for the study is an individual, then the sampling frame would be the list of all individuals
living in that town. A student roster is a sampling frame for a sample of students.
Sample Survey
A sample survey is a study that obtains data from a subset of a population, in order to estimate population attributes. A sample
survey is a survey which is carried out using a sampling method,
A survey is the systematic collection of information from different individuals. A questionnaire is a survey tool while a survey is
the process of using questionnaires to gather information.
Degrees of Freedom :
It means the number of items to be selected freely out of n items. It is denoted by df.
Example: Select three integer numbers in such away that their addition leads to the value 100.
40+10+50= 100
One can choose only two items freely and the selection of third value cannot be made freely . If you select 40 and 10, then the
third value should be 50.
Degrees of freedom, df = 3-1= 2
Notations:
N= Population size
µ= population mean
σ= Population Standard Deviation
P= Population Proportion
n= Sample Size
x̄ = Sample mean
s= Sample Standard Deviation
p = Sample Proportion
R= Population correlation Coefficient
r= Sample Correlation Coefficient
FORMULAS OF SAMPLING DISTRIBUTION
Sample Mean : x̄ = ( Σ xi ) / n
• x̄ just stands for the “sample mean”
• Σ means “add up”
• xi “all of the x-values”
• n means “the number of items in the sample”
Sample Variance:
1. Find the mean of the set of data.
2. Subtract each number from the mean.
3. Square the result.
4. Add the results together.
5. divide the result by the total number of numbers in the data set minus one.
Population Mean
Population Variance :
1.Find the mean of the set of data.
2. Subtract each number from the mean.
3. Square the result.
4. Add the results together.
5. Divide the result by the total number of numbers in the data set minus one.
REASONS FOR SAMPLING
Even if a decision maker can take a census, there are often reasons to sample. The reasons fall into the
following categories:
1. Time constraint: the major advantage of sampling is that it is much faster than taking a census.
2. Cost constraint: the cost of taking a census is greater than that of a sample.
3. Improved accuracy: the result of a sample may be more accurate than the result of a census. A
person gathering data from fewer sources tends to be more complete and thorough in both gathering
and tabulation. There are likely to be fewer human errors than census.
4.Impossibility of census: sometimes taking a complete census to gather information is economically
impossible. Obtaining information may require a change, or destruction of the item from which
information is being gathered.
TYPES OF SAMPLING: PROBABILITY AND NON PROBABILITY SAMPLING
Probability Sampling:
A probability sample is a sample selected such that each item in the population being studied has a known chance (greater
than zero) of being included in the sample. These methods remove human judgment from the sampling process and
ensure a more representative sample and it has certain basic features.
Non Probability Sampling:
Non-probability sampling technique does not give equal chance that each element of the population will be included in the
sample. Units are selected at the discretion of the researcher. Such samples derive their control from the judgment of the
researcher.
WHAT ARE THE STEPS INVOLVED IN PROBABILITY SAMPLING?
1. choose your population of interest carefully: carefully think and choose from the population,
people you think whose opinions should be collected and then include them in the sample.
2. Determine a suitable sample frame: your frame should include a sample from your population
of interest and no one from outside in order to collect accurate data.
3. select your sample and start your survey: it can sometimes be challenging to find the right
sample and determine a suitable sample frame. even if all factors are in your favor, there still might be
unforeseen issues like cost factor, quality of respondents and quickness to respond. getting a sample to
respond to true probability survey might be difficult but not impossible.
But, in most cases, drawing a probability sample will save you time, money, and a lot of frustration.
you probably can’t send surveys to everyone but you can always give everyone a chance to
participate, this is what probability sample is all about.
EXAMPLES: PROBABILITY SAMPLING
If you have a population of 100 people every person would have odds of 1 in 100 for getting
selected. probability sampling gives you the best chance to create a sample that is truly
representative of the population.
• For example, consider hypothetically an organization has 500,000 employees sitting at different
geographic locations. The organization wishes to make certain amendment in its human resource
policy, but before they roll out the change they wish to know if the employees will be happy with
the change or not. However, it’s a tedious task to reach out to all 500,000 employees. This is
where probability sampling comes handy. A sample from the larger population i.e from 500,000
employees can be chosen. This sample will represent the population. A survey now can be
deployed to the sample.
• From the responses received, management will now be able to know whether employees in that
organization are happy or not about the amendment.
WHEN TO USE PROBABILITY SAMPLING
1. when the sampling bias has to be reduced: this sampling method is used when the
bias has to be minimum. the selection of the sample largely determines the quality of the
research’s inference. how researchers select their sample largely determines the quality of a
researcher’s findings. probability sampling leads to higher quality findings because it provides
an unbiased representation of the population.
2. when the population is usually diverse: when your population size is large and diverse
this sampling method is usually used extensively as probability sampling helps researchers
create samples that fully represent the population. say we want to find out how many people
prefer medical tourism over getting treated in their own country, this sampling method will help
pick samples from various socio-economic strata, background etc to represent the bigger
population.
3. To create an accurate sample: probability sampling help researchers create an accurate
sample of their population. researchers can use proven statistical methods to draw accurate
sample size to obtained well-defined data.
ADVANTAGES OF PROBABILITY SAMPLING
1. It’s cost-effective: this process is both cost and time effective
and a larger sample can also be chosen based on numbers
assigned to the samples and then choosing random numbers from
the bigger sample. work here is done.
2. It’s simple and easy: probability sampling is an easy way of
sampling as it does not involve a complicated process. its quick
and saves time. the time saved can thus be used to analyze the
data and draw conclusions.
3.It non-technical: this method of sampling doesn’t require any
technical knowledge because of the simplicity with which this can
be done. this method doesn’t require complex knowledge and its
not at all lengthy.
Non-probability sampling: definition
Non-probability sampling is a sampling technique in which the researcher selects
samples based on the subjective judgment of the researcher rather than random
selection.
In non-probability sampling, not all members of the population have a chance of
participating in the study unlike probability sampling, where each member of the
population has a known chance of being selected.
Non-probability sampling is most useful for exploratory studies like pilot survey
(a survey that is deployed to a smaller sample compared to pre-determined sample
size). non-probability sampling is used in studies where it is not possible to draw
random probability sampling due to time or cost considerations.
Non-probability sampling is a less stringent method, this sampling method depends
heavily on the expertise of the researchers. non-probability sampling is carried out by
methods of observation and is widely used in qualitative research.
SAMPLING BASED ON TWO SPECIFIC PRINCIPLES
Principle 1: Law of Statistical Regularity
This law implies that a reasonably large number of items are selected at
random from population such a way that the characteristics of the population
and the sample are equal .
Principal 2: Law of Inertia of Law of large numbers
This law reveals that wherever the sample is quite large, the inference will be
very close to the actual.
SIMPLE RANDOM SAMPLING
• In Simple random sampling, each item in the population has a known, the same, non- zero
chance of being included in the sample. Random samples are selected by using methods such as
random numbers (which can be generated from computers) or lottery method.
• To select a simple random sample you need to follow the following procedures:
• Make a numbered list of all units in the population (sampling frame),
• Each unit on the list should be numbered in sequence from 1 to N (where N is the size of
the population),
• Select the required number of study units, using a
"lottery" or a table of random numbers.
EXAMPLES : LOTTERY METHOD IN SIMPLE RANDOM SAMPLING
Procedure:
1)numbered or named papers representing a unit in the population are placed in a hat. i.e. 1000
papers
2) the papers are thoroughly mixed and the number of papers equal to the sample size is selected
from the hat. for a sample of 200 students, the researcher would select 200 papers.
3) the sample then consists of all units of the population corresponding to the selected papers.
ACTIVITY: 1.7
We chose a very small population-the five top Oklahoma state officials-to
illustrate simple random sampling.
In practice, we would not sample from such a small population but would instead take a census.
Using a small population here makes understanding the concept of simple random sampling
easier.
ACTIVITY 1: SIMPLE RANDOM SAMPLING
EXAMPLE: RANDOM SAMPLE NUMBERS IN SIMPLE RANDOM SAMPLING
Procedure:
Different methods and tools can be used for creating random numbers for sample selection. Standard random
number tables and soft-wares with ability of generating random numbers like Open-Epi or Stata are available.
1) The researcher assigns a number to each unit of the population and constructs the random table.
2) Then s/he randomly selects a starting place (point), goes through the table across the rows or down the columns and lists the
numbers as they appear on the table.
3) Members of the population with the selected numbers constitute the sample.
4) A random number table is a list of numbers generated by a computer that has been
programmed to yield a set of random numbers.
5) It is possible for a unit's number to be selected more than once.
Example:
You have been asked to perform a survey in a prison. The list of all 2000 prisoners has been given to you. You think that a
sample of 300 would be satisfactory for your work. If you want to choose 300 of them for interview randomly, you can use a
random number generator to generate 300 numbers between 1 and 2000.
Most of the time you would have some repeated numbers that should be replaced by new numbers.
ACTIVITY 2 : RANDOM SAMPLE NUMBERS IN SIMPLE RANDOM SAMPLING
• Obtaining a simple random sample by picking slips of paper out of a box is usually impractical,
especially when the population is large. Fortunately, we can use several practical procedures to
get simple random samples. One common method involves a table of random numbers-a table of
randomly chosen digits, as illustrated in activity 1.8 .
ADVANTAGES AND DISADVANTAGES: SIMPLE RANDOM SAMPLING
• Advantage of Simple random Sampling
 Ensures that the sample is unbiased in that every individual and every sample
has an advantage of being chosen.
 SRS is the basic sampling method assumed in survey statistical computations. This can be used with
confidence.
• Disadvantages of Simple random sampling
 Simple random sampling requires a sampling frame and this is sometimes impossible.
 It is difficult to take samples if the reference population is scattered.
 If the population is extremely large, it is tedious and time consuming to number and select the sample.
 Minority subgroups of interest in the population may not be represented in the sample.
SYSTEMATIC SAMPLING OR (QUASI- RANDOM SAMPLING)
• In systematic sampling, the elements to be included in a sample are picked at a constant interval. That is, the
items or individuals of the population are arranged in some order and a random starting point is selected from 1 through k.
• 𝐾 =
𝑝𝑜𝑝𝑢𝑙𝑎𝑡𝑖𝑜𝑛 𝑠𝑖𝑧𝑒
𝑠𝑎𝑚𝑝𝑙𝑒 𝑠𝑖𝑧𝑒
=
𝑁
𝑛
and every Kth member of the population is selected for the sample.
• K-represents a sampling interval.
• Example 1: Suppose there are 2000 subjects in the population and a sample size of 50 subjects are needed. Select a systematic
sample of these 50 subjects.
• Solution: The sampling interval (k) is 40= (
2000
50
). The number of the first subject to be included in the sample is chosen randomly,
for example, by blindly picking up one out of 40 pieces of paper numbered 1 to 40 (in the form of lottery method). Suppose
subject 12 was the first subject selected, then the sample would consist of samples whose numbers were 12, 52, 92, etc
until 50 subjects (samples) are obtained. Note that the second subject 52 is obtained by adding 12 to 40, similarly, the third
element 92 is obtained by adding 52 to 40, etc. That is the sample interval (k) will be added to each subsequent elements.
• It is obvious that a sample chosen through this way is not strictly random since not all the members of the population have an
equal chance of being selected.
Example 2: Suppose a researcher wants to know the impact of microfinance on the clients' household income. she
wishes to select 10 clients out of 250 clients and a research assistant is required to select systematic samples.
Assuming that you are a research assistant, select a systematic sample of 10 clients.
Solution:
1. number each client from 1 to 250 (based on alphabet of their names or identity numbers).
2. since there are 250 clients and 10 are to be selected, the rule is to select every 25 clients. this rule is determined
by dividing 250 by 10 which gives 25,
3. the number of the first subject to be included in the sample is chosen randomly from numbers 1 to 25. in this
case let us select number 5 randomly.
4. then select every 25 number on the list starting from 5. the numbers include the following: 5,
30, 55, 80, 105, 130, 155,180, 205 and 230. therefore, clients with these numbers will be included in the sample
for analysis purpose.
ACTIVITY 3: SYSTEMATIC RANDOM SAMPLING
ADVANTAGES AND DISADVANTAGES: SYSTEMATIC SAMPLING
• Advantages of Systematic Sampling:
 Less time consuming and easier to perform than SRS,
 It is more convenient to use as compared to SRS,
 It provides a good approximation to simple random sampling.
• Disadvantages of Systematic Sampling:
• If there is any sort of cyclic ordering of the subjects, the samples will not be representative of population. Example: If subjects in the population are
arranged in a manner such as:
• 1) Defective item
• 2) Non-defective item
• 3) Defective item
• 4) Non-defective item
• That is the selection of the starting point could produce a sample of all defective items or non-defective items depending on whether the
number to be added (k) is even or odd.
• Example: starting point =defective item +even k=all defective item in the sample and starting point =non-defective
item +even k=all non-defective items in the sample.
CLUSTER SAMPLING
• If the population is homogeneous and very large or resides in a large area, it is costly and time consuming to take
samples . In this case, we divide the population in to groups called clusters and then we select representative
clusters randomly. Finally, the samples will be taken from the sample clusters. We can take either all members of
the sample clusters or we may select samples from the clusters by using other sampling techniques such as random
sampling and systematic sampling . But, there are big barriers among the clusters such as big rivers, dense forest or
administrative boundary.
Procedure:
• 1) The reference population is divided in to clusters or subgroups, preferably similar in size,
• 2) A sample of the clusters is taken by random or systematic sampling,
• 3) All the units in the selected clusters are then studied or we may select samples from each cluster. If part of the
elements in each cluster is included in the sample, then the procedure is called two stage sampling. The first stage is
selecting a sample of clusters from clusters and the second stage is selecting a sample of elements from each
cluster.
EXAMPLE : CLUSTER SAMPLING
ACTIVITY 4: CLUSTER SAMPLING
EXAMPLE : DISADVANTAGE OF CLUSTER SAMPLING
ADVANTAGES AND DISADVANTAGES OF CLUSTER SAMPLING
 Advantages:
A list of all individual study units in the reference population is not required.
reduces cost
 Simplify field work and it is convenient
Disadvantage:
The members of the clusters are often more homogeneous than the members of the whole
population and therefore, it may not be representative.
The elements in a cluster may not have the same variation in characteristics as elements
selected individually from the population.
ACTIVITY5: STRATIFIED SAMPLING
STRATIFIED SAMPLING
• In stratified sampling, a population is first divided into subgroups, called strata (singular stratum), and a sample
is selected from each stratum based on simple random or systematic sampling method.
• The strata are made according to various homogeneous characteristics such as sex, race, region or institutional
affiliation such as faculty. This sampling method is appropriate when the distribution of the characteristic to be
studied is strongly affected by certain variables.
Note: Stratified sampling is applied if the population is heterogeneous.
• Stratified sampling can also be proportionate or non-proportionate. In the latter case, an equal number of elements
are drawn from each stratum while in the former case a proportionate number is obtained.
a) Proportionate Stratified Sampling: Number of units selected from each stratum is directly proportional to the
size of the strata. If P represents the proportion of population included in ith stratum i,
and n represents the total sample size, the number of elements selected from stratum i
is nxPi
b) Non- proportional sampling: the number of items studied in each stratum is disproportionate to the respective
members in the population. In this regard, an equal number of elements are selected from each stratum.
EXAMPLE: Let us suppose that we want a sample size of 30 to be drawn from a population size of 8000 which is divided in to
three strata of size 4000, 2400 and 1600.
i) adopting proportional allocation, find the sample sizes under each stratum.
ii) by using non-proportional sample select 30 individuals from each stratum.
solution:
i) we shall get the sample size for the different strata:
a. STRATA OF SIZE n1=4000, we have p1 =4000/8000=0.5 and hence n1 =n. p1 =30*0.5=15
b. STRATA OF SIZE n2 =2400, we have p2 =2400/8000=0.3 and hence n2 =n. p2 =30*0.3=9
c. STRATA OF SIZE n3 =1600, we have p3 =1600/8000=0.2 and hence n3 =n. p3 =30*0.2=6
therefore, using proportional allocation, the sample sizes for different strata are 15, 9 and 6 respectively which is in proportion for
the sizes of the strata namely 4000:2400:1600.
1) n= n1+ n2+ n3;
2) n= n1+ n2+ n3 and
3) p1+ p2+ p3=1.
ii) to get the non proportional sample size, since we have a total of three stratum (subgroups) and the sample to be selected is 30,
we divide 30 by 3 which is equal to 10. this means we have to select 10 elements from the three stratum regardless of the number of
elements in each stratum.
EXAMPLE: STRATIFIED SAMPLING
ADVANTAGES AND DISADVANTAGES OF STRATIFIED SAMPLING
• Advantage: The representation of the sample is improved
• Disadvantages:
 If there are many variables of interest, dividing a large population in to representative
subgroups requires a great deal of effort,
 If variables are somewhat complex or ambiguous (such as beliefs, attitudes, etc), it is
difficult to separate individuals in to the sub groups according to these variables.
MULTISTAGE SAMPLING
• Contrary to its name, multi-stage sampling can be easy to apply in business studies. Application of this
sampling method can be divided into four stages:
1. Choosing sampling frame, numbering each group with a unique number and selecting a small sample of
relevant discrete groups.
2. Choosing a sampling frame of relevant discrete sub-groups. This should be done from relevant discrete groups
selected in the previous stage.
3. Repeat the second stage above, if necessary.
4. Choosing the members of the sample group from the sub-groups using some variation of probability sampling.
Let’s illustrate the application of the stages above using a specific example.
Your research objective is to evaluate online spending patterns of households in the US through online
questionnaires. You can form your sample group comprising 120 households in the following manner:
Choose 6 states in the USA using simple random sampling (or any other probability sampling).
Choose 4 districts within each state using systematic sampling method (or any other probability sampling).
Choose 5 households from each district using simple random or systematic sampling methods. This will
result in 120 households to be included in your sample group. i.e. 6x 4 x 5 = 120
Advantages of multi-stage sampling
Effective in primary data collection from geographically dispersed. population when face-To-face contact in
required (e.g. semi-structured in-depth interviews)
Cost-effectiveness and time-effectiveness.
High level of flexibility.
Disadvantages of multi-stage sampling
High level of subjectivity.
Research findings can never be 100% representative of population.
The presence of group-level information is required.
Area sampling is a method in which an area to be sampled is sub-divided into smaller blocks that are then
selected at random and then again sub-sampled or fully surveyed.
This method is typically used when a complete frame of reference is not available to be used.
NON PROBABILITY SAMPLING
• Non-probability sampling technique does not give equal chance that each element of the population will be
included in the sample. Units are selected at the discretion of the researcher. Such samples derive their control
from the judgment of the researcher. Some of the
Disadvantages of non-probability sampling are of the following:
 No confidence can be placed in the data obtained from such samples; they don't represent the large
population. Therefore, the result obtained may not be generalized for the entire population.
 Non-probability sampling depends exclusively on uncontrolled factors and researcher's insight, and there is
no statistical method to determine the margin of the sampling errors.
 Sometimes such samples are based on an absolute frame, which does not adequately cover the population.
The advantages of non-probability sampling
It is that it is much less complicated, less expensive, and a researcher may take the advantage of the
available respondents with out the statistical complexity of the probability sampling.
More over it is very convenient in the situation when the sample to be selected is very small and the
researcher wants to get some idea of the population characteristics
Non-probability sampling can be adequate if the researcher has no desire to generalize his findings beyond the
sample, or if the study is merely a trial run for larger study (in preliminary research).
This sampling technique is:
(a) It is used when a sampling frame doesn't exist,
(b) it is non-random selection (unrepresentative)
(c )inappropriate if the aim is to measure variables and generalize findings
(d) easier, quicker and cheaper to carryout than probability designs.
Convenience sampling:
It is a method in which a sample is chosen with ease of access being the primary concern. It selects anyone
who is convenient, it can produce, ineffective, highly unrepresentative sample and is not recommended, it
has high bias and systematic errors.
It is least reliable but cheap and easy to collect. there is no control to ensure precision. ex: the person on
the street interviewed for a television program, or interviews conducted in convenient locations such as
student lounge.
EXAMPLES
Examples:
One of the most common examples of convenience sampling is using student volunteers as subjects for the
research. Another example is using subjects that are selected from a clinic, a class or an institution that is easily
accessible to the researcher.
Purposive (judgmental) sampling:
The researcher exercises deliberate subjective choice in drawing samples what s/he regards as more
informative for a study undergoing.
when one draws a non-probability sample that confirms to a certain criteria, it is called purposive sampling. it
occurs when one picks sample members to conform to some criteria.
.
Examples:
1.The researcher selects units to be sampled based on his own existing knowledge, or his professional judgment
2. Imagine a group of researchers that is interested in what it takes for American youths to graduate from high school by age 14,
instead of the typical graduation age of 18 years old.
It would not serve the researchers any benefit to use a random sample that includes a significant amount of youths that are on track to
graduate at the traditional age of 18 years old.
Instead, the researchers should focus only on the members of the population that fit the criteria and interests of their study -- in this
case, youths that have skipped one or several grades and are on track to graduate at age 14.
in this case, judgment sampling is the only viable option for obtaining information from a very specific group of people.
Quota sampling:
It is a method that ensures that a certain number of sample units from different categories with specific characteristics are
represented. here, judgmental and convenience sampling methods are combined.
Quota sampling can be applied for affirmative action.
Example: suppose we know that 54% of the adults in a community are females, and the study requires 100 respondents as a
sample. in quota sampling, we might interview the first 54 females and the first 46 males
Snowball sampling:
It is also called network, chain referral or computational sampling is a method for identifying and sampling or selecting
the case in a network.
It begins with one or a few people or cases and spreads out on the basis of links to the initial case. snowball sampling is
a judgment sample used to sample special populations.
The researcher locates an initial set of respondents. these respondents are used as informants to identify others with
desired characteristics.
Example:, People who have many friends are more likely to be recruited into the sample. when virtual social networks are
used, then this technique is called virtual snowball sampling.
PROBLEMS IN SAMPLING
1. Non sampling errors: This refers to :
(i) Non-coverage error: this refers to sample frame defects: Ex: omission of part of the population; soldiers,
students, people in hospital are typically excluded from national survey (but not series). It is serious in telephonic
surveys since those who do not have a telephone are excluded. It also occurs when the cost used for sampling are
incomplete.
(ii) The wrong population is sampled: Be sure that the group being sampled is drawn from the population. Ex:
drawing a sample of college students generalize about all college age persons.
(iii) Non-response error: The response rate is low. Some people refuse to be interviewed because they are too busy,
or simply do not trust the interviewer or they may not be interested to.
(iv) Instrumental errors: instrument device to collect data (Ex: questionnaire), Ex: when questionnaire is badly
worded or asked, leading questions or carelessly worded questions may be misinterpreted.
(v) Interviewer errors: When some characteristics of the interviewer (age, sex, etc) affects the way in which the
respondent answers questions. Ex: Questions about racial discriminations might be differently answered depending
on the racial group of the interviewer.
•
SAMPLING ERRORS
Cause of sampling error
The cause of the error discussed may be due to the biased sampling procedure.
Every research should select sample(s) that is free from any bias and the sample(s) is
representative of the entire population of interest.
Another cause of this error is chance. the process of randomization and probability
sampling is done to minimize the sampling process error but it is still possible that all
the randomized subjects/ objects are not the representative of the population.
WAYS TO REDUCE SAMPLING ERRORS
 Increasing the sample size
The sampling error can be reduced by increasing the sample size. If the sample size n is equal to
the population size N, then the sampling error will be zero.
• Improving the sample design i.e. By using the stratification
The population is divided into different groups containing similar units.
NUMERICAL ILLUSTRATION
Child (x) 1 2 3 4 5
Age 2 4 6 8 10
Illustration: suppose that a baby sitter has 5 children under her supervision. The average age of these five children is 6 years
and the age of each child.
A CASE STUDY METHOD: SAMPLING
RANDOM SAMPLING ISSUES IN A FEDERAL COURT CASE, A CASE STUDY
KRISTIN KENNEDY AND JAMES BISHOP BRYANT UNIVERSITY, USA
• The authors of this paper, statistics professors at Bryant University, recently had the opportunity to
act as expert witnesses in a case involving the Internal Revenue Service (IRS) as the plaintiff.
• The IRS used some sampling techniques in selecting a random sample that did not appropriately
represent the population at hand. This action led the IRS to draw inferences about the population
that were not likely conclusions on their part.
• The purpose of this paper is to highlight the fact that fundamental mistakes are made in the
business and legal world regarding sampling. This legal case is a good case study
The defendant was the owner of a tax preparation firm with several locations, and
he was directly or indirectly responsible for the preparation and filing of at least
24,399 federal income tax returns for the tax years 2003 through 2007.
The IRS stated that they reviewed 345 returns of the 24,399 identified. Of the
345 which the IRS reviewed, 313 resulted in needing additional tax
assessment.
The IRS calculated from these 345 returns that the actual tax loss directly due to
these returns being improperly prepared by the defendant(s) was in excess of
$1.1 million .
The IRS further stated that if this rate loss were applied to all 24,399 returns, then
the estimated loss to the United States government would be in excess of
$85 million for the years 2003 through 2007 (United States) .
Thus the IRS was looking for damages close to 85 million dollars.
 A simple random sample of n=345 is taken from the overall population, and 1.1 million dollars worth of
discrepancies are found.
(a) The IRS computed this number using a simple ratio of 1.1/313 = x/24,399.
(b) This ratio calculates to x = 85.7 million, which similar to the figure they stated.
(c ) The IRS should have used the ratio of 1.1/345 = x/24,399, and this ratio calculates to x = 77.8
million.
There is almost an $8 million dollar difference in the two calculations.
The Statistical professional stated professionally that, the first
serious error was a fundamental sampling selection error.
As we teach in any elementary statistics class, good statistical sampling is performed randomly from a
population or sub-population. 345 returns could have been randomly selected from the entire
population, and the analysis could then be performed by standard statistical methods.
The IRS ignored stratified sampling from the population.
For example, suppose the population of 24,399 had 61.5% returns with a schedule c attached.
then 15,005 of the returns have a schedule c, and 38.5% of the returns for 9,394 pop.
When the stratified sample is taken, 61.5% of 345, or 212, should be selected with schedule c
and 38.5% of 345, or 133, should be selected without schedule c.
A second approach to this problem would be to stratify the population. Suppose there are 4
different office locations, 4 different income levels of the clients, and 4 different years of
returns. The number of sub-populations for stratifying is 4*4*4 = 64
This case study was a straight forward case that due to lack of implementation of well designed
statistical techniques, the experts quoted that the IRS failed in its approach of fairness and
professionalism, by unnecessarily framing defendant convicted, for which in reality the tax
owner was correct and accurate.
REFERENCES
1. Kothari, Vishwa Prakashan- Research Methodology
2. Random sampling issues in a federal court case, a case study Kristin Kennedy Bryant
University, USA James Bishop Bryant University, USA
3. Weiss’s Introductory Statistics, Tenth Edition
4. Pearson, Statistics for Managers
THANKYOU

More Related Content

What's hot

Sample and Sampling Technique 3rd Lecture
Sample and Sampling Technique 3rd LectureSample and Sampling Technique 3rd Lecture
Sample and Sampling Technique 3rd LectureAnisur Rahman
 
L4 theory of sampling
L4 theory of samplingL4 theory of sampling
L4 theory of samplingJags Jagdish
 
Sampling and sampling distribution tttt
Sampling and sampling distribution ttttSampling and sampling distribution tttt
Sampling and sampling distribution ttttpardeepkaur60
 
Sampling techniques 2
Sampling techniques 2Sampling techniques 2
Sampling techniques 2Ruby Ocenar
 
Sampling techniques in Research
Sampling techniques in Research Sampling techniques in Research
Sampling techniques in Research Pavithra L N
 
Sampling and sampling technique
Sampling and sampling techniqueSampling and sampling technique
Sampling and sampling techniqueMoumita Pal
 
Chapter 9 sampling and statistical tool
Chapter 9 sampling and statistical toolChapter 9 sampling and statistical tool
Chapter 9 sampling and statistical toolMaria Theresa
 
Chapter 6 (sample design)
Chapter 6 (sample design)Chapter 6 (sample design)
Chapter 6 (sample design)BoreyThai1
 
Sampling and its variability
Sampling  and its variabilitySampling  and its variability
Sampling and its variabilityDrBhushan Kamble
 
Sampling distribution concepts
Sampling distribution conceptsSampling distribution concepts
Sampling distribution conceptsumar sheikh
 
Population & sample lecture 04
Population & sample lecture 04Population & sample lecture 04
Population & sample lecture 04DrZahid Khan
 
Sampling techniques: Systematic & Purposive Sampling
Sampling techniques: Systematic & Purposive SamplingSampling techniques: Systematic & Purposive Sampling
Sampling techniques: Systematic & Purposive SamplingSIDDHI SOOD
 
Sampling distribution
Sampling distributionSampling distribution
Sampling distributionDanu Saputra
 
Chp11 - Research Methods for Business By Authors Uma Sekaran and Roger Bougie
Chp11  - Research Methods for Business By Authors Uma Sekaran and Roger BougieChp11  - Research Methods for Business By Authors Uma Sekaran and Roger Bougie
Chp11 - Research Methods for Business By Authors Uma Sekaran and Roger BougieHassan Usman
 
7. sampling & sample size determination ldr 280
7. sampling & sample size determination ldr 2807. sampling & sample size determination ldr 280
7. sampling & sample size determination ldr 280shifa najam
 
Sampling design, sampling errors, sample size determination
Sampling design, sampling errors, sample size determinationSampling design, sampling errors, sample size determination
Sampling design, sampling errors, sample size determinationVishnupriya T H
 

What's hot (19)

Sample and Sampling Technique 3rd Lecture
Sample and Sampling Technique 3rd LectureSample and Sampling Technique 3rd Lecture
Sample and Sampling Technique 3rd Lecture
 
L4 theory of sampling
L4 theory of samplingL4 theory of sampling
L4 theory of sampling
 
Sampling and sampling distribution tttt
Sampling and sampling distribution ttttSampling and sampling distribution tttt
Sampling and sampling distribution tttt
 
Sampling techniques 2
Sampling techniques 2Sampling techniques 2
Sampling techniques 2
 
Sampling techniques in Research
Sampling techniques in Research Sampling techniques in Research
Sampling techniques in Research
 
Sampling and sampling technique
Sampling and sampling techniqueSampling and sampling technique
Sampling and sampling technique
 
Chapter 9 sampling and statistical tool
Chapter 9 sampling and statistical toolChapter 9 sampling and statistical tool
Chapter 9 sampling and statistical tool
 
Chap008
Chap008Chap008
Chap008
 
Chapter 6 (sample design)
Chapter 6 (sample design)Chapter 6 (sample design)
Chapter 6 (sample design)
 
Sampling and its variability
Sampling  and its variabilitySampling  and its variability
Sampling and its variability
 
Sampling distribution concepts
Sampling distribution conceptsSampling distribution concepts
Sampling distribution concepts
 
Sampling and Inference_Political_Science
Sampling and Inference_Political_ScienceSampling and Inference_Political_Science
Sampling and Inference_Political_Science
 
Samplels & Sampling Techniques
Samplels & Sampling TechniquesSamplels & Sampling Techniques
Samplels & Sampling Techniques
 
Population & sample lecture 04
Population & sample lecture 04Population & sample lecture 04
Population & sample lecture 04
 
Sampling techniques: Systematic & Purposive Sampling
Sampling techniques: Systematic & Purposive SamplingSampling techniques: Systematic & Purposive Sampling
Sampling techniques: Systematic & Purposive Sampling
 
Sampling distribution
Sampling distributionSampling distribution
Sampling distribution
 
Chp11 - Research Methods for Business By Authors Uma Sekaran and Roger Bougie
Chp11  - Research Methods for Business By Authors Uma Sekaran and Roger BougieChp11  - Research Methods for Business By Authors Uma Sekaran and Roger Bougie
Chp11 - Research Methods for Business By Authors Uma Sekaran and Roger Bougie
 
7. sampling & sample size determination ldr 280
7. sampling & sample size determination ldr 2807. sampling & sample size determination ldr 280
7. sampling & sample size determination ldr 280
 
Sampling design, sampling errors, sample size determination
Sampling design, sampling errors, sample size determinationSampling design, sampling errors, sample size determination
Sampling design, sampling errors, sample size determination
 

Similar to Sampling

Basics of Research Methodology- Part-II.ppt
Basics of Research Methodology- Part-II.pptBasics of Research Methodology- Part-II.ppt
Basics of Research Methodology- Part-II.pptPratibha Jagtap
 
Types of probability sampling22.docx
Types of probability sampling22.docxTypes of probability sampling22.docx
Types of probability sampling22.docxSOMOSCO1
 
SAMPLING PROCEDURES.pptx
SAMPLING PROCEDURES.pptxSAMPLING PROCEDURES.pptx
SAMPLING PROCEDURES.pptxAnalieCabanlit1
 
Unit 6 sampling techniques
Unit 6 sampling techniquesUnit 6 sampling techniques
Unit 6 sampling techniquesAsima shahzadi
 
Sampling - Types, Steps in Sampling process.pdf
Sampling - Types, Steps in Sampling process.pdfSampling - Types, Steps in Sampling process.pdf
Sampling - Types, Steps in Sampling process.pdfRKavithamani
 
sampling technique
sampling techniquesampling technique
sampling techniqueAnish Kumar
 
Practical Research_Quarter 2 Lesson 3 Probability
Practical Research_Quarter 2 Lesson 3 ProbabilityPractical Research_Quarter 2 Lesson 3 Probability
Practical Research_Quarter 2 Lesson 3 ProbabilityYelMuli
 
Theory of sampling
Theory of samplingTheory of sampling
Theory of samplingJags Jagdish
 
Sampling.pptx
Sampling.pptxSampling.pptx
Sampling.pptxheencomm
 
Week_9-Unit_7_Sampling_Techniques (1).pdf
Week_9-Unit_7_Sampling_Techniques (1).pdfWeek_9-Unit_7_Sampling_Techniques (1).pdf
Week_9-Unit_7_Sampling_Techniques (1).pdfdursunselim329
 

Similar to Sampling (20)

Sampling Techniques.docx
Sampling Techniques.docxSampling Techniques.docx
Sampling Techniques.docx
 
sampling methods
sampling methodssampling methods
sampling methods
 
Basics of Research Methodology- Part-II.ppt
Basics of Research Methodology- Part-II.pptBasics of Research Methodology- Part-II.ppt
Basics of Research Methodology- Part-II.ppt
 
Types of probability sampling22.docx
Types of probability sampling22.docxTypes of probability sampling22.docx
Types of probability sampling22.docx
 
Sample Methods.pptx
Sample Methods.pptxSample Methods.pptx
Sample Methods.pptx
 
SAMPLING.pptx
SAMPLING.pptxSAMPLING.pptx
SAMPLING.pptx
 
Sampling.pptx
Sampling.pptxSampling.pptx
Sampling.pptx
 
Sampling
SamplingSampling
Sampling
 
SAMPLING Theory.ppt
SAMPLING Theory.pptSAMPLING Theory.ppt
SAMPLING Theory.ppt
 
SAMPLING PROCEDURES.pptx
SAMPLING PROCEDURES.pptxSAMPLING PROCEDURES.pptx
SAMPLING PROCEDURES.pptx
 
Unit 6 sampling techniques
Unit 6 sampling techniquesUnit 6 sampling techniques
Unit 6 sampling techniques
 
Sampling - Types, Steps in Sampling process.pdf
Sampling - Types, Steps in Sampling process.pdfSampling - Types, Steps in Sampling process.pdf
Sampling - Types, Steps in Sampling process.pdf
 
Sampling.pptx
Sampling.pptxSampling.pptx
Sampling.pptx
 
sampling technique
sampling techniquesampling technique
sampling technique
 
Practical Research_Quarter 2 Lesson 3 Probability
Practical Research_Quarter 2 Lesson 3 ProbabilityPractical Research_Quarter 2 Lesson 3 Probability
Practical Research_Quarter 2 Lesson 3 Probability
 
Theory of sampling
Theory of samplingTheory of sampling
Theory of sampling
 
Sampling
SamplingSampling
Sampling
 
Sampling
SamplingSampling
Sampling
 
Sampling.pptx
Sampling.pptxSampling.pptx
Sampling.pptx
 
Week_9-Unit_7_Sampling_Techniques (1).pdf
Week_9-Unit_7_Sampling_Techniques (1).pdfWeek_9-Unit_7_Sampling_Techniques (1).pdf
Week_9-Unit_7_Sampling_Techniques (1).pdf
 

More from praveen3030

Unit 2 business research design
Unit 2 business research designUnit 2 business research design
Unit 2 business research designpraveen3030
 
Unit 1 business research
Unit 1 business researchUnit 1 business research
Unit 1 business researchpraveen3030
 
Economic policies
Economic policiesEconomic policies
Economic policiespraveen3030
 
Industrial policy and structure
Industrial policy and structureIndustrial policy and structure
Industrial policy and structurepraveen3030
 
Hypothesis testing
Hypothesis testingHypothesis testing
Hypothesis testingpraveen3030
 
Data collection copy
Data collection   copyData collection   copy
Data collection copypraveen3030
 

More from praveen3030 (7)

Unit 2 business research design
Unit 2 business research designUnit 2 business research design
Unit 2 business research design
 
Unit 1 business research
Unit 1 business researchUnit 1 business research
Unit 1 business research
 
Economic policies
Economic policiesEconomic policies
Economic policies
 
Industrial policy and structure
Industrial policy and structureIndustrial policy and structure
Industrial policy and structure
 
Report writing
Report writingReport writing
Report writing
 
Hypothesis testing
Hypothesis testingHypothesis testing
Hypothesis testing
 
Data collection copy
Data collection   copyData collection   copy
Data collection copy
 

Recently uploaded

SOCIAL AND HISTORICAL CONTEXT - LFTVD.pptx
SOCIAL AND HISTORICAL CONTEXT - LFTVD.pptxSOCIAL AND HISTORICAL CONTEXT - LFTVD.pptx
SOCIAL AND HISTORICAL CONTEXT - LFTVD.pptxiammrhaywood
 
Hybridoma Technology ( Production , Purification , and Application )
Hybridoma Technology  ( Production , Purification , and Application  ) Hybridoma Technology  ( Production , Purification , and Application  )
Hybridoma Technology ( Production , Purification , and Application ) Sakshi Ghasle
 
Software Engineering Methodologies (overview)
Software Engineering Methodologies (overview)Software Engineering Methodologies (overview)
Software Engineering Methodologies (overview)eniolaolutunde
 
microwave assisted reaction. General introduction
microwave assisted reaction. General introductionmicrowave assisted reaction. General introduction
microwave assisted reaction. General introductionMaksud Ahmed
 
Employee wellbeing at the workplace.pptx
Employee wellbeing at the workplace.pptxEmployee wellbeing at the workplace.pptx
Employee wellbeing at the workplace.pptxNirmalaLoungPoorunde1
 
call girls in Kamla Market (DELHI) 🔝 >༒9953330565🔝 genuine Escort Service 🔝✔️✔️
call girls in Kamla Market (DELHI) 🔝 >༒9953330565🔝 genuine Escort Service 🔝✔️✔️call girls in Kamla Market (DELHI) 🔝 >༒9953330565🔝 genuine Escort Service 🔝✔️✔️
call girls in Kamla Market (DELHI) 🔝 >༒9953330565🔝 genuine Escort Service 🔝✔️✔️9953056974 Low Rate Call Girls In Saket, Delhi NCR
 
Accessible design: Minimum effort, maximum impact
Accessible design: Minimum effort, maximum impactAccessible design: Minimum effort, maximum impact
Accessible design: Minimum effort, maximum impactdawncurless
 
“Oh GOSH! Reflecting on Hackteria's Collaborative Practices in a Global Do-It...
“Oh GOSH! Reflecting on Hackteria's Collaborative Practices in a Global Do-It...“Oh GOSH! Reflecting on Hackteria's Collaborative Practices in a Global Do-It...
“Oh GOSH! Reflecting on Hackteria's Collaborative Practices in a Global Do-It...Marc Dusseiller Dusjagr
 
Contemporary philippine arts from the regions_PPT_Module_12 [Autosaved] (1).pptx
Contemporary philippine arts from the regions_PPT_Module_12 [Autosaved] (1).pptxContemporary philippine arts from the regions_PPT_Module_12 [Autosaved] (1).pptx
Contemporary philippine arts from the regions_PPT_Module_12 [Autosaved] (1).pptxRoyAbrique
 
MENTAL STATUS EXAMINATION format.docx
MENTAL     STATUS EXAMINATION format.docxMENTAL     STATUS EXAMINATION format.docx
MENTAL STATUS EXAMINATION format.docxPoojaSen20
 
The Most Excellent Way | 1 Corinthians 13
The Most Excellent Way | 1 Corinthians 13The Most Excellent Way | 1 Corinthians 13
The Most Excellent Way | 1 Corinthians 13Steve Thomason
 
CARE OF CHILD IN INCUBATOR..........pptx
CARE OF CHILD IN INCUBATOR..........pptxCARE OF CHILD IN INCUBATOR..........pptx
CARE OF CHILD IN INCUBATOR..........pptxGaneshChakor2
 
KSHARA STURA .pptx---KSHARA KARMA THERAPY (CAUSTIC THERAPY)————IMP.OF KSHARA ...
KSHARA STURA .pptx---KSHARA KARMA THERAPY (CAUSTIC THERAPY)————IMP.OF KSHARA ...KSHARA STURA .pptx---KSHARA KARMA THERAPY (CAUSTIC THERAPY)————IMP.OF KSHARA ...
KSHARA STURA .pptx---KSHARA KARMA THERAPY (CAUSTIC THERAPY)————IMP.OF KSHARA ...M56BOOKSTORE PRODUCT/SERVICE
 
BASLIQ CURRENT LOOKBOOK LOOKBOOK(1) (1).pdf
BASLIQ CURRENT LOOKBOOK  LOOKBOOK(1) (1).pdfBASLIQ CURRENT LOOKBOOK  LOOKBOOK(1) (1).pdf
BASLIQ CURRENT LOOKBOOK LOOKBOOK(1) (1).pdfSoniaTolstoy
 
The basics of sentences session 2pptx copy.pptx
The basics of sentences session 2pptx copy.pptxThe basics of sentences session 2pptx copy.pptx
The basics of sentences session 2pptx copy.pptxheathfieldcps1
 
A Critique of the Proposed National Education Policy Reform
A Critique of the Proposed National Education Policy ReformA Critique of the Proposed National Education Policy Reform
A Critique of the Proposed National Education Policy ReformChameera Dedduwage
 
Presiding Officer Training module 2024 lok sabha elections
Presiding Officer Training module 2024 lok sabha electionsPresiding Officer Training module 2024 lok sabha elections
Presiding Officer Training module 2024 lok sabha electionsanshu789521
 

Recently uploaded (20)

SOCIAL AND HISTORICAL CONTEXT - LFTVD.pptx
SOCIAL AND HISTORICAL CONTEXT - LFTVD.pptxSOCIAL AND HISTORICAL CONTEXT - LFTVD.pptx
SOCIAL AND HISTORICAL CONTEXT - LFTVD.pptx
 
Hybridoma Technology ( Production , Purification , and Application )
Hybridoma Technology  ( Production , Purification , and Application  ) Hybridoma Technology  ( Production , Purification , and Application  )
Hybridoma Technology ( Production , Purification , and Application )
 
Software Engineering Methodologies (overview)
Software Engineering Methodologies (overview)Software Engineering Methodologies (overview)
Software Engineering Methodologies (overview)
 
microwave assisted reaction. General introduction
microwave assisted reaction. General introductionmicrowave assisted reaction. General introduction
microwave assisted reaction. General introduction
 
Employee wellbeing at the workplace.pptx
Employee wellbeing at the workplace.pptxEmployee wellbeing at the workplace.pptx
Employee wellbeing at the workplace.pptx
 
call girls in Kamla Market (DELHI) 🔝 >༒9953330565🔝 genuine Escort Service 🔝✔️✔️
call girls in Kamla Market (DELHI) 🔝 >༒9953330565🔝 genuine Escort Service 🔝✔️✔️call girls in Kamla Market (DELHI) 🔝 >༒9953330565🔝 genuine Escort Service 🔝✔️✔️
call girls in Kamla Market (DELHI) 🔝 >༒9953330565🔝 genuine Escort Service 🔝✔️✔️
 
Accessible design: Minimum effort, maximum impact
Accessible design: Minimum effort, maximum impactAccessible design: Minimum effort, maximum impact
Accessible design: Minimum effort, maximum impact
 
“Oh GOSH! Reflecting on Hackteria's Collaborative Practices in a Global Do-It...
“Oh GOSH! Reflecting on Hackteria's Collaborative Practices in a Global Do-It...“Oh GOSH! Reflecting on Hackteria's Collaborative Practices in a Global Do-It...
“Oh GOSH! Reflecting on Hackteria's Collaborative Practices in a Global Do-It...
 
Contemporary philippine arts from the regions_PPT_Module_12 [Autosaved] (1).pptx
Contemporary philippine arts from the regions_PPT_Module_12 [Autosaved] (1).pptxContemporary philippine arts from the regions_PPT_Module_12 [Autosaved] (1).pptx
Contemporary philippine arts from the regions_PPT_Module_12 [Autosaved] (1).pptx
 
MENTAL STATUS EXAMINATION format.docx
MENTAL     STATUS EXAMINATION format.docxMENTAL     STATUS EXAMINATION format.docx
MENTAL STATUS EXAMINATION format.docx
 
9953330565 Low Rate Call Girls In Rohini Delhi NCR
9953330565 Low Rate Call Girls In Rohini  Delhi NCR9953330565 Low Rate Call Girls In Rohini  Delhi NCR
9953330565 Low Rate Call Girls In Rohini Delhi NCR
 
Model Call Girl in Tilak Nagar Delhi reach out to us at 🔝9953056974🔝
Model Call Girl in Tilak Nagar Delhi reach out to us at 🔝9953056974🔝Model Call Girl in Tilak Nagar Delhi reach out to us at 🔝9953056974🔝
Model Call Girl in Tilak Nagar Delhi reach out to us at 🔝9953056974🔝
 
The Most Excellent Way | 1 Corinthians 13
The Most Excellent Way | 1 Corinthians 13The Most Excellent Way | 1 Corinthians 13
The Most Excellent Way | 1 Corinthians 13
 
CARE OF CHILD IN INCUBATOR..........pptx
CARE OF CHILD IN INCUBATOR..........pptxCARE OF CHILD IN INCUBATOR..........pptx
CARE OF CHILD IN INCUBATOR..........pptx
 
KSHARA STURA .pptx---KSHARA KARMA THERAPY (CAUSTIC THERAPY)————IMP.OF KSHARA ...
KSHARA STURA .pptx---KSHARA KARMA THERAPY (CAUSTIC THERAPY)————IMP.OF KSHARA ...KSHARA STURA .pptx---KSHARA KARMA THERAPY (CAUSTIC THERAPY)————IMP.OF KSHARA ...
KSHARA STURA .pptx---KSHARA KARMA THERAPY (CAUSTIC THERAPY)————IMP.OF KSHARA ...
 
BASLIQ CURRENT LOOKBOOK LOOKBOOK(1) (1).pdf
BASLIQ CURRENT LOOKBOOK  LOOKBOOK(1) (1).pdfBASLIQ CURRENT LOOKBOOK  LOOKBOOK(1) (1).pdf
BASLIQ CURRENT LOOKBOOK LOOKBOOK(1) (1).pdf
 
Model Call Girl in Bikash Puri Delhi reach out to us at 🔝9953056974🔝
Model Call Girl in Bikash Puri  Delhi reach out to us at 🔝9953056974🔝Model Call Girl in Bikash Puri  Delhi reach out to us at 🔝9953056974🔝
Model Call Girl in Bikash Puri Delhi reach out to us at 🔝9953056974🔝
 
The basics of sentences session 2pptx copy.pptx
The basics of sentences session 2pptx copy.pptxThe basics of sentences session 2pptx copy.pptx
The basics of sentences session 2pptx copy.pptx
 
A Critique of the Proposed National Education Policy Reform
A Critique of the Proposed National Education Policy ReformA Critique of the Proposed National Education Policy Reform
A Critique of the Proposed National Education Policy Reform
 
Presiding Officer Training module 2024 lok sabha elections
Presiding Officer Training module 2024 lok sabha electionsPresiding Officer Training module 2024 lok sabha elections
Presiding Officer Training module 2024 lok sabha elections
 

Sampling

  • 1. SAMPLING Dr. Perini PraveenaSri, Associate Professor Atria Institute of Technology
  • 2. Learning Objectives Comprehend the basic concepts of sampling theory. Understand the reasons for sampling. Identify the basic sampling techniques. Comparing pros and cons of different probability sampling methods Demonstrate knowledge of basic sampling methods. Apply sampling theory in business and economics.
  • 3. BASIC CONCEPTS OF SAMPLING Why Sample? In many situations even though we are very much interested in some characteristics of a specific population , we cannot physically examine the entire population due to Cost Time And other Limitations In such instances , we examine only a part of population by means of sample with the expectation that the sample will be the representative of the population under study.
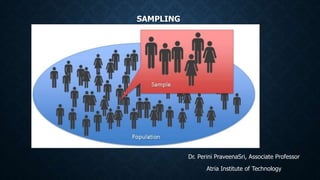
  • 4. (A) POPULATION: It is a group of all elements /observations (persons, animals, objects, measurements, etc) under consideration in a certain problem. It is also collection of objects having certain well defined attributes. Examples : (i) The population of AICTE accredited technical colleges in Tamil Nadu (ii) The population of private hospitals in Karnataka (iii) All households in Bellary town. (B) Sample: It is a portion of population Examples: (i) Collection of AICTE accredited technical colleges of Tamilnadu with minority status ie. ST/SC (ii) Collection of Private Hospitals in Bangalore (iii) Collection of households who are possessed with white colour jobs (A group of persons performing professional, administrative and managerial work) (C)Parameter: It is any measurable characteristic of a population. Example: Population means, Population standard deviations, population medians, etc.
  • 5. (D)Statistic: It is a number resulting from manipulation of sample data. That is, it is any measurable characteristic of a sample. Example: sample means, sample standard deviations, sample medians, etc. A statistic is used to estimate a population parameter such as Population mean , Population standard deviation etc. (E) The sampling error: It is the difference between a sample statistic and its corresponding population parameter. It is the error that occurs because a sample has been taken instead of a census. For example: the sample mean may differ from the true population mean. Sampling error is the deviation of the selected sample from the true characteristics, traits, behaviors, qualities or figures of the entire population. (F) Census: It is a collection of data from the whole population (that is, complete enumeration). It is the actual measurement or observation of all possible elements from the population or it is a survey of everyone in the population. (G) Target population: It is the population of interest, to which the researcher would like to generalize the results of the study. Example: If a researcher would like to study the effect of a new fertilizer on crop yield in Ethiopia, then the reference population is all farmers in Ethiopia who are using the new fertilizer.
  • 6.
  • 7.
  • 8.
  • 9. (E)Sampling: It is the process conducting the selection of a finite number of elements from a given population of interest for purposes of an inquiry. it is a process of taking samples from a population of interest for purpose of an inquiry. Example: in industry, the quality of a product is assessed through sampling; the public opinion on social, economical and political problems is ascertained through sampling. (I) Sampling unit: It is the ultimate unit to be sampled (elements of the population to be sampled).it is the unit of selection in the sampling process. Examples: in a sample of households, the sampling unit is a household; in a sample of students, a student is the sampling unit. in a sample of districts, the sampling unit is a district, etc. (J) Sampling Frame: It is the list of all possible units in the reference population, from which a sample is to be drawn. Example: If a researcher would like to do a research on poverty levels of residents in a town and if he decided that the sampling unit for the study is an individual, then the sampling frame would be the list of all individuals living in that town. A student roster is a sampling frame for a sample of students.
  • 10. Sample Survey A sample survey is a study that obtains data from a subset of a population, in order to estimate population attributes. A sample survey is a survey which is carried out using a sampling method, A survey is the systematic collection of information from different individuals. A questionnaire is a survey tool while a survey is the process of using questionnaires to gather information. Degrees of Freedom : It means the number of items to be selected freely out of n items. It is denoted by df. Example: Select three integer numbers in such away that their addition leads to the value 100. 40+10+50= 100 One can choose only two items freely and the selection of third value cannot be made freely . If you select 40 and 10, then the third value should be 50. Degrees of freedom, df = 3-1= 2 Notations: N= Population size µ= population mean σ= Population Standard Deviation P= Population Proportion n= Sample Size x̄ = Sample mean s= Sample Standard Deviation p = Sample Proportion R= Population correlation Coefficient r= Sample Correlation Coefficient
  • 11. FORMULAS OF SAMPLING DISTRIBUTION Sample Mean : x̄ = ( Σ xi ) / n • x̄ just stands for the “sample mean” • Σ means “add up” • xi “all of the x-values” • n means “the number of items in the sample” Sample Variance:
  • 12. 1. Find the mean of the set of data. 2. Subtract each number from the mean. 3. Square the result. 4. Add the results together. 5. divide the result by the total number of numbers in the data set minus one. Population Mean
  • 13. Population Variance : 1.Find the mean of the set of data. 2. Subtract each number from the mean. 3. Square the result. 4. Add the results together. 5. Divide the result by the total number of numbers in the data set minus one.
  • 14.
  • 15. REASONS FOR SAMPLING Even if a decision maker can take a census, there are often reasons to sample. The reasons fall into the following categories: 1. Time constraint: the major advantage of sampling is that it is much faster than taking a census. 2. Cost constraint: the cost of taking a census is greater than that of a sample. 3. Improved accuracy: the result of a sample may be more accurate than the result of a census. A person gathering data from fewer sources tends to be more complete and thorough in both gathering and tabulation. There are likely to be fewer human errors than census. 4.Impossibility of census: sometimes taking a complete census to gather information is economically impossible. Obtaining information may require a change, or destruction of the item from which information is being gathered.
  • 16. TYPES OF SAMPLING: PROBABILITY AND NON PROBABILITY SAMPLING Probability Sampling: A probability sample is a sample selected such that each item in the population being studied has a known chance (greater than zero) of being included in the sample. These methods remove human judgment from the sampling process and ensure a more representative sample and it has certain basic features. Non Probability Sampling: Non-probability sampling technique does not give equal chance that each element of the population will be included in the sample. Units are selected at the discretion of the researcher. Such samples derive their control from the judgment of the researcher.
  • 17. WHAT ARE THE STEPS INVOLVED IN PROBABILITY SAMPLING? 1. choose your population of interest carefully: carefully think and choose from the population, people you think whose opinions should be collected and then include them in the sample. 2. Determine a suitable sample frame: your frame should include a sample from your population of interest and no one from outside in order to collect accurate data. 3. select your sample and start your survey: it can sometimes be challenging to find the right sample and determine a suitable sample frame. even if all factors are in your favor, there still might be unforeseen issues like cost factor, quality of respondents and quickness to respond. getting a sample to respond to true probability survey might be difficult but not impossible. But, in most cases, drawing a probability sample will save you time, money, and a lot of frustration. you probably can’t send surveys to everyone but you can always give everyone a chance to participate, this is what probability sample is all about.
  • 18. EXAMPLES: PROBABILITY SAMPLING If you have a population of 100 people every person would have odds of 1 in 100 for getting selected. probability sampling gives you the best chance to create a sample that is truly representative of the population. • For example, consider hypothetically an organization has 500,000 employees sitting at different geographic locations. The organization wishes to make certain amendment in its human resource policy, but before they roll out the change they wish to know if the employees will be happy with the change or not. However, it’s a tedious task to reach out to all 500,000 employees. This is where probability sampling comes handy. A sample from the larger population i.e from 500,000 employees can be chosen. This sample will represent the population. A survey now can be deployed to the sample. • From the responses received, management will now be able to know whether employees in that organization are happy or not about the amendment.
  • 19. WHEN TO USE PROBABILITY SAMPLING 1. when the sampling bias has to be reduced: this sampling method is used when the bias has to be minimum. the selection of the sample largely determines the quality of the research’s inference. how researchers select their sample largely determines the quality of a researcher’s findings. probability sampling leads to higher quality findings because it provides an unbiased representation of the population. 2. when the population is usually diverse: when your population size is large and diverse this sampling method is usually used extensively as probability sampling helps researchers create samples that fully represent the population. say we want to find out how many people prefer medical tourism over getting treated in their own country, this sampling method will help pick samples from various socio-economic strata, background etc to represent the bigger population. 3. To create an accurate sample: probability sampling help researchers create an accurate sample of their population. researchers can use proven statistical methods to draw accurate sample size to obtained well-defined data.
  • 20. ADVANTAGES OF PROBABILITY SAMPLING 1. It’s cost-effective: this process is both cost and time effective and a larger sample can also be chosen based on numbers assigned to the samples and then choosing random numbers from the bigger sample. work here is done. 2. It’s simple and easy: probability sampling is an easy way of sampling as it does not involve a complicated process. its quick and saves time. the time saved can thus be used to analyze the data and draw conclusions. 3.It non-technical: this method of sampling doesn’t require any technical knowledge because of the simplicity with which this can be done. this method doesn’t require complex knowledge and its not at all lengthy.
  • 21. Non-probability sampling: definition Non-probability sampling is a sampling technique in which the researcher selects samples based on the subjective judgment of the researcher rather than random selection. In non-probability sampling, not all members of the population have a chance of participating in the study unlike probability sampling, where each member of the population has a known chance of being selected. Non-probability sampling is most useful for exploratory studies like pilot survey (a survey that is deployed to a smaller sample compared to pre-determined sample size). non-probability sampling is used in studies where it is not possible to draw random probability sampling due to time or cost considerations. Non-probability sampling is a less stringent method, this sampling method depends heavily on the expertise of the researchers. non-probability sampling is carried out by methods of observation and is widely used in qualitative research.
  • 22. SAMPLING BASED ON TWO SPECIFIC PRINCIPLES Principle 1: Law of Statistical Regularity This law implies that a reasonably large number of items are selected at random from population such a way that the characteristics of the population and the sample are equal . Principal 2: Law of Inertia of Law of large numbers This law reveals that wherever the sample is quite large, the inference will be very close to the actual.
  • 23.
  • 24. SIMPLE RANDOM SAMPLING • In Simple random sampling, each item in the population has a known, the same, non- zero chance of being included in the sample. Random samples are selected by using methods such as random numbers (which can be generated from computers) or lottery method. • To select a simple random sample you need to follow the following procedures: • Make a numbered list of all units in the population (sampling frame), • Each unit on the list should be numbered in sequence from 1 to N (where N is the size of the population), • Select the required number of study units, using a "lottery" or a table of random numbers.
  • 25. EXAMPLES : LOTTERY METHOD IN SIMPLE RANDOM SAMPLING Procedure: 1)numbered or named papers representing a unit in the population are placed in a hat. i.e. 1000 papers 2) the papers are thoroughly mixed and the number of papers equal to the sample size is selected from the hat. for a sample of 200 students, the researcher would select 200 papers. 3) the sample then consists of all units of the population corresponding to the selected papers. ACTIVITY: 1.7 We chose a very small population-the five top Oklahoma state officials-to illustrate simple random sampling. In practice, we would not sample from such a small population but would instead take a census. Using a small population here makes understanding the concept of simple random sampling easier.
  • 26. ACTIVITY 1: SIMPLE RANDOM SAMPLING
  • 27. EXAMPLE: RANDOM SAMPLE NUMBERS IN SIMPLE RANDOM SAMPLING Procedure: Different methods and tools can be used for creating random numbers for sample selection. Standard random number tables and soft-wares with ability of generating random numbers like Open-Epi or Stata are available. 1) The researcher assigns a number to each unit of the population and constructs the random table. 2) Then s/he randomly selects a starting place (point), goes through the table across the rows or down the columns and lists the numbers as they appear on the table. 3) Members of the population with the selected numbers constitute the sample. 4) A random number table is a list of numbers generated by a computer that has been programmed to yield a set of random numbers. 5) It is possible for a unit's number to be selected more than once. Example: You have been asked to perform a survey in a prison. The list of all 2000 prisoners has been given to you. You think that a sample of 300 would be satisfactory for your work. If you want to choose 300 of them for interview randomly, you can use a random number generator to generate 300 numbers between 1 and 2000. Most of the time you would have some repeated numbers that should be replaced by new numbers.
  • 28. ACTIVITY 2 : RANDOM SAMPLE NUMBERS IN SIMPLE RANDOM SAMPLING • Obtaining a simple random sample by picking slips of paper out of a box is usually impractical, especially when the population is large. Fortunately, we can use several practical procedures to get simple random samples. One common method involves a table of random numbers-a table of randomly chosen digits, as illustrated in activity 1.8 .
  • 29.
  • 30.
  • 31.
  • 32.
  • 33. ADVANTAGES AND DISADVANTAGES: SIMPLE RANDOM SAMPLING • Advantage of Simple random Sampling  Ensures that the sample is unbiased in that every individual and every sample has an advantage of being chosen.  SRS is the basic sampling method assumed in survey statistical computations. This can be used with confidence. • Disadvantages of Simple random sampling  Simple random sampling requires a sampling frame and this is sometimes impossible.  It is difficult to take samples if the reference population is scattered.  If the population is extremely large, it is tedious and time consuming to number and select the sample.  Minority subgroups of interest in the population may not be represented in the sample.
  • 34. SYSTEMATIC SAMPLING OR (QUASI- RANDOM SAMPLING) • In systematic sampling, the elements to be included in a sample are picked at a constant interval. That is, the items or individuals of the population are arranged in some order and a random starting point is selected from 1 through k. • 𝐾 = 𝑝𝑜𝑝𝑢𝑙𝑎𝑡𝑖𝑜𝑛 𝑠𝑖𝑧𝑒 𝑠𝑎𝑚𝑝𝑙𝑒 𝑠𝑖𝑧𝑒 = 𝑁 𝑛 and every Kth member of the population is selected for the sample. • K-represents a sampling interval. • Example 1: Suppose there are 2000 subjects in the population and a sample size of 50 subjects are needed. Select a systematic sample of these 50 subjects. • Solution: The sampling interval (k) is 40= ( 2000 50 ). The number of the first subject to be included in the sample is chosen randomly, for example, by blindly picking up one out of 40 pieces of paper numbered 1 to 40 (in the form of lottery method). Suppose subject 12 was the first subject selected, then the sample would consist of samples whose numbers were 12, 52, 92, etc until 50 subjects (samples) are obtained. Note that the second subject 52 is obtained by adding 12 to 40, similarly, the third element 92 is obtained by adding 52 to 40, etc. That is the sample interval (k) will be added to each subsequent elements. • It is obvious that a sample chosen through this way is not strictly random since not all the members of the population have an equal chance of being selected.
  • 35. Example 2: Suppose a researcher wants to know the impact of microfinance on the clients' household income. she wishes to select 10 clients out of 250 clients and a research assistant is required to select systematic samples. Assuming that you are a research assistant, select a systematic sample of 10 clients. Solution: 1. number each client from 1 to 250 (based on alphabet of their names or identity numbers). 2. since there are 250 clients and 10 are to be selected, the rule is to select every 25 clients. this rule is determined by dividing 250 by 10 which gives 25, 3. the number of the first subject to be included in the sample is chosen randomly from numbers 1 to 25. in this case let us select number 5 randomly. 4. then select every 25 number on the list starting from 5. the numbers include the following: 5, 30, 55, 80, 105, 130, 155,180, 205 and 230. therefore, clients with these numbers will be included in the sample for analysis purpose.
  • 36. ACTIVITY 3: SYSTEMATIC RANDOM SAMPLING
  • 37. ADVANTAGES AND DISADVANTAGES: SYSTEMATIC SAMPLING • Advantages of Systematic Sampling:  Less time consuming and easier to perform than SRS,  It is more convenient to use as compared to SRS,  It provides a good approximation to simple random sampling. • Disadvantages of Systematic Sampling: • If there is any sort of cyclic ordering of the subjects, the samples will not be representative of population. Example: If subjects in the population are arranged in a manner such as: • 1) Defective item • 2) Non-defective item • 3) Defective item • 4) Non-defective item • That is the selection of the starting point could produce a sample of all defective items or non-defective items depending on whether the number to be added (k) is even or odd. • Example: starting point =defective item +even k=all defective item in the sample and starting point =non-defective item +even k=all non-defective items in the sample.
  • 38. CLUSTER SAMPLING • If the population is homogeneous and very large or resides in a large area, it is costly and time consuming to take samples . In this case, we divide the population in to groups called clusters and then we select representative clusters randomly. Finally, the samples will be taken from the sample clusters. We can take either all members of the sample clusters or we may select samples from the clusters by using other sampling techniques such as random sampling and systematic sampling . But, there are big barriers among the clusters such as big rivers, dense forest or administrative boundary. Procedure: • 1) The reference population is divided in to clusters or subgroups, preferably similar in size, • 2) A sample of the clusters is taken by random or systematic sampling, • 3) All the units in the selected clusters are then studied or we may select samples from each cluster. If part of the elements in each cluster is included in the sample, then the procedure is called two stage sampling. The first stage is selecting a sample of clusters from clusters and the second stage is selecting a sample of elements from each cluster.
  • 39. EXAMPLE : CLUSTER SAMPLING
  • 41.
  • 42. EXAMPLE : DISADVANTAGE OF CLUSTER SAMPLING
  • 43. ADVANTAGES AND DISADVANTAGES OF CLUSTER SAMPLING  Advantages: A list of all individual study units in the reference population is not required. reduces cost  Simplify field work and it is convenient Disadvantage: The members of the clusters are often more homogeneous than the members of the whole population and therefore, it may not be representative. The elements in a cluster may not have the same variation in characteristics as elements selected individually from the population.
  • 45. STRATIFIED SAMPLING • In stratified sampling, a population is first divided into subgroups, called strata (singular stratum), and a sample is selected from each stratum based on simple random or systematic sampling method. • The strata are made according to various homogeneous characteristics such as sex, race, region or institutional affiliation such as faculty. This sampling method is appropriate when the distribution of the characteristic to be studied is strongly affected by certain variables. Note: Stratified sampling is applied if the population is heterogeneous. • Stratified sampling can also be proportionate or non-proportionate. In the latter case, an equal number of elements are drawn from each stratum while in the former case a proportionate number is obtained. a) Proportionate Stratified Sampling: Number of units selected from each stratum is directly proportional to the size of the strata. If P represents the proportion of population included in ith stratum i, and n represents the total sample size, the number of elements selected from stratum i is nxPi b) Non- proportional sampling: the number of items studied in each stratum is disproportionate to the respective members in the population. In this regard, an equal number of elements are selected from each stratum.
  • 46. EXAMPLE: Let us suppose that we want a sample size of 30 to be drawn from a population size of 8000 which is divided in to three strata of size 4000, 2400 and 1600. i) adopting proportional allocation, find the sample sizes under each stratum. ii) by using non-proportional sample select 30 individuals from each stratum. solution: i) we shall get the sample size for the different strata: a. STRATA OF SIZE n1=4000, we have p1 =4000/8000=0.5 and hence n1 =n. p1 =30*0.5=15 b. STRATA OF SIZE n2 =2400, we have p2 =2400/8000=0.3 and hence n2 =n. p2 =30*0.3=9 c. STRATA OF SIZE n3 =1600, we have p3 =1600/8000=0.2 and hence n3 =n. p3 =30*0.2=6 therefore, using proportional allocation, the sample sizes for different strata are 15, 9 and 6 respectively which is in proportion for the sizes of the strata namely 4000:2400:1600. 1) n= n1+ n2+ n3; 2) n= n1+ n2+ n3 and 3) p1+ p2+ p3=1. ii) to get the non proportional sample size, since we have a total of three stratum (subgroups) and the sample to be selected is 30, we divide 30 by 3 which is equal to 10. this means we have to select 10 elements from the three stratum regardless of the number of elements in each stratum.
  • 48.
  • 49.
  • 50. ADVANTAGES AND DISADVANTAGES OF STRATIFIED SAMPLING • Advantage: The representation of the sample is improved • Disadvantages:  If there are many variables of interest, dividing a large population in to representative subgroups requires a great deal of effort,  If variables are somewhat complex or ambiguous (such as beliefs, attitudes, etc), it is difficult to separate individuals in to the sub groups according to these variables.
  • 51. MULTISTAGE SAMPLING • Contrary to its name, multi-stage sampling can be easy to apply in business studies. Application of this sampling method can be divided into four stages: 1. Choosing sampling frame, numbering each group with a unique number and selecting a small sample of relevant discrete groups. 2. Choosing a sampling frame of relevant discrete sub-groups. This should be done from relevant discrete groups selected in the previous stage. 3. Repeat the second stage above, if necessary. 4. Choosing the members of the sample group from the sub-groups using some variation of probability sampling. Let’s illustrate the application of the stages above using a specific example. Your research objective is to evaluate online spending patterns of households in the US through online questionnaires. You can form your sample group comprising 120 households in the following manner: Choose 6 states in the USA using simple random sampling (or any other probability sampling). Choose 4 districts within each state using systematic sampling method (or any other probability sampling). Choose 5 households from each district using simple random or systematic sampling methods. This will result in 120 households to be included in your sample group. i.e. 6x 4 x 5 = 120
  • 52.
  • 53. Advantages of multi-stage sampling Effective in primary data collection from geographically dispersed. population when face-To-face contact in required (e.g. semi-structured in-depth interviews) Cost-effectiveness and time-effectiveness. High level of flexibility. Disadvantages of multi-stage sampling High level of subjectivity. Research findings can never be 100% representative of population. The presence of group-level information is required. Area sampling is a method in which an area to be sampled is sub-divided into smaller blocks that are then selected at random and then again sub-sampled or fully surveyed. This method is typically used when a complete frame of reference is not available to be used.
  • 54. NON PROBABILITY SAMPLING • Non-probability sampling technique does not give equal chance that each element of the population will be included in the sample. Units are selected at the discretion of the researcher. Such samples derive their control from the judgment of the researcher. Some of the Disadvantages of non-probability sampling are of the following:  No confidence can be placed in the data obtained from such samples; they don't represent the large population. Therefore, the result obtained may not be generalized for the entire population.  Non-probability sampling depends exclusively on uncontrolled factors and researcher's insight, and there is no statistical method to determine the margin of the sampling errors.  Sometimes such samples are based on an absolute frame, which does not adequately cover the population.
  • 55. The advantages of non-probability sampling It is that it is much less complicated, less expensive, and a researcher may take the advantage of the available respondents with out the statistical complexity of the probability sampling. More over it is very convenient in the situation when the sample to be selected is very small and the researcher wants to get some idea of the population characteristics Non-probability sampling can be adequate if the researcher has no desire to generalize his findings beyond the sample, or if the study is merely a trial run for larger study (in preliminary research). This sampling technique is: (a) It is used when a sampling frame doesn't exist, (b) it is non-random selection (unrepresentative) (c )inappropriate if the aim is to measure variables and generalize findings (d) easier, quicker and cheaper to carryout than probability designs.
  • 56. Convenience sampling: It is a method in which a sample is chosen with ease of access being the primary concern. It selects anyone who is convenient, it can produce, ineffective, highly unrepresentative sample and is not recommended, it has high bias and systematic errors. It is least reliable but cheap and easy to collect. there is no control to ensure precision. ex: the person on the street interviewed for a television program, or interviews conducted in convenient locations such as student lounge.
  • 57.
  • 58. EXAMPLES Examples: One of the most common examples of convenience sampling is using student volunteers as subjects for the research. Another example is using subjects that are selected from a clinic, a class or an institution that is easily accessible to the researcher. Purposive (judgmental) sampling: The researcher exercises deliberate subjective choice in drawing samples what s/he regards as more informative for a study undergoing. when one draws a non-probability sample that confirms to a certain criteria, it is called purposive sampling. it occurs when one picks sample members to conform to some criteria.
  • 59. . Examples: 1.The researcher selects units to be sampled based on his own existing knowledge, or his professional judgment 2. Imagine a group of researchers that is interested in what it takes for American youths to graduate from high school by age 14, instead of the typical graduation age of 18 years old. It would not serve the researchers any benefit to use a random sample that includes a significant amount of youths that are on track to graduate at the traditional age of 18 years old. Instead, the researchers should focus only on the members of the population that fit the criteria and interests of their study -- in this case, youths that have skipped one or several grades and are on track to graduate at age 14. in this case, judgment sampling is the only viable option for obtaining information from a very specific group of people.
  • 60. Quota sampling: It is a method that ensures that a certain number of sample units from different categories with specific characteristics are represented. here, judgmental and convenience sampling methods are combined. Quota sampling can be applied for affirmative action. Example: suppose we know that 54% of the adults in a community are females, and the study requires 100 respondents as a sample. in quota sampling, we might interview the first 54 females and the first 46 males
  • 61. Snowball sampling: It is also called network, chain referral or computational sampling is a method for identifying and sampling or selecting the case in a network. It begins with one or a few people or cases and spreads out on the basis of links to the initial case. snowball sampling is a judgment sample used to sample special populations. The researcher locates an initial set of respondents. these respondents are used as informants to identify others with desired characteristics. Example:, People who have many friends are more likely to be recruited into the sample. when virtual social networks are used, then this technique is called virtual snowball sampling.
  • 62.
  • 63. PROBLEMS IN SAMPLING 1. Non sampling errors: This refers to : (i) Non-coverage error: this refers to sample frame defects: Ex: omission of part of the population; soldiers, students, people in hospital are typically excluded from national survey (but not series). It is serious in telephonic surveys since those who do not have a telephone are excluded. It also occurs when the cost used for sampling are incomplete. (ii) The wrong population is sampled: Be sure that the group being sampled is drawn from the population. Ex: drawing a sample of college students generalize about all college age persons. (iii) Non-response error: The response rate is low. Some people refuse to be interviewed because they are too busy, or simply do not trust the interviewer or they may not be interested to. (iv) Instrumental errors: instrument device to collect data (Ex: questionnaire), Ex: when questionnaire is badly worded or asked, leading questions or carelessly worded questions may be misinterpreted. (v) Interviewer errors: When some characteristics of the interviewer (age, sex, etc) affects the way in which the respondent answers questions. Ex: Questions about racial discriminations might be differently answered depending on the racial group of the interviewer. •
  • 65. Cause of sampling error The cause of the error discussed may be due to the biased sampling procedure. Every research should select sample(s) that is free from any bias and the sample(s) is representative of the entire population of interest. Another cause of this error is chance. the process of randomization and probability sampling is done to minimize the sampling process error but it is still possible that all the randomized subjects/ objects are not the representative of the population.
  • 66. WAYS TO REDUCE SAMPLING ERRORS  Increasing the sample size The sampling error can be reduced by increasing the sample size. If the sample size n is equal to the population size N, then the sampling error will be zero. • Improving the sample design i.e. By using the stratification The population is divided into different groups containing similar units.
  • 67. NUMERICAL ILLUSTRATION Child (x) 1 2 3 4 5 Age 2 4 6 8 10 Illustration: suppose that a baby sitter has 5 children under her supervision. The average age of these five children is 6 years and the age of each child.
  • 68. A CASE STUDY METHOD: SAMPLING
  • 69. RANDOM SAMPLING ISSUES IN A FEDERAL COURT CASE, A CASE STUDY KRISTIN KENNEDY AND JAMES BISHOP BRYANT UNIVERSITY, USA • The authors of this paper, statistics professors at Bryant University, recently had the opportunity to act as expert witnesses in a case involving the Internal Revenue Service (IRS) as the plaintiff. • The IRS used some sampling techniques in selecting a random sample that did not appropriately represent the population at hand. This action led the IRS to draw inferences about the population that were not likely conclusions on their part. • The purpose of this paper is to highlight the fact that fundamental mistakes are made in the business and legal world regarding sampling. This legal case is a good case study
  • 70. The defendant was the owner of a tax preparation firm with several locations, and he was directly or indirectly responsible for the preparation and filing of at least 24,399 federal income tax returns for the tax years 2003 through 2007. The IRS stated that they reviewed 345 returns of the 24,399 identified. Of the 345 which the IRS reviewed, 313 resulted in needing additional tax assessment. The IRS calculated from these 345 returns that the actual tax loss directly due to these returns being improperly prepared by the defendant(s) was in excess of $1.1 million . The IRS further stated that if this rate loss were applied to all 24,399 returns, then the estimated loss to the United States government would be in excess of $85 million for the years 2003 through 2007 (United States) . Thus the IRS was looking for damages close to 85 million dollars.
  • 71.  A simple random sample of n=345 is taken from the overall population, and 1.1 million dollars worth of discrepancies are found. (a) The IRS computed this number using a simple ratio of 1.1/313 = x/24,399. (b) This ratio calculates to x = 85.7 million, which similar to the figure they stated. (c ) The IRS should have used the ratio of 1.1/345 = x/24,399, and this ratio calculates to x = 77.8 million. There is almost an $8 million dollar difference in the two calculations. The Statistical professional stated professionally that, the first serious error was a fundamental sampling selection error. As we teach in any elementary statistics class, good statistical sampling is performed randomly from a population or sub-population. 345 returns could have been randomly selected from the entire population, and the analysis could then be performed by standard statistical methods.
  • 72. The IRS ignored stratified sampling from the population. For example, suppose the population of 24,399 had 61.5% returns with a schedule c attached. then 15,005 of the returns have a schedule c, and 38.5% of the returns for 9,394 pop. When the stratified sample is taken, 61.5% of 345, or 212, should be selected with schedule c and 38.5% of 345, or 133, should be selected without schedule c. A second approach to this problem would be to stratify the population. Suppose there are 4 different office locations, 4 different income levels of the clients, and 4 different years of returns. The number of sub-populations for stratifying is 4*4*4 = 64 This case study was a straight forward case that due to lack of implementation of well designed statistical techniques, the experts quoted that the IRS failed in its approach of fairness and professionalism, by unnecessarily framing defendant convicted, for which in reality the tax owner was correct and accurate.
  • 73. REFERENCES 1. Kothari, Vishwa Prakashan- Research Methodology 2. Random sampling issues in a federal court case, a case study Kristin Kennedy Bryant University, USA James Bishop Bryant University, USA 3. Weiss’s Introductory Statistics, Tenth Edition 4. Pearson, Statistics for Managers