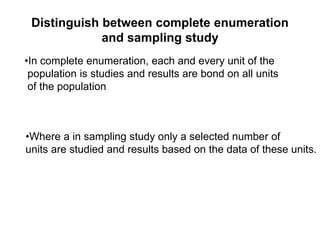
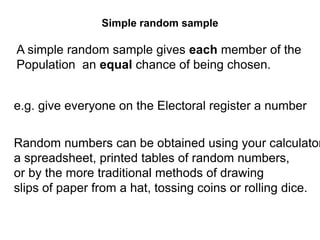
1) Sampling involves collecting data from a subset of individuals (the sample) rather than from the entire population.
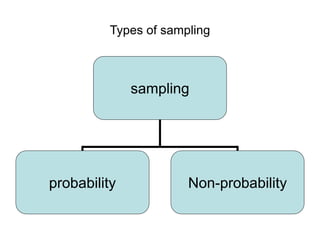
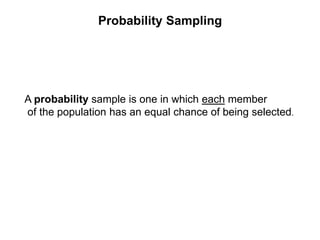
2) There are two main types of sampling: probability sampling, where each individual has a known chance of being selected, and non-probability sampling, where the probability of selection is unknown.
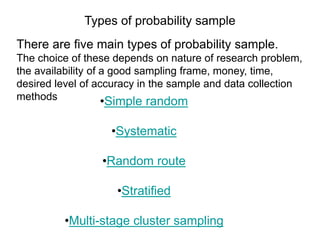
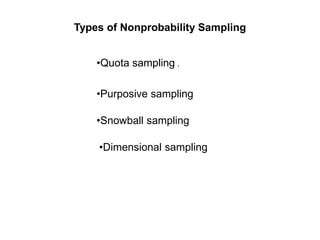
3) Common probability sampling methods include simple random sampling, stratified sampling, systematic sampling, and cluster sampling. Non-probability methods include quota sampling and snowball sampling.


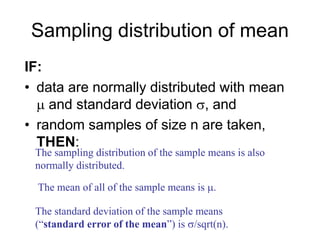
![Example
• Adult nose length is normally distributed
with mean 45 mm and standard deviation 6
mm.
• Take random samples of n = 4 adults.
• Then, sample means are normally
distributed with mean 45 mm and standard
error 3 mm [from 6/sqrt(4) = 6/2].](https://image.slidesharecdn.com/i-230721035708-66981282/85/SAMPLING-Theory-ppt-24-320.jpg)
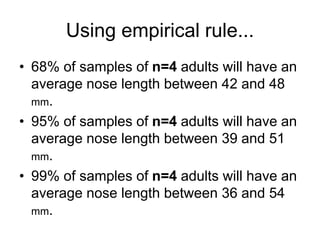
![What happens if we take larger
samples?
• Adult nose length is normally distributed
with mean 45 mm and standard deviation 6
mm.
• Take random samples of n = 36 adults.
• Then, sample means are normally
distributed with mean 45 mm and standard
error 1 mm [from 6/sqrt(36) = 6/6].](https://image.slidesharecdn.com/i-230721035708-66981282/85/SAMPLING-Theory-ppt-26-320.jpg)


