Download to read offline

![6
Sampling Distribution
Copyright © 2020, DexLab Solutions Corporation
SAMPLING FLUCTUATION
A particular sample drawn from a
given population includes different
set of population members.
Therefore, the value of the
estimator itself is lion to vary from
one sample to another. These
differences in the values of the
estimator are called the sampling
fluctuations of an estimator.
It may be defined as the probability law which the statistic follows , if repeated random samples of a
fixed size are drawn from specified population. A number of samples, each of size n, are taken from
the same population and if for each sample the values of the statistic is calculated, a series of values
of the statistic will be obtained. If the number of samples is large, these may be arranged into a
frequency table. The frequency distribution of the statistic that would be obtained if the number of
samples, each of the same size (say n), were infinite is called the Sampling distribution of the statistic.
Sampling distribution of sample mean
If x bar represents the mean of a random sample
of size n, drawn from a population with mean µ
and standard deviation σ, then the sampling
distribution of x bar is approximately a normal
distribution with Mean = µ and Standard
deviation = standard error of x bar. Provided the
sample size n is sufficiently large.
Sampling distribution of
sample proportion
If p represents the population of
defectives in a random sample of size n
drawn from a lot with proportion of
defective P, then the sampling
distribution of p is approximately a
normal distribution with
Mean = P and Standard deviation =
standard error of p,
Provide the sample size n is sufficiently
large.
Standard error of a static is the standard deviation calculated from the sampling distribution of the statistic .A
sampling distribution may have its mean, standard deviation and moments of higher orders. Of particular
importance is the standard deviation, which is designed as the standard error of the statistic. The mean of a
statistic will generally be the corresponding parameter, exactly or approximately. The standard error of the
gives an idea of the average error that one would commit is using the value of the statistic in lieu of the
parameter. It is illustrated as a case of random sampling the means and standard error of a sample mean and a
sample proportion. Some people prefer to use 0.6745 times the standard error, which is called probable error
of the statistic. The relevance of the probable error stems from the fact that for a normally distributed variable
x with mean µ and standard deviation σ,
P[µ - 0.6745σ <= x <= µ + 0.6745σ] = 0.50 , Approximately.
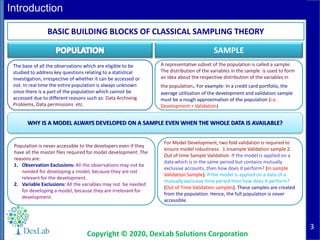
PARAMETER
Parameter is an unknown
numerical factor of the population.
The primary interest of any survey
lies in knowing the values of
different measures of the
population distribution of a
variable of interest. The measures
of population distribution involves
its mean, standard deviation etc.
which is calculated on the basis of
the population values of the
variable. In other words, the
parameter is a functional form of
all the population unit.
ESTIMATOR
An estimator is a measure
computed on the basis of sample
values. It is a functional from of all
sample observe prorating a
representative value of the
collected sample.
STATISTIC
Any statistical measure calculated
on the basis of sample
observations is called Statistic. Like
sample mean, sample standard
deviation, etc. Sample statistic are
always known to us.
Serial No. Mean
Standard
Deviation
Frequency
Relative
Frequency
Sample01 4456.25 3288.622 1 5.00%
Sample02 4617.25 2566.8 2 10.00%
Sample03 2006.25 754.08 1 5.00%
Sample04 4617.25 2566.8 1 5.00%
Sample05 2006.25 754.08 2 10.00%
Sample06 5553.75 4924.163 1 5.00%
Sample07 2006.25 754.08 3 15.00%
Sample08 4617.25 2566.8 3 15.00%
Sample09 2006.25 754.08 4 20.00%
Sample10 5553.75 4924.163 2 10.00%
Total 37440.5 23853.67 20 100.00%
0.00%
5.00%
10.00%
15.00%
20.00%
25.00%
RelativeFrequencies
Mean
Relative Frequency](https://image.slidesharecdn.com/dexlabbasicsofclassicalinferencesamplingtheoryv01250520201-200611105617/85/Basic-of-Statistical-Inference-Part-I-6-320.jpg)


This document provides an overview of classical sampling theory and statistical inference. It defines key terms like population, sample, parameter, estimator, and statistic. It also describes different types of sampling methods like random sampling, purposive sampling, stratified sampling, and simple random sampling with and without replacement. It explains the concept of sampling distribution and how the distribution of a statistic is approximated as the number of samples increases. It provides examples of sampling distributions for the sample mean and sample proportion. Finally, it reiterates the definitions of parameter, estimator, and statistic in the context of statistical analysis.


