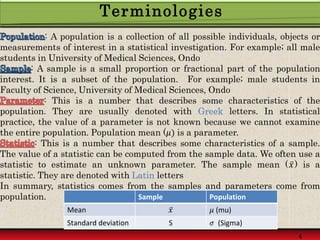
Statistical inference uses probability concepts to make conclusions about populations based on samples. It refers to using sample data to draw inferences about characteristics of the overall population. Key terms include:
- Population is the entire group being studied
- Sample is a subset of the population
- Parameter describes a characteristic of the population (unknown)
- Statistic describes a characteristic of the sample (known)
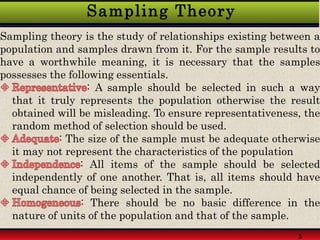
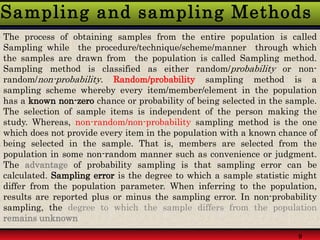
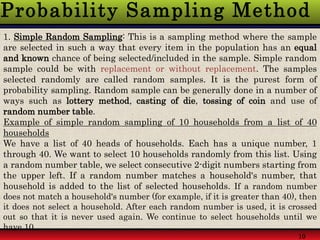
Probability sampling methods, like simple random sampling, give every member of the population a known chance of being selected in the sample. This allows estimating sampling error and making statistical inferences about the population. Non-probability sampling does not give all members an equal chance of selection.