Downloaded 148 times
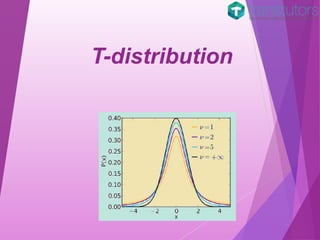

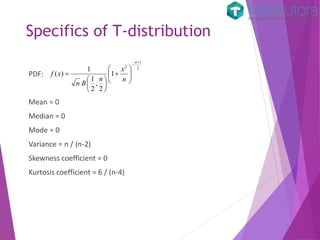
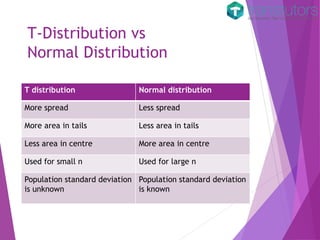


The t-distribution is a theoretical distribution that is useful for estimating population means from small samples when the population standard deviation is unknown. It was discovered by William S. Gosset in 1908 and is characterized by a mean, median, and mode of 0. The document compares t-distribution to normal distribution and outlines applications of various t-tests.