Nepse Technical Analysis 24 may - 29 may, 2015
•Download as DOCX, PDF•
0 likes•316 views

Nepse Technical Analysis 24 may - 29 may, 2015 (Eng & Nep)

Recommended
Recommended
More Related Content
What's hot
What's hot (20)
Viewers also liked
Viewers also liked (11)
Similar to Nepse Technical Analysis 24 may - 29 may, 2015
Similar to Nepse Technical Analysis 24 may - 29 may, 2015 (18)
More from Kriti Capital & Investments Ltd.
More from Kriti Capital & Investments Ltd. (20)
Recently uploaded
Recently uploaded (20)
Nepse Technical Analysis 24 may - 29 may, 2015
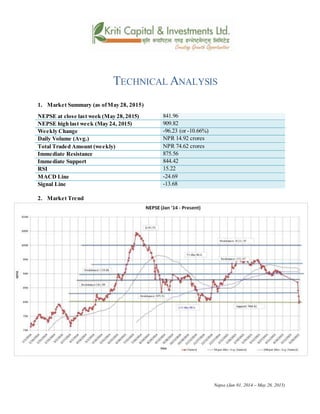
- 1. TECHNICAL ANALYSIS 1. Market Summary (as ofMay 28, 2015) NEPSE at close last week (May 28,2015) 841.96 NEPSE high last week (May 24, 2015) 909.82 Weekly Change -96.23 (or -10.66%) Daily Volume (Avg.) NPR 14.92 crores Total Traded Amount (weekly) NPR 74.62 crores Immediate Resistance 875.56 Immediate Support 844.42 RSI 15.22 MACD Line -24.69 Signal Line -13.68 2. Market Trend Nepse (Jan 01, 2014 – May 28, 2015)
- 2. 3. RSI RSI is a form of leading indicator that is believed to be most effective during periods of sideways movement. Such indicators may create numerous buy and sell signals that are useful when the market is not clearly trending upwards or downwards. RSI dropped to 25.26 levels during the beginning of the week. It fell throughout the week to end at 15.22 levels. The lowest RSI level during the week was at 12.32. RSI (Jan 01, 2014 – May 28, 2015) 4. MACD The MACD is a momentum oscillator formed by using two different types of moving averages, which provides specific buying or selling signals. When a MACD line crosses above the signal line, it is considered to be a positive sign and indicates a time to buy, and vice-versa. The MACD Line fell way below the signal line during the beginning of the week. Both the lines are in a negative territory. MACD at the end of last week stands at -24.69 and Signal Line at -11.01. MACD (Jan 01, 2014 – May 28, 2015) 5. Bollinger Bands The Bollinger Band is a technical indicator that consists of a moving average (21-day) along with two trading bands above (upper band) and below it (lower band). The bands are an indication of volatility, which are represented by calculating standard deviation. The NEPSE index made a sharp fall as soon as the market opened last week. By the end of the week, the index is still below the lower Bollinger band. Throughout the week, the upper and lower Bollinger bands have diverged tremendously, indicating high market volatility.
- 3. Bollinger Bands (Jan 01, 2014 – May 28, 2015) Overview: After a month since Nepal was hit by 7.9m earthquake, NEPSE finally opened for trade at the beginning of last week. As anticipated, Nepse declined most of last week, closing at 841.96. It declined by a total of 96.23 points (or 10.66%). The 50-day moving average has significantly converged with the 200-day moving average. However, the 50-day moving average still remains above the 200 day moving average. The average daily market volume decreased last week to NPR 14.92 crores. The RSI currently stands at 15.22. The MACD line is below the signal line, and both the lines are below the zero line. The upper and lower Bollinger bands are diverging, signifying high market volatility. Nepse’s current support and resistance level stands at 844.42 and 875.56 respectively.
- 4. k|fljlws ljZn]if0f ahf/ ;f/f+z -h]7 !$, @)&@ ;Ddsf]_ aGb cªs -h]7 !$, @)&@_ *$!=(^ pRr cªs -uPsf] ;ftf_ ()(=*@ ;fKtflxs kl/jt{g –(^=@# -–!)=^^ k|ltzt_ b}lgs cf};t Jofkf/ ¿=!$=(@s/f]8 s'n ;fKtflxs Jofkf/ ¿=&$=^@ s/f]8 tTsflng 6]jf *&%=%^ tTsflng k|lt/f]w *$$=$@ cf/P;cfO{ !%=@@ PdP;L8L –@$=^( l;UgnnfO{g –!#=^* बजारप्रवृत्ति
- 5. 6. Nepse (Jan 01, 2014 – May 28, 2015) l/n]l6j :6«]Gy OG8]S; -cf/P;cfO{_ cf/P;cfO{k|fljlws ljZn]if0fsf]o:tf] cf}hf/ xf], h;nfO{ Pstlkm{ ?kdf rln/x]sf] ahf/df Jofkf//0fgLltagfpg a9L pkof]uL dflgG5 . To;}u/L, o;n] ahf/df vl/b / ljlqmsf]:ki6 ;+s]t b]vfpg]u5{ . ;ftfsf]z'?df cf/P;cfO{@%=@^ cªsn] tn emof]{. To; kl5 klg cf/P;cfO{lg/Gt/ tn g} emg]{ s|d hf/L /xof] / ;ftf ;dfKtx'Fbf !%=@@ cªsdf /xg uof] . ;f] ;ftf cf/P;cfO{!@=#@cªs ;Dd emg{ uof] .
- 6. RSI (Jan 01, 2014 – May 28, 2015) d'leª Pe/]hsGeh]{G; 8fOeh]{G; -PdP;L8L_ PdP;L8Ldfb'O{cf]6f /]vf x'G5g, h;df Pp6fn]ahf/sf] lbzf kl/jt{gsf] ;+s]t u5{ eg] csf]{n] ahf/sf] k|j[lQ -6«]08_ b]vfpg]u5{ . olb PdP;L8L /]vfn] l;Ung /]vfnfO{ tnaf6 dfly sf6]df o;nfO{;sf/fTds ;+s]tsf ?kdflnO{G5 / o;n] z]o/x? lsGg] ;+s]t ub{5 . PdP;L8L nfO{g l;Ugn nfO{g lgs} tn g} emof]{. PdP;L8L tyf l;Ung nfO{g b'j} C0ffTds If]qdf /xg uof] . PdP;L8L nfO{g ;ftfsf] cGTolt/ –@$=^( df tyf l;Ugn nfO{g –!!=)! df /xg uof] . MACD (Jan 01, 2014 – May 28, 2015) af]lnªu/ Aof08 af]lnªu/ Aof08 Ps k|fljlws ljZn]if0f ;"rs xf] h;df @!–lbg]d'leË Pe/]hsf ;fy b'O{ Aof08 -Pp6f dfly_ / Pp6f tn_ x'G5g . lo Aof08x?n] cl:y/tfsf];+s]t ub{5g, h'g :6fG88{8]leP;g u0fgf u/]/ kQf nufO{G5 . g]K;] kl/;"rs ;ftfsf]z'?af6}lgs} tn emg]{ s|d hf/L /xof] . ;ftfsf]cGTo lt/ g]K;] kl/;"rs tNnf] Aof08 eGbf tn g} /xg uof] . dflyNnf] tyf tNnf] Aof08 Ps csf{af6 6f9f uO{/x]sf]cj:yfn] ahf/df cl:y/tf lgs} a9]sf] ;+s]t ub{5 .
- 7. Bollinger Bands (Jan 01, 2014 – May 28, 2015) ;du{dfM ljgfzsf/L e'sDk uPsf] Ps dlxgf kl5 ;+rfngdf cfPsf] g]K;] ;f]r] adf]lhd lg/Gt/ tn g} emof]{/ ;ftfsf]cGTodf*$!=(^ cªsdf ;dfKteof] . ;ftfsf] cGTo ;Ddf g]K;] kl/;"rs (^=@# cªsn] -!)=^^Ü_ 36g uof] . %)–lbg] d'leË Pe/]h @))–lbg] d'leË Pe/]h eGbf dfly g} /x]sf] cj:yf /xof] . cf};t sf/f]af/ /sd 36g uO{ ?= !$=(@ /xg uof] . cf/P;cfO{ xfn !%=@@ cªssf] l:yltdf /xg uof] . PdP;L8L nfO{g xfn l;Ugn nfO{g eGbf tn g} /xof] . b'j} nfO{g xfn z'Go nfO{g eGbf tn g} /x]sf] cj:yf 5 . tNnf] tyf dflyNnf] af]lnªu/ Aof08 Ps csf{af6 6f9fuO{/x]sf] cj:yfn] ahf/df cl:y/tf lgs} a9]sf] ;+s]t ub{5 . g]K;] kl/;"rsdf xfn 6]jf cªs tyf k|lt/f]w cªs s|dz M *$$=$@ tyf *&%=%^ /xg uof] .