Nepse technical analysis Apr 5 - Apr 9, 2015
•
0 likes•202 views

- NEPSE closed higher last week by 4.74 points ending at 946.89 points, with average daily trading volume and total weekly trading amount also increasing. - Technical indicators like RSI, MACD and Bollinger Bands signaled either neutral or buying conditions in the market by the end of the week. - Support and resistance levels for NEPSE remained unchanged at 938.41 and 972.17 points respectively, with the next support seen at 919.88 points if it falls further.

Recommended
Recommended
More Related Content
What's hot
What's hot (14)
Viewers also liked
Viewers also liked (15)
Similar to Nepse technical analysis Apr 5 - Apr 9, 2015
Similar to Nepse technical analysis Apr 5 - Apr 9, 2015 (18)
More from Kriti Capital & Investments Ltd.
More from Kriti Capital & Investments Ltd. (20)
Recently uploaded
Recently uploaded (20)
Nepse technical analysis Apr 5 - Apr 9, 2015
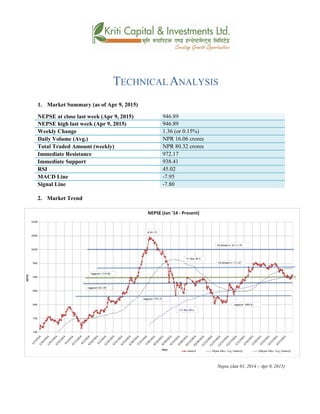
- 1. TECHNICAL ANALYSIS 1. Market Summary (as of Apr 9, 2015) NEPSE at close last week (Apr 9, 2015) 946.89 NEPSE high last week (Apr 9, 2015) 946.89 Weekly Change 1.36 (or 0.15%) Daily Volume (Avg.) NPR 16.06 crores Total Traded Amount (weekly) NPR 80.32 crores Immediate Resistance 972.17 Immediate Support 938.41 RSI 45.02 MACD Line -7.95 Signal Line -7.80 2. Market Trend Nepse (Jan 01, 2014 – Apr 9, 2015)
- 2. 3. RSI RSI is a form of leading indicator that is believed to be most effective during periods of sideways movement. Such indicators may create numerous buy and sell signals that are useful when the market is not clearly trending upwards or downwards. RSI was at 30 levels during the beginning of the week, reaching at 30.72, indicating a strong buy signal. However, the RSI shows to be moving at an upward trend and further away from the 30-levels. By the end of the week, the level moved up to 45.02 and is at a neutral zone. RSI (Jan 01, 2014 – Apr 9, 2015) 4. MACD The MACD is a momentum oscillator formed by using two different types of moving averages, which provides specific buying or selling signals. When a MACD line crosses above the signal line, it is considered to be a positive sign and indicates a time to buy, and vice-versa. The MACD and signal lines are still at a negative zone. The MACD line is reaching closer towards the signal line, indicating that it will make a crossover in the coming days. This would trigger a buy sign at the market. MACD at the end of last week stands at -7.95 and Signal Line at -7.80. MACD (Jan 01, 2014 – Apr 9, 2015) 5. Bollinger Bands The Bollinger Band is a technical indicator that consists of a moving average (21-day) along with two trading bands above (upper band) and below it (lower band). The bands are an indication of volatility, which are represented by calculating standard deviation.
- 3. The NEPSE index showed some improvement at the end of last week. The index is moving towards the mid-band, indicating neutrality. The upper and lower bands are also showing signs of convergence. This would again signify decline in market volatility. Bollinger Bands (Jan 01, 2014 – Apr 9, 2015) Overview: NEPSE made some improvement last week as it closed higher by 4.74 points (or 0.50%) at the last trading day to end at 946.89 points. It faced several swings at the beginning of the week. However, it closed higher than the week’s average of 939.38. The average daily market volume increased last week to NPR 16.06 crores from NPR 13.43 crores the week prior. The 50-day moving average is still increasing at a higher rate above the 200-day moving average suggesting that the overall outlook of the market remains positive. The RSI was at 30 levels at the beginning of the week, signifying buy-trigger. Currently standing at 45.02 levels, the RSI is at a neutral zone, and seems to be moving further away from the 30 level. The MACD line is likely cross over the signal line as it is moving closer towards it. This will indicate buy sign at the market. After a sharp fall made by the Upper Bollinger Band, it appears that the upper and lower bands might be converging, suggesting a decline in the market volatility. Nepse fell below its support level during the beginning of the week. However it rose again by the end of the week. Its current support and resistance level still stands the same at 938.41 and 972.17 points respectively. If Nepse makes a fall again, its next closest support level stands at 919.88.
- 4. k|fljlwsljZn]if0f ahf/ ;f/f+z -r}q @^, @)&!;Ddsf]_ aGb cªs -r}q @^, @)&!_ ($^=*( pRr cªs -uPsf] ;ftf_ ($^=*( ;fKtflxs kl/jt{g !=#^ -)=!%k|ltzt_ b}lgscf};t Jofkf/ ¿=!^=)^s/f]8 s'n ;fKtflxsJofkf/ ¿=*)=#@ s/f]8 tTsflng 6]jf (&@=!& tTsflngk|lt/f]w (#*=$! cf/P;cfO{ $%=)@ PdP;L8L –&=(% l;UgnnfO{g –&=*) बजारप्रवृित्त Nepse (Jan 01, 2014 – Apr 9,2015)
- 5. l/n]l6j :6«]Gy OG8]S; -cf/P;cfO{_ cf/P;cfO{ k|fljlwsljZn]if0fsf] o:tf] cf}hf/ xf], h;nfO{ Pstlkm{ ?kdfrln/x]sf] ahf/dfJofkf/ /0fgLlt agfpg a9L pkof]uL dflgG5 . To;}u/L, o;n] ahf/df vl/b / ljlqmsf] :ki6 ;+s]t b]vfpg] u5{ . of] uPsf] ;ftfsf] z'?dfcf/P;cfO{ #) cªssf] xf/fxf/Ldf /x]sf] lyof] h;n] ahf/df lsGg] ;+s]t k|bfg ub{5 . ;ftfsf] z'/cftLlbgx? kl5 cf/P;cfO{ a9g] sd hf/L /xof] / ;ftfsf] cGTolt/ cf/P;cfO{ $%=)@ sf] l:yltdf /xof] h;n] ahf/ km]l/ Go6«n cj:yfdfkms]{sf] ;+s]t ub{5 . RSI (Jan 01, 2014 – Apr 9, 2015) d'leª Pe/]hsGeh]{G; 8fOeh]{G; -PdP;L8L_ PdP;L8Ldf b'O{ cf]6f /]vf x'G5g, h;df Pp6fn] ahf/sf] lbzf kl/jt{gsf] ;+s]t u5{ eg] csf]{n] ahf/sf] k|j[lQ -6«]08_ b]vfpg] u5{ . olb PdP;L8L /]vfn] l;Ung /]vfnfO{ tnaf6 dfly sf6]df o;nfO{ ;sf/fTds ;+s]tsf ?kdflnO{G5 / o;n] z]o/x? lsGg] ;+s]t ub{5 . PdP;L8L tyf l;Ugn nfO{g clxn] klg g]u]l6e If]qd} /x]sf] 5 . PdP;L8LnfO{g xfn l;Ugn nfO{g glhs k'u]sf] 5 h;n] cfpg] lbgdf ;f] nfO{g n] l;Ugn nfO{gnfO{ s|; ug{ ;Sg]5 . h;n] ahf/df lsGg] xf]8afhLsf] ;+s]t ub{5 . PdP;L8LnfO{g ;ftfsf] cGtolt/ –&=(% tyf l;UgnnfO{g –&=*) df /xguof] .
- 6. MACD (Jan 01, 2014 – Apr 9, 2015) af]lnªu/ Aof08 af]lnªu/ Aof08 Ps k|fljlws ljZn]if0f ;"rsxf] h;df @!–lbg] d'leË Pe/]hsf ;fy b'O{ Aof08 -Pp6f dfly_ / Pp6f tn_ x'G5g . lo Aof08x?n] cl:y/tfsf] ;+s]t ub{5g, h'g :6fG88{ 8]leP;g u0fgf u/]/ kQfnufO{G5 . of] uPsf] ;ftfsf] cGTolt/ g]K;] kl/;"rsdf /fd|f] ;'wf/ b]lvof] . xfn g]K;] kl/;"rs dWoAof08 lt/ cl3 a9]sf] 5 h;n] ahf/ Go'6«n l:yltdf k'u]sf] ;+s]t ub{5 . dflyNnf] tyf tNnf] Aof08 glhs cfpgnfu]sf] cj:yfn] ahf/sf] cl:y/tfdf sdLcfPsf] ;+s]t ub{5 . Bollinger Bands (Jan 01, 2014 – Apr 9, 2015)
- 7. ;du{dfM of] uPsf] ;ftf g]K;] kl/;"rsdf /fd|f] ;'wf/ b]lvof] h;sf] kmn:j?k ahf/ ;ftfsf] clGtd sf/f]af/ lbg $=&$ cªsn] -)=%)Ü_ a9L ($^=*( cªsdf ;dfKt eof] / kl/;"rs ;ftfsf] cf};t (#(=#* eGbf dfly g} /xg uof] . cf};t sf/f]af/ /sddf ;d]t cl3Nnf] ;ftfeGbf j[l4 eO{ ?= !^=)^ sf] sf/f]af/ eof] . %)– lbg] d'leËPe/]hn] @))–lbg] d'leËPe/]hnfO{ sf6L dfly /x]sf] cj:yf / ;f]dfcfPsf] ultn] ahf/dfcem} ;sf/fTds ;+s]tx? g} oyfjt /x]sf 5g .;ftfsf] z'?cftLlbgdf #) cªssf] l:yltdf /x]sf] cf/P;cfO{ $%=)@ cªssf] l:yltdf kms]{sf] 5 h;n] ahf/nfO} k'gM Go"6«n cj:yfdfNofPsf] 5 . PdP;L8L nfO{gn] l;UgnnfO{gnfO{ s|;ug]{ nfu]sf] cj:yfn] ahf/dfcalsGg] xf]8afhLsf] ;+s]t ub{5 . af]lnªu/ Aof08n] ahf/sf] cl:yt/tfdf s]xL sdL cfPsf] ;+s]tub{5 . ;ftfsf] z'?cftL lbgdf 6]jf cªs eGbf tn em/]sf] kl/;"rs ;ftfsf] cGTolt/ dfly r9of] / g]K;] kl/;"rsdf uPsf] ;ftfklg 6]jfcªs (#*=$!cªs /xguPsf] 5 / k|lt/f]w cªs klg(&@=!& g} /x]sf] 5 . t/ g]K;] kl/;"rs 36g] s|dhf/L /x]df glhsf] 6]jfcªs (!(=** /xg] 5 .