Nepse technical analysis sep 07 sep 11, 2014 (eng & nep)
•
0 likes•193 views

Technical analysis of Nepal Stock Exchange (Nepse) index for the week from September 07, 2014 to September 11, 2014. The technical analysis includes summary, RSI, MACD and Bollinger band analysis. The analysis is done by Kriti Capital & Investments Ltd.

Recommended
Recommended
More Related Content
What's hot
What's hot (14)
Viewers also liked
Viewers also liked (9)
Similar to Nepse technical analysis sep 07 sep 11, 2014 (eng & nep)
Similar to Nepse technical analysis sep 07 sep 11, 2014 (eng & nep) (20)
More from Kriti Capital & Investments Ltd.
More from Kriti Capital & Investments Ltd. (20)
Recently uploaded
Recently uploaded (20)
Nepse technical analysis sep 07 sep 11, 2014 (eng & nep)
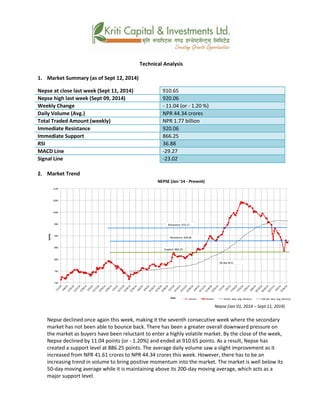
- 1. Technical Analysis 1. Market Summary (as of Sept 12, 2014) Nepse at close last week (Sept 11, 2014) 910.65 Nepse high last week (Sept 09, 2014) 920.06 Weekly Change - 11.04 (or - 1.20 %) Daily Volume (Avg.) NPR 44.34 crores Total Traded Amount (weekly) NPR 1.77 billion Immediate Resistance 920.06 Immediate Support 866.25 RSI 36.88 MACD Line -29.27 Signal Line -23.02 2. Market Trend Nepse (Jan 01, 2014 – Sept 11, 2014) Nepse declined once again this week, making it the seventh consecutive week where the secondary market has not been able to bounce back. There has been a greater overall downward pressure on the market as buyers have been reluctant to enter a highly volatile market. By the close of the week, Nepse declined by 11.04 points (or - 1.20%) and ended at 910.65 points. As a result, Nepse has created a support level at 886.25 points. The average daily volume saw a slight improvement as it increased from NPR 41.61 crores to NPR 44.34 crores this week. However, there has to be an increasing trend in volume to bring positive momentum into the market. The market is well below its 50-day moving average while it is maintaining above its 200-day moving average, which acts as a major support level.
- 2. 3. RSI RSI is a form of leading indicator that is believed to be most effective during periods of sideways movement. Such indicators may create numerous buy and sell signals that are useful when the market is not clearly trending upwards or downwards. The RSI picked up slightly this week, but is still hovering above the oversold zone line of 30 levels. Due to lack of buying power among investors, the RSI shows that the market has remained in the bottom half. This past week, the RSI increased from 31.57 levels to 36.88 levels. RSI (Dec 01, 2013 – Sept 11, 2014) 4. MACD The MACD is a momentum oscillator formed by using two different types of moving averages, which provides specific buying or selling signals. When a MACD line crosses above the signal line, it is considered to be a positive sign and indicates a time to buy, and vice-versa. Though the RSI showed a slight increase this week, the MACD indicator showed a continuous downward momentum this week as well. It indicates that investors have been in a selling mood this week as the MACD and Signal lines closed at -29.27 and -23.02 levels respectively. MACD (Dec 01, 2013 – Sept 11, 2014) 5. Bollinger Bands The Bollinger Band is a technical indicator that consists of a moving average (21-day) along with two trading bands above (upper band) and below it (lower band). The bands are an indication of volatility, which are represented by calculating standard deviation. The Nepse line initially crossed below the lower band on Sunday but bounced back to close between the mid band and lower band. However, with continuous fall in Nepse, the widening of the bands continued this week as well indicating high volatility in the market.
- 3. Bollinger Bands (Dec 01, 2013 – Sept 11, 2014) Overview: Nepse witnessed transactions during 4 of the 5 trading days this week that involved high volatility. On Sunday Nepse dropped by 5% but came back soaring on the next trading day rising by 5.08%. By the end of the week, the secondary market closed down 11.04 points (or - 1.20%) to 910.65 points. The volume saw a slight increase from its previous daily average volume of NPR 41.61 crores to NPR 44.34 crores this week. Nepse created a support level of 886.25 points this week. The RSI fell into the oversold zone during the first trading day but managed to close at 36.88 levels. The MACD indicator however showed downward momentum as the MACD and Signal line fell to -29.27 and -23.02 levels respectively. The Bollinger Bands indicate high volatility in the market represented by the widening bands. The volatility also suggests that the market is looking for direction in the near term. The market needs to witness increasing volume for it to move past the upper resistance levels.
- 4. k|fljlws ljZn]if0f ahf/ ;f/f+z -efb| @@ b]vL efb| @^ ;Ddsf]_ aGb cªs -efb| @^_ M (!)=^% pRr cªs -efb| @$_ M (@)=)^ ;fKtflxs kl/jt{g M –!!=)$ cªs -–!=@) k|ltzt_ b}lgs cf};t Jofkf/ M ¿= $$=#$ s/f]8 s'n ;fKtflxs Jofkf/ M ¿= ! ca{ && s/f]8 tTsflng 6]jf M (@)=)^ tTsflng k|lt/f]w M *^^=@% cf/P;cfO{ M #^=** PdP;L8L M –@(=@& l;Ugn nfO{g M –@#=)@ %) tyf @)) lbg] d'leª Pe/]h nuftf/ ;ftf}F xKtf b]lv g]K;]df p5fn cfpg ;s]sf] 5}g / g]K;] o; xKtf km]/L 36]sf] 5 . nufgLstf{x? cToflws cl:y/ ahf/df k|j]z ug{ grfx]sf sf/0f ahf/df lu/fj6sf] bafa k/]sf] 5 . ;ftfsf] cGTo ;Dddf, g]K;] !!=)$ cªs -jf !=@) k|ltzt_ n] 36]/ (!)=^% cªsdf aGb ePsf] 5 . kmn:j?k, g]K;]df **#=@% cªssf] gofF ;dy{g tx l;h{gf ePsf] 5 . o; ;ftf, cf}ift b}lgs Jofkf/ -ef]No"d_ df eg] ;fgf] ;'wf/ b]lvPsf] 5 / of] $!=^! s/f]8 ?k}Fofaf6 a9]/ $$=#$ s/f]8 ?k}Fof k'u]sf] 5 . Jofkf/ -ef]No"d_ df j[l4sf] k|j[ltn] ahf/df ;sf/fTds ult NofPsf] 5 . ahf/ %)–lbg] d'leË Pe/]h eGbf d'gL /x]sf] 5 t/ @))–lbg] d'leË Pe/]h eGbf dfly /x]sf] 5 h'g ahf/sf nflu k|d'v ;dy{gsf ?kdf /x]sf] 5 . Nepse (Jan 01, 2014 – September 11, 2014)
- 5. l/n]l6j :6«]Gy OG8]S; -cf/P;cfO{_ cf/P;cfO{ k|fljlws ljZn]if0fsf] o:tf] cf}hf/ xf], h;nfO{ Pstlkm{ ?kdf rln/x]sf] ahf/df Jofkf/ /0fgLlt agfpg a9L pkof]uL dflgG5 . To;}u/L, o;n] ahf/df vl/b / ljlqmsf] :ki6 ;+s]t b]vfpg] u5{ . cf/P;cfO{df yf]/} ;'wf/ cfPsf] 5 t/ of] ce}m klg #) cªssf] cf]e/;f]N8 If]q eGbf dfly g} /x]sf] 5 . nufgLstf{x? lar vl/bdf sdLsf sf/0fn], cf/P;cfO{ tNnf] cfwf If]qdf /x]sf] 5 . o; ;ftf, cf/P;cfO{ #!=%& cªs af6 a9]/ #^=** cªs k'u]sf] 5 . RSI (Jan 01, 2013 – September 11, 2014) d'leª Pe/]h sGeh]{G; 8fOeh]{G; -PdP;L8L_ PdP;L8Ldf b'O{ cf]6f /]vf x'G5g, h;df Pp6fn] ahf/sf] lbzf kl/jt{gsf] ;+s]t u5{ eg] csf]{n] ahf/sf] k|j[lQ -6«]08_ b]vfpg] u5{ . olb PdP;L8L /]vfn] l;Ung /]vfnfO{ tnaf6 dfly sf6]df o;nfO{ ;sf/fTds ;+s]tsf ?kdf lnO{G5 / o;n] z]o/x? lsGg] ;+s]t ub{5 . o; ;ftf, cf/P;cfO{df yf]/} ;'wf/ cfP klg, PdP;L8L ;"rsdf eg] nuftf/ lu/fj6 k|j[lt b]lvPsf] 5 . PdP;L8L / l;Ugn /]vf s|dzM –@(=@& / –@#=)@ cªsdf /x]sf] 5 h;n] nufgLstf{x? lals| d"8df /x]sf] ;+s]t u/]sf] 5 . MACD (Jan 01, 2013 – September 11, 2014) af]lnªu/ Aof08 af]lnªu/ Aof08 Ps k|fljlws ljZn]if0f ;"rs xf] h;df @!–lbg] d'leË Pe/]hsf ;fy b'O{ Aof08 -Pp6f dfly_ / Pp6f tn_ x'G5g . lo Aof08x?n] cl:y/tfsf] ;+s]t ub{5g, h'g :6fG88{ 8]leP;g u0fgf u/]/ kQf nufO{G5 . g]K;] /]vfn] ;'?df tNnf] Aof08 kf/ u/]sf] lyof] t/ of] a9]/ tNnf] / dWo Aof08 lar aGb ePsf] 5 . t/, g]K;]df lu/fj6 ;+u}, b'O{ Aof08x? lar b'/L a9L/x]sf] 5 h;n] ahf/df pRr cl:y/tf /x]sf] ;+s]t u/]sf] 5 .
- 6. Bollinger Bands (Jan 01, 2013 – September 11, 2014) ;du{dfM o; ;ftf g]K;]df % sf/f]af/ lbg dWo] $ sf/f]af/ lbg pRr cl:y/tf b]lvPsf] 5 . cfO{taf/ g]K;] % k|ltztn] 36]sf] lyof] t/ csf]{ sf/f]af/ lbgdf eg] g]K;] %=)* k|ltztn] lkmtf{ kmls{of] . xKtfsf] cGTo;Dd, ahf/ !!=)$ cªs -jf !=@) k|ltzt_ n] 36]/ (!)=^% cªsdf aGb ePsf] 5 . o; ;ftf, cf}ift b}lgs Jofkf/ -ef]No"d_ df eg] ;fgf] ;'wf/ b]lvPsf] 5 / of] $!=^! s/f]8 ?k}Fofaf6 a9]/ $$=#$ s/f]8 ?k}Fof k'u]sf] 5 . g]K;]df **^=@% cªssf] gofF ;dy{g tx v8f ePsf] 5 . cf/P;cfO{ kl5Nnf] sf/f]af/ lbg cf]e/;f]N8 If]qdf k'u]sf] lyof] t/ cGTodf #^=** cªsdf aGb ePsf] 5 . PdP;L8L / l;Ugn /]vf s|dzM –@(=@& / –@#=)@ cªsdf /x]sf] 5 h;n] nufgLstf{x? lals| d"8df /x]sf] ;+s]t u/]sf] 5 . Aof08x? lar b'/L a9]sf sf/0f af]lnË/ Aof08n] ahf/df pRr cl:y/tfsf] ;+s]t u/]sf] 5 . o; cl:y/tfn] lgs6 eljiodf ahf/n] lbzf lgb]{zg ug{ vf]hL/x]sf] ;+s]t u/]sf] 5 . ;du{df, ahf/n] k|lt/f]w tx kf/ ug{sf nflu Jofkf/ -ef]No"d_ df ;'wf/ cfpg cfjZos /x]sf] 5 .