Nepse Technical Analysis 26 July - 30 July, 2015
•
0 likes•288 views

Nepse Weekly Technical Analysis 26 July - 30 July, 2015

Recommended
Recommended
More Related Content
What's hot
What's hot (20)
Viewers also liked
Viewers also liked (12)
Similar to Nepse Technical Analysis 26 July - 30 July, 2015
Similar to Nepse Technical Analysis 26 July - 30 July, 2015 (12)
More from Kriti Capital & Investments Ltd.
More from Kriti Capital & Investments Ltd. (16)
Recently uploaded
Recently uploaded (20)
Nepse Technical Analysis 26 July - 30 July, 2015
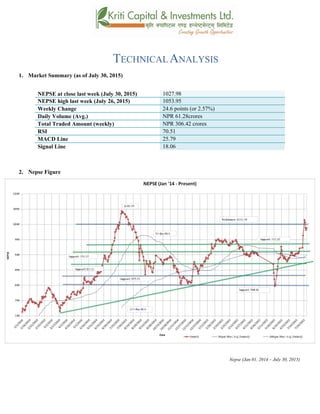
- 1. TECHNICALANALYSIS 1. Market Summary (as of July 30, 2015) NEPSE at close last week (July 30, 2015) 1027.98 NEPSE high last week (July 26, 2015) 1053.95 Weekly Change 24.6 points (or 2.57%) Daily Volume (Avg.) NPR 61.28crores Total Traded Amount (weekly) NPR 306.42 crores RSI 70.51 MACD Line 25.79 Signal Line 18.06 2. Nepse Figure Nepse (Jan 01, 2014 – July 30, 2015)
- 2. 3. Trend Analysis At the beginning of last week, the market experienced an extraordinary bullish momentum. This bullish response in the market is most likely due to the news regarding the monetary policy announcement. The market closed at 1053.95 at 1:14PM on Sunday of last week after it faced three consecutive circuit breaks. However, the market ended in the red for the rest of the week. This does not seem as troubling since the market seems to be going through its correction phase. As expected, the 50-day MA has surpassed the 200- day MA, signifying the overall market trend looks positive. 4. Resistance and Support Immediate Support 972.17 Support 2 950.97 Immediate Resistance 1036.98 Resistance 2 1083.55 The lowest Nepse went down to last week was at 1021.33. The benchmark index surged 50.57 points (5.04%) to end at 1053.95 on the first trading day of last week. It had surpassed its current resistance level of 1036.98 during the beginning of the week. However, it fell below 1036.98 resistance level after Nepse went through some corrections. The current immediate support and resistance level now stands at 972.17 and 1036.98 respectively. 5. Trend Indicator a.) MACD The MACD is a momentum oscillator formed by using two different types of moving averages, which provides specific buying or selling signals. When a MACD line crosses above the signal line, it is considered to be a positive sign and indicates a time to buy, and vice-versa. Both the Macd and signal lines increased last week. The macd line is moving above the signal line and the distance between them has increased significantly, indicating a bullish outlook of the market. This bullish view of the market seems to continue in the coming periods. By the end of the week, the macd and signal lines ended at 25.79 and 18.06 respectively. b.) RSI RSI is a form of leading indicator that is believed to be most effective during periods of sideways movement. Such indicators may create numerous buy and sell signals that are useful when the market is not clearly trending upwards or downwards.
- 3. The RSI hovered above the 70-level majority of last week. It showed a period of strong over-bought condition in the market. At the beginning of last week, the RSI was at 86.85. By the end of the week, the RSI fell and ended at 70.51, showing that buying pressure still prevails in the market. c.) Bollinger Bands The Bollinger Band is a technical indicator that consists of a moving average (21-day) along with two trading bands above (upper band) and below it (lower band). The bands are an indication of volatility, which are represented by calculating standard deviation. The benchmark index remained above the upper Bollinger band most of last week, signifying buying pressure in the market. The upper and lower bands have diverged greatly as well. This shows that the market has increased in volatility. 6. Volume Indicator (On-Balance Volume) On-Balance Volume (OBV) is a momentum indicator that relates volume to the current price of the index or security. It measures buying and selling pressure at the market. It acts as a cumulative indicator that adds volume on up days and subtracts volume on down days. If a price increase is supported by OBV, it confirms an uptrend, whereas if a price decrease is supported by OBV, it confirms a downtrend.
- 4. Last week, the On-Balance Volume (OBV) did not show clear signs of increase as compared to the spike witnessed by the index. The OBV increased rather at a slower rate as compared to the surge in the Nepse index. However, both the index and OBV fell as a result of various corrections. By the end of the week, both the OBV and the index increased again. The average weekly volume transactions increased to NPR 61.28 crores from NPR 46.61 crores the week prior. This increase in the volume transactions last week is likely due to the market sentiment of profit booking. The turnover on Monday last week ended at a staggering 1,306,274,240. 7. Overview The Nepse index experienced high volatility last week. It made a staggering gain of -- points (or up 4.38%) last week to close at --. As anticipated, the 50-day moving average (MA) is moving above the 200-day MA, indicating a bullish attitude in the market as the 50-day MA will move above the 200-day MA. The average weekly volume transactions increased to NPR 61.28 crores from NPR 46.61crores the week prior. The RSI is still hovering around the 70-level, indicating an over-bought condition. The Bollinger bands show prevalence of high market volatility as the distance between the upper and lower bands have widened. The support and resistance level still stands at 972.17 and 1036.98 respectively.
- 5. k|fljlwsljZn]if0f !_ahf/ ;f/f+z ->fj0f !$, @)&@ ;Ddsf]_ aGb cªs ->fj0f !$, @)&@_ !)@&=(* pRr cªs -uPsf] ;ftf_ !)%#=(% ;fKtflxs kl/jt{g @$=^ -@=%&k|ltzt_ b}lgscf};t Jofkf/ ¿=^!=@*s/f]8 s'n ;fKtflxsJofkf/ ¿ #)^=$@ s/f]8 cf/P;cfO{ &)=%! PdP;L8L @%=&( l;UgnnfO{g !*=)^ @_ ahf/ k|j[lt
- 6. Nepse (Jan 01, 2014 – July30, 2015) #_ 6]«G8 ljZn]if0f uPsf] ;ftfsf] z'?df ;f]r] cg'?kahf/dfa'lnz 6]G8« b]lvof] . g]kfn /fi6« a}+sn] 3f]if0ff u/]sf] df}lb|sgLltkZrft ahf/ lgs} a9g uof] . ;ftfsf] klxnf] sf/f]af/ lbgcfO{taf/ g]K;] kl/;"rs ;f] lbgtLg kN6 nfu]sf] ;ls{6sf] kmn:j?k !)%#=(% cªsdfaGbeof] t/ To; kZrft ;f]r] cg'?k g]K;] kl/;"rsdflu/fj6 g} cfof] / ahf/ s/]S;glt/ uof] . uPsf] ;ftfx?dfcg'dfg u/] cg';f/ %) lbg] d'leËPe/]h n] @)) lbg] d'leËPe/]hnfO{ sf6]sf] cj:yfn] xfnahf/sf] cj:yf /fd|f] /x]sf] ;+s]t ub{5 . $_ 6]jftyfk|lt/f]w cªs glhssf] 6]jfcªs (&@=!& 6]jfcªs @ (%)=(& glhssf] k|lt/f]w cªs !)#^=(* k|lt/f]w cªs @ !)*#=%% uPsf] ;ftf g]K;] kl/;"rs ;a}eGbftn!)@!=##cªs ;Dd/x]sf] lyof] / g]K;] kl/;"rsdfuPsf] ;ftfsf] klxnf] sf/f]af/ lbg%=)$Ü -%)=%&cªsf]_sf] a[l4 eO{ !)%#=(%cªsdfk'Uguof] . kl/;"rsn] cfkmgf] k|lt/f]w cªs!)#^=(*kf/ u/]sf] 5 . t/ g]K;] kl/;"rsdf s]xL s/]S;g b]lvP kl5 g]K;] !)#^=(* cªseGbftnemg{ uof] .xfnsf] nflu 6]jfcªstyfk|lt/f]w cªs (&@=!&tyf !)#^=(* /x]sf] 5 . %_ g]K;] 6]«G8 ;"rs s_ d'leª Pe/]hsGeh]{G; 8fOeh]{G; -PdP;L8L_ PdP;L8Ldf b'O{ cf]6f /]vf x'G5g, h;df Pp6fn] ahf/sf] lbzf kl/jt{gsf] ;+s]t u5{ eg] csf]{n] ahf/sf] k|j[lQ -6«]08_ b]vfpg] u5{ . olb PdP;L8L /]vfn] l;Ung /]vfnfO{ tnaf6 dfly sf6]dfo;nfO{ ;sf/fTds ;+s]tsf ?kdflnO{G5 / o;n] z]o/x? lsGg] ;+s]t ub{5 . PdP;L8LnfO{gtyfl;UgnnfO{g b'j} uPsf] ;ftfa9g uof] . xfnsf] cj:yfdf PdP;L8L nfO{gclxn] klgl;UgneGbfdfly g} /x]sf] 5 / ;f] b'O{ nfO{g aLrsf] b'/L ;d]t a9L /x]sf] 5 h;n] ahf/dfa'lnz 6]«G8sf] ;+s]t ub{5 .xfnsf] cj:yfdfahf/sf] a'lnz 6]«G8 a9g ;Sg] ;+s]t /x]sf] 5 .xfnsf] nfluPdP;;L8L nfO{g tyfl;UgnnfO{g @%=&(tyf!*=)^df /x]sf] 5 .
- 7. v_ l/n]l6j :6«]Gy OG8]S; -cf/P;cfO{_ cf/P;cfO{ k|fljlwsljZn]if0fsf] o:tf] cf}hf/ xf], h;nfO{ Pstlkm{ ?kdfrln/x]sf] ahf/dfJofkf/ /0fgLlt agfpg a9L pkof]uL dflgG5 . To;}u/L, o;n] ahf/dfvl/b / ljlqmsf] :ki6 ;+s]t b]vfpg] u5{ . uPsf] ;ftfsf/f]af/sf] w]/}h;f] lbgcf/P;cfO{ &) cªsf] n]endf g} /xguof] . h;n] ahf/ cf]e/ a6sf] l:yltdf nfdf] ;dosf] nlfu /x]sf] ;+s]t ub{5 . ;ftfsf] z'?df *^=*% cªsdf /x]sf] cf?P;cfO{ ;ftfsf] cGTodf 36]/ &)=%! cªsdf /xguof] h;n] ahf/dflsGg] xf]8afhL cem} /x]sf] ;+s]t ub{5 . u_ af]lnªu/ Aof08 af]lnªu/ Aof08 Ps k|fljlwsljZn]if0f ;"rsxf] h;df @!–lbg] d'leËPe/]hsf ;fyb'O{ Aof08 -Pp6f dfly_ / Pp6f tn_ x'G5g . lo Aof08x?n] cl:y/tfsf] ;+s]t ub{5g, h'g :6fG88{ 8]leP;g u0fgf u/]/ kQfnufO{G5 . uPsf] ;ftf w]/} h;f] sf/f]af/ lbgdfg]K;] kl/;"rsdflyNnf] af]lnªu/ Aof08eGbfdfly g} /xguof] h;n] ahf/ xfnsf] nflucf]e/a6sf] cj:yf /x]sf] ;+s]t ub{5 . pkNnf] tyftNnf] Jof08 aLrsf] a9g uPsf] b'/Ln]ahf/dfcl:y/tf a9g uPsf] ;+s]t ub{5 .
- 8. ^_ eNo'd ;'rs -cg–Aofn]G; eNo'd_ cg–Aofn]G; eNo'd n] ahf/dflsGg] tyf a]Rg] k|];/sf] ;+s]t ub{5 . ;d|udf of] ;"rsn] ahf/ dflyuPsf] cj:yftyftnem/]sf] cj:yfdfahf/dfsf/f]af/sf] eNo'd s:tf] /xof] ;+s]t ub{5 .
- 9. uPsf] ;ftfcg–Aofn]G; eNo'ddfg]K;] kl/;"rs ;/x pRr p5fn b]lvPg . cg–Aofn]G; eNo'd g]K;] kl/;"rseGbf s]xLsdultdf g} a9g uof] . t/ b'j} ;"rsg]K;]df b]lvPsf] s/]S;gsf] ;ftfsf] dWolt/ s]xLtneg{ uof] / ;ftfsf] cGTolt/ b'j} ;"rs s]xLdfly a9g uof] . ;ftfsf] cf};t sf/f]af/ /sddf ;d]t lgs} g} ;'wf/ b]lvof] hf] uPsf] ;ftf cl3Nnf] ;ftf ?= $^=^! s/f]8lyof] eg] uPsf] ;ftf ?= ^!=@* s/f]8df /xguof] .uPsf] ;ftf ;f]daf/sf] lbg g]K;] kl/;"rsdf ?= !,#)^,@&$,@$)÷–hltsf] sf/f]af/ eof] hf] ahf/dfnufgLstf{x? dfemcfkmgf] sf/f]af/sf] gfkmf a's ug]{ lt/ nfu]sf] ;+s]t b]lvof] .hf] xfn ;Ddsf] pRrsf/f]af/ dWo Ps xf] . ;du{dfM uPsf] ;ftf g]K;] kl/;"rsdflgs} g} cl:yl/tf b]lvof] .g]K;] kl/;"rsdf %=)$Ü cªssf] a[l4 b]lvof] . ;f]r] cg'?k %) lbg] d'leËPe/]h @)) lbg] d'leËPe/]hnfO{ sf6L dfly lxl8/x]sf] cj:yf /xof] h;n] ahf/dfa'lnz 6]«G8sf] ;+s]t ub{5 .cf};t sf/f]af/ /sddf ;d]t lgs} ;'wf/ b]lvof] hf] uPsf] ;ftf ?= ^!=@* s/f]8 /xguof] / ;f] /sd cl3Nnf] ;ftfeg] ?= $^=^! s/f]8 /x]sf] lyof] .&) cªsdfrln/x]sf] cf/P;cfO{n] clxn] klgahf/ cf]e/ a6sf] l:yltdf /x]sf] ;+s]t ub{5 . af]lnªu/ Jof08n]ahf/sf] cl:yt/tflgs} a9]sf] ;+s]t ub{5 . xfnsf] nflugofF 6]jfcªstyfk|lt/f]w cªs (&@=!&tyf!)#^=(* /x]sf] 5 .