NEPSE Technical Analysis: Bullish Outlook Continues
•
0 likes•140 views

- The Nepse index gained 48.58 points last week to close at 1566.7, above the 50-day and 200-day moving averages, indicating an overall positive market condition. - Technical indicators like MACD and RSI show the market is in a bullish momentum phase, while Bollinger bands signal moderate volatility. - Immediate support and resistance levels for the index remain at 1463 and 1600 respectively. The market outlook is positive if MACD line crosses above the signal line in coming weeks.

Recommended
Recommended
More Related Content
What's hot
What's hot (20)
Viewers also liked
Viewers also liked (10)
Similar to NEPSE Technical Analysis: Bullish Outlook Continues
Similar to NEPSE Technical Analysis: Bullish Outlook Continues (8)
More from Kriti Capital & Investments Ltd.
More from Kriti Capital & Investments Ltd. (17)
Recently uploaded
Recently uploaded (20)
NEPSE Technical Analysis: Bullish Outlook Continues
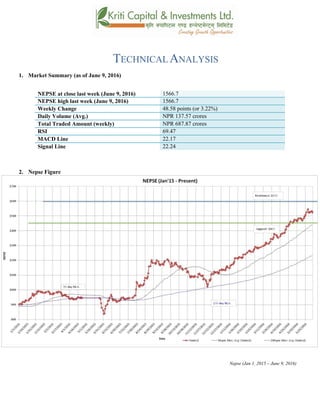
- 1. TECHNICAL ANALYSIS 1. Market Summary (as of June 9, 2016) NEPSE at close last week (June 9, 2016) 1566.7 NEPSE high last week (June 9, 2016) 1566.7 Weekly Change 48.58 points (or 3.22%) Daily Volume (Avg.) NPR 137.57 crores Total Traded Amount (weekly) NPR 687.87 crores RSI 69.47 MACD Line 22.17 Signal Line 22.24 2. Nepse Figure Nepse (Jan 1, 2015 – June 9, 2016)
- 2. 3. Trend Analysis The Nepse index gained 48.58 points (or up 3.22%) last week to close at 1566.7. The benchmark index went through a correction mode the week prior. The index lost 34.98 points on Sunday of last week. However, it climbed up for the rest of the week. Nepse continues to run above the 50 days moving average, as well as the 200 days moving average, indicating that the long term trend looks positive. The insurance sector pushed up the index as investors seem bullish on the sector. 4. Resistance and Support Immediate Support 1463 Support 2 1390 Immediate Resistance 1600 Resistance 2 The Nepse index reached an all time height of 1566.7 last week. After going through its correction mode, the index continued its bullish run. As mentioned in the previous article, the long term outlook of the index looks good, and Nepse could break its resistance level of 1600 in the coming weeks. Currently the immediate support and resistance level stands the same at 1463 and 1600 respectively. 5. Trend Indicator a.) MACD The MACD is a momentum oscillator formed by using two different types of moving averages, which provides specific buying or selling signals. When a MACD line crosses above the signal line, it is considered to be a positive sign and indicates a time to buy, and vice-versa. The Macd and the signal line, at the beginning of last week, stood at 19.75 and 25.20 respectively. The Macd line moving below the signal line signifies a bearish outlook. However, towards the end of the week, the macd and the signal line ended at 22.17 and 22.24 respectively. The macd indicator shows that the market is still in a bullish momentum.
- 3. b.) RSI RSI is a form of leading indicator that is believed to be most effective during periods of sideways movement. Such indicators may create numerous buy and sell signals that are useful when the market is not clearly trending upwards or downwards. The RSI at the beginning of last week stood at 47.37 points. The RSI reaching the 40’s zone indicate a selling pressure in the market. However, towards the end of the week, the RSI gained 22.10 points to end at 69.47 level. This indicates that the market is experiencing buying pressure again, as investors continue to have a strong bullish sentiment. c.) Bollinger Bands The Bollinger Band is a technical indicator that consists of a moving average (21-day) along with two trading bands above (upper band) and below it (lower band). The bands are an indication of volatility, which are represented by calculating standard deviation. The benchmark index reached below the mid bollinger band, signifying a decrease in buying pressure in the market. However, in the course of the week, the index climbed up towards the upper band indicating an increase in over-bought condition in the market. The distance between the upper and lower band has remained constant, signifying moderate market volatility.
- 4. 6. Volume Indicator (On-Balance Volume) On-Balance Volume (OBV) is a momentum indicator that relates volume to the current price of the index or security. It measures buying and selling pressure at the market. It acts as a cumulative indicator that adds volume on up days and subtracts volume on down days. If a price increase is supported by OBV, it confirms an uptrend, whereas if a price decrease is supported by OBV, it confirms a downtrend. The On-Balance Volume (OBV), as well as the Nepse index, climbed up for most of last week, indicating a bullish momentum. The average weekly volume transactions increased to NPR 137.57 from NPR 119.52 crores the week prior. At the end of last week, the volume transaction stood at 189.94 crores, which is the highest in history. 7. Overview The Nepse index ended in the green for most of last week. It gained 48.58 points (or up 3.22%) to close at 1566.7. The index is still running above the 50-day and 200-day moving averages, indicating that the overall market condition looks good. The macd line could cross above the signal line, which would indicate a bullish outlook of the market. The RSI ended at 69.47 level, which show an increase in the buying pressure in the market. The Bollinger bands show constant market volatility as the distance between the upper and lower bands remain constant. The support and resistance level stands the same at 1463 and 1600 respectively.
- 5. k|fljlwsljZn]if0f !_ahf/ ;f/f+z -h]7@&, @)&#;Ddsf]_ aGb cªs -h]7 @&, @)&#_ !%^^=&) pRr cªs -uPsf] ;ftf_ !%^^=&) ;fKtflxs kl/jt{g $*=%* -#=@@k|ltzt_ b}lgscf};t Jofkf/ ¿=!#&=%&s/f]8 s'n ;fKtflxsJofkf/ ¿ ^*&=*& s/f]8 cf/P;cfO{ ^(=$& PdP;L8L @@=!& l;UgnnfO{g @@=@$ @_ ahf/ k|j[lt Nepse (Jan 1, 2015 – June 9, 2016)
- 6. #_ 6]«G8 ljZn]if0f uPsf] ;ftfg]K;] kl/;"rsdfcfO{tjf/sf] lbg #$=(* cªssf] lu/fj6 kZrftklg g]K;]df ;ftfsf] cGTo ;Dddf $*=%* cªssf] a[l4 b]lvof] . ;du|dfclxn] klg kl/;"rs %) lbg] d'leËPe/]h tyf @)) lbg] d'leËeGbfdfly g} rln/x]sf] cj:yf ;du|dfahf/sf] l:ylt /fd|f] b]lvG5 .xfnnufgLstf{x? dfem O{G:of]G; If]q tkm{ a9L cfsif{0f /x]sf] blvof] . $_ 6]jftyfk|lt/f]w cªs glhssf] 6]jfcªs !$^# 6]jfcªs @ !#() glhssf] k|lt/f]w cªs !^)) uPsf] ;ftf g]K;] kl/;"rsn]km]l/ cfkmgf] Oltxf;sf] pRrcªs !,%^^=&nfO{ 5f]Psf] cj:yf /xof] . ;ftfsf] z'?df s]xL s/]S;g b]lvPsf] kl/;"rsdfafFsLlbgx? km]l/ a'lnz l:ylt /xof] . t/ ;du| clxn] klgahf/sf] l:ylt /fd|} g} b]lvG5 . xfnsf] cj:yfdfglhssf] 6]jfcªstyfglhssf] k|lt/f]w cªss|dz M !$^# tyf !^)) /x]sf] 5 . %_ g]K;] 6]«G8 ;"rs s_ d'leª Pe/]hsGeh]{G; 8fOeh]{G; -PdP;L8L_ PdP;L8Ldf b'O{ cf]6f /]vf x'G5g, h;df Pp6fn] ahf/sf] lbzf kl/jt{gsf] ;+s]t u5{ eg] csf]{n] ahf/sf] k|j[lQ -6«]08_ b]vfpg] u5{ . olb PdP;L8L /]vfn] l;Ung /]vfnfO{ tnaf6 dfly sf6]dfo;nfO{ ;sf/fTds ;+s]tsf ?kdflnO{G5 / o;n] z]o/x? lsGg] ;+s]t ub{5 . uPsf] ;ftfsf] z'?df PdP;L8L nfO{gtyfl;UgnnfO{g s|dzM!(=&%tyf@%=@)sf] l:yltdf /x]sf] lyof]/ ;ftfsf] cGTodf PdP;L8L nfO{g tyfl;UgnnfO{g s|dzM @@=!&tyf @@=@$ /x]sf]] 5 . l;UgnnfO{g eGbftnrln/x]sf] PdP;L8L nfO{gn] ahf/sf] a'lnz 6]«G8df s]xLsdLcfPsf] ;+s]t ub{5 .
- 7. v_ l/n]l6j :6«]Gy OG8]S; -cf/P;cfO{_ cf/P;cfO{ k|fljlwsljZn]if0fsf] o:tf] cf}hf/ xf], h;nfO{ Pstlkm{ ?kdfrln/x]sf] ahf/dfJofkf/ /0fgLlt agfpg a9L pkof]uL dflgG5 . To;}u/L, o;n] ahf/dfvl/b / ljlqmsf] :ki6 ;+s]t b]vfpg] u5{ . cf/P;cfO{uPsf] ;ftfsf] z'?df$&=#&cªsdf/x]sf] lyof] . w]/} lbg kl5 &) sf] l:yltaf6 tnem/]sf] cf/P;cfO{n] ahf/df a]Rg] xf]8afhLsf] ;+s]t uof]{ t/ km]l/ ;ftfsf] afFsLlbgx?dflsGg] xf]8afhLn] ahf/nfO{ km]l/ ^(=$&cªssf] l:yltdf nUof] h;n] ahf/dfclxn] klglsGg] l:ylt w]/}| ePsf] ;+s]u ub{5 . u_ af]lnªu/ Aof08 af]lnªu/ Aof08 Ps k|fljlwsljZn]if0f ;"rsxf] h;df @!–lbg] d'leËPe/]hsf ;fyb'O{ Aof08 -Pp6f dfly_ / Pp6f tn_ x'G5g . lo Aof08x?n] cl:y/tfsf] ;+s]t ub{5g, h'g :6fG88{ 8]leP;g u0fgf u/]/ kQfnufO{G5 . g]K;] kl/;"rsuPsf] ;ftfsf] z'?dfdWo Jof08 eGbftn e/]sf] cj:Yffn] ahf/dflsGg] xf]8afhLdf sdLcfPsf] ;+s]t ub{5 . t/ ;ftfsf] afFsLlbgx?df g]K;] kl/;"rs km]l/ dflyNnf] Jof08 glhsk'Ug ;kmneof] h;n] ahf/ Ps lbgsf] s/]S;g kl5 km]l/ cf]e/ a6 l:yltd} /xof] . ;fy} pkNnf] tyftNnf] Jof08 aLrsf] b'/Ldfclxn] klgvf;} kl/jt{g gb]lvPsf]n] ahf/sf] cl:yt/tfeg] cem} s]xLxb ;Ddsfod /x]sf] b]lvG5 .
- 8. ;du{dfM uPsf] ;ftf g]K;] kl/;"rsdf$*=%*cªssf] a[l4 b]lvof]h;sf] kmn:j?kahf/ !%^^=&)cªsdfaGbeof] . clxn] klg kl/;"rs %) lbg] d'leËPe/]h tyf @)) lbg] d'leËeGbfdflyuO{/x]sf] cj:yfn] ahf/ ;sf/fTds l:yltdf g} /x]sf] ;+s]t ub{5 . PdP;L8L nfO{g l;UgnnfO{g eGbftncfPsf] cj:yfn] a'lnz 6]«G8df s]xLlu/fj6 cfPsf] ;+s]t ub{5 t/ clxn] sf] l:yltdf sfod /x]df ;f] l:yltdf rf8} kl/jt{g cfpg ;Sg] cj:yf b]lvG5 . &) cªssf] xf/fxf/Ldfcf/P;cfO{n]ahf/ cf]e/ a6 l:yltdf/x]sf] ;+s]t ub{5 . af]lnªu/ Aof08n] ahf/ clxn] klgcf]e/ a6sf] l:yltdf /x]sf] ;+s]t ub{5 . ;fy} pkNnf] tyftNnf] Jof08 aLrsf] b'/Ldfeg]vf;} kl/jt{g gfcfPsf] ahf/sf] cl:y/tfeg] cem} s]xLxb ;Ddsfod /x]sf] b]lvG5 .xfnsf] cj:yfdfgofF 6]jfcªstyfk|lt/f]w cªs s||dzM !$^# tyf !^)) g} sfod/x]sf] 5 .