Nepse Technical Analysis April 17 - April 21, 2016
•
0 likes•614 views

Nepse Weekly Technical Analysis April 17 - April 21, 2016

Recommended
Recommended
More Related Content
What's hot
What's hot (20)
Viewers also liked
Viewers also liked (20)
Similar to Nepse Technical Analysis April 17 - April 21, 2016
Similar to Nepse Technical Analysis April 17 - April 21, 2016 (12)
More from Kriti Capital & Investments Ltd.
More from Kriti Capital & Investments Ltd. (16)
Recently uploaded
Recently uploaded (20)
Nepse Technical Analysis April 17 - April 21, 2016
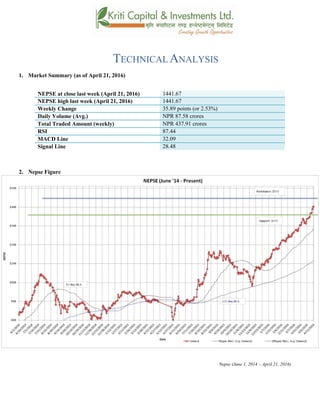
- 1. TECHNICAL ANALYSIS 1. Market Summary (as of April 21, 2016) NEPSE at close last week (April 21, 2016) 1441.67 NEPSE high last week (April 21, 2016) 1441.67 Weekly Change 35.89 points (or 2.53%) Daily Volume (Avg.) NPR 87.58 crores Total Traded Amount (weekly) NPR 437.91 crores RSI 87.44 MACD Line 32.09 Signal Line 28.48 2. Nepse Figure Nepse (June 1, 2014 – April 21, 2016)
- 2. 3. Trend Analysis The Nepse index continues to create history by reaching an all time height of 1441.67. The benchmark index gained 35.89 points (or up 2.53%) last week. The bullish sentiment continues to influence the market. The refund of NIB FPO should have injected more funds into the secondary market, creating demand for scripts. Furthermore, third quarter reports of the BFIs should also support the bullish momentum in the market. The 50 days moving average is still running above 200 days moving average, indicating that the long term Nepse trend looks positive. 4. Resistance and Support Immediate Support 1390 Support 2 1350 Immediate Resistance 1500 Resistance 2 The current immediate support and resistance level stands the same at 1390 and 1500 respectively. As the bullish sentiment is still present in the market, Nepse could come close to its immediate resistance level, if not cross above it. However, the index could see some corrections in coming weeks. 5. Trend Indicator a.) MACD The MACD is a momentum oscillator formed by using two different types of moving averages, which provides specific buying or selling signals. When a MACD line crosses above the signal line, it is considered to be a positive sign and indicates a time to buy, and vice-versa. The Macd line finally climbed upwards last week. The Macd and the signal line stood at 26.41 and 25.32 respectively at the beginning of last week. Towards the end of the week, both macd and the signal line climbed 5.68 and 3.15 points to close at 32.09 and 28.48 respectively. The macd indicator climbing upward and above the signal line supports the bullish presence in the market.
- 3. b.) RSI RSI is a form of leading indicator that is believed to be most effective during periods of sideways movement. Such indicators may create numerous buy and sell signals that are useful when the market is not clearly trending upwards or downwards. The RSI at the beginning of the week stood at 82.58 points. In the course of the week, it gained 4.87 points to close at 87.44 level. The RSI indicator continues to show high buying pressure in the market. However, it has remained above the 70’s zone for a long time period, indicating a strong bullish presence in the market. c.) Bollinger Bands The Bollinger Band is a technical indicator that consists of a moving average (21-day) along with two trading bands above (upper band) and below it (lower band). The bands are an indication of volatility, which are represented by calculating standard deviation. The benchmark index is touching the upper Bollinger band, indicating over-bought condition. However, all of the bands continue to move up, showing a bullish run. The distance between upper and lower band seems to have diverged a little, signifying slight increase in market volatility.
- 4. 6. Volume Indicator (On-Balance Volume) On-Balance Volume (OBV) is a momentum indicator that relates volume to the current price of the index or security. It measures buying and selling pressure at the market. It acts as a cumulative indicator that adds volume on up days and subtracts volume on down days. If a price increase is supported by OBV, it confirms an uptrend, whereas if a price decrease is supported by OBV, it confirms a downtrend. The On-Balance Volume (OBV) continues to climb up at a faster rate as compared to the climb witnessed by Nepse index. This increase in the OBV supports the bullish momentum in the market. The average weekly volume transactions increased to NPR 87.58 crores from NPR 57.20 crores the week prior. On Thursday of last week, the total volume transaction stood at a staggering 107.92 crores. 7. Overview The Nepse index ended in the green throughout last week as well. It gained 35.89 points (or up 2.53%) to close at 1441.67, creating a new height. The 50-day and 200-day moving average continue to climb up along with the benchmark index, indicating that the overall market condition looks good. The macd is climbing up and above the signal line, which supports the optimism present in the market. The RSI ended at 87.44 level, indicating high buying pressure in the market. The Bollinger bands show buying pressure in the market as the index is touching the upper band. The bands also indicate minor increase in the market volatility. The support and resistance level stands the same at 1390 and 1500 respectively.
- 5. k|fljlwsljZn]if0f !_ahf/ ;f/f+z -a}zfv (, @)&#;Ddsf]_ aGb cªs -a}zfv (, @)&#_ !$$!=^& pRr cªs -uPsf] ;ftf_ !$$!=^& ;fKtflxs kl/jt{g #%=*( -@=%#k|ltzt_ b}lgscf};t Jofkf/ ¿=*&=%*s/f]8 s'n ;fKtflxsJofkf/ ¿ $#&=(! s/f]8 cf/P;cfO{ *&=$$ PdP;L8L #@=)( l;UgnnfO{g @*=$* @_ ahf/ k|j[lt Nepse (June 1, 2014 – April 21st, 2016)
- 6. #_ 6]«G8 ljZn]if0f uPsf] ;ftf g]K;] kl/;"rsn] km]l/cfkmgf] Oltxf; s} pRr cªsaf6 ug{ k'Uof] . #%=*(cªssf] a[[l4 ;Fu} g]K;] !$$!=^&cªsdfaGbeof] . clxn] klg g]K;] kl/;"rs a9g] s|dhf/L g} /x]sf] cj:yf 5 . g]kfn O{Ge]i6d]G6 a}+ssf} PkmkLcf] sf] /sdlkmtf{ x'gfn] klg ;f] /sd km]l/ bf];|f] ahf/dfcfpgyfn]sf] cj:yf b]lvG5 . ;fy} sDkgLx?sf] t];|f] q}dfl;ssf] ljQLoljj/0f k|sfzgx'gfn] klgo;n] ahf/df km]l/ s]xL p5fn NofPsf] b]lvG5 . ;du|dfclxn] klg kl/;"rs %) lbg] d'leËPe/]h tyf @)) lbg] d'leËeGbfdfly g} rln/x]sf] cj:yf ;du|dfahf/sf] l:ylt /fd|f] b]lvG5 . $_ 6]jftyfk|lt/f]w cªs glhssf] 6]jfcªs !#() 6]jfcªs @ !#%) glhssf] k|lt/f]w cªs !%)) uPsf] ;ftfg]K;] kl/;"rsn] cfkmgf] glhssf] k|lt/f]w cªs !#() ;d]t kf/ u/]sf] cj:yf /xof] . h;sf] kmn:j?kahf/dfclxn] klga'lnz 6]«G8 alnof] ?kdfsfod /x]sf] ;+s]t ub{5 . clxn] klgglhssf] 6]jfcªs !#() tyfglhssf] k|lt/f]w cªs !%)) /x]sf] cj:yf 5 . g]K;] kl/;"rs a9g] s|ddf /x]sf] x'Fbfahf/n] cfkmgf] glhssf] k|lt/f]w cªs ;d]t kf/ ug{ ;Sg] cj:yfalnof] b]lvG5 . t/ cacfpg] ;ftfeg] kl/;"rsdfeg] s]xL s/]S;geg] b]lvg ;lsG5 . %_ g]K;] 6]«G8 ;"rs s_ d'leª Pe/]hsGeh]{G; 8fOeh]{G; -PdP;L8L_ PdP;L8Ldf b'O{ cf]6f /]vf x'G5g, h;df Pp6fn] ahf/sf] lbzf kl/jt{gsf] ;+s]t u5{ eg] csf]{n] ahf/sf] k|j[lQ -6«]08_ b]vfpg] u5{ . olb PdP;L8L /]vfn] l;Ung /]vfnfO{ tnaf6 dfly sf6]dfo;nfO{ ;sf/fTds ;+s]tsf ?kdflnO{G5 / o;n] z]o/x? lsGg] ;+s]t ub{5 . uPsf] ;ftfsf] z'?df PdP;L8L nfO{gtyfl;UgnnfO{g s|dzM @^=$!tyf @%=#@sf] l:yltdf /x]sf] lyof] / PdP;L8L nfO{g w]/} lbg kl5 km]l/ dflylt/ nDs]sf] cj:yf /xof] h;n] ahf/ km]l/ a'lnz 6]«G8 lt/ nDs]sf] ;+s]t ub{5 . ;ftfsf] cGTodfPdP;L8L nfO{g tyfl;Ugns|dz M #@=)( tyf @*=$* /x]sf] 5 .
- 7. v_ l/n]l6j :6«]Gy OG8]S; -cf/P;cfO{_ cf/P;cfO{ k|fljlwsljZn]if0fsf] o:tf] cf}hf/ xf], h;nfO{ Pstlkm{ ?kdfrln/x]sf] ahf/dfJofkf/ /0fgLlt agfpg a9L pkof]uL dflgG5 . To;}u/L, o;n] ahf/dfvl/b / ljlqmsf] :ki6 ;+s]t b]vfpg] u5{ . cf/P;cfO{uPsf] ;ftfsf] z'?df*@=%*cªsdf/x]sf] lyof] . t/ km]l/ ;ftfsf] afFsLlbgx?dfcf/P;cfO{df$=*&cªs a[l4 ;Fu} cf/P;cfO{ *&=$$cªsdfaGbeof] . w]/} nfdf] ;do b]lv &) cªseGbfdfly /x]sf] cf/P;cfO{n] ahf/dfalnof] a'lnz 6]«G8sf] ;+s]t ub{5 . u_ af]lnªu/ Aof08 af]lnªu/ Aof08 Ps k|fljlwsljZn]if0f ;"rsxf] h;df @!–lbg] d'leËPe/]hsf ;fyb'O{ Aof08 -Pp6f dfly_ / Pp6f tn_ x'G5g . lo Aof08x?n] cl:y/tfsf] ;+s]t ub{5g, h'g :6fG88{ 8]leP;g u0fgf u/]/ kQfnufO{G5 . uPsf] ;ftfklgg]K;] kl/;"rskm]l/ pkNnf] Aof08sf] glhsk'u]sf] cj:yf /xof] h;n] km]l/ ahf/dflsGg] xf]8afhL /x]sf] ;+s]t ub{5 . clxn] klgdWo Aof0f8n] ahf/sf] nfluglhssf] 6]jfcªssf] ?kdfsfdul//x]sf] 5 . pkNnf] tyftNnf] Jof08 aLrsf] b'/L clxn] s]xL a9]sf]n]ahf/sf]cl:y/tfdfs]xL a[l4 ePsf] ;+s]t ub{5 .
- 8. ;du{dfM uPsf] ;ftf g]K;] kl/;"rsdf km]l/#%=*(cªssf]] a[l4 b]lvof]h;sf] kmn:j?k kl/;"rsOltxf;pRrlaGb' !$$!=^&cªsdfaGbeof] . clxn] klg kl/;"rs %) lbg] d'leËPe/]h tyf @)) lbg] d'leËeGbfdflyuO{/x]sf] cj:yfn] ahf/ ;sf/fTds l:yltdf g} /x]sf] ;+s]t ub{5 .PdP;L8L nfO{g w]/} lbg kl5 km]l/ dflylt/ nDs]sf] cj:yf /xof] h;n] ahf/ km]l/ a'lnz 6]«G8 lt/ nDs]sf] ;+s]t ub{5 . &) cªseGbfdfly /x]sf] cf/P;cfO{ clxn] km]l/ahf/ lgs} g} cf]e/ a6 l:yltdf /x]sf] ;+s]t ub{5 . af]lnªu/ Aof08n] ;d]t ahf/sf] lsGg] xf]8afhL s]xL a9]sf] ;+s]t ub{5 / b'O{ nfO{g aLr a9g uPsf] b'/Ln] ahf/sf] cl:y/tf s]xL a9]sf] ;+s]t ub{5 . xfnsf] cj:yfdfgofF 6]jfcªstyfk|lt/f]w cªs s||dzM !#() tyf !%)) g} /x]sf] 5 .