Nepse technical analysis december 4 december 8, 2016
•
0 likes•218 views

NEPSE Technical Analysis (December 4 - December 8, 2016)

Recommended
Recommended
More Related Content
What's hot
What's hot (20)
Viewers also liked
Viewers also liked (7)
Similar to Nepse technical analysis december 4 december 8, 2016
Similar to Nepse technical analysis december 4 december 8, 2016 (16)
More from Kriti Capital & Investments Ltd.
More from Kriti Capital & Investments Ltd. (7)
Recently uploaded
Recently uploaded (20)
Nepse technical analysis december 4 december 8, 2016
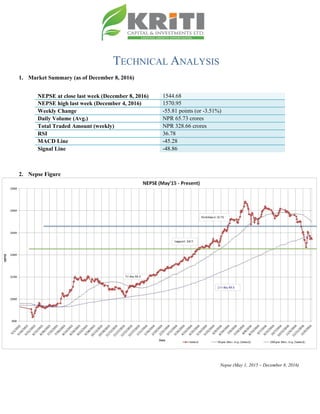
- 1. TECHNICAL ANALYSIS 1. Market Summary (as of December 8, 2016) NEPSE at close last week (December 8, 2016) 1544.68 NEPSE high last week (December 4, 2016) 1570.95 Weekly Change -55.81 points (or -3.51%) Daily Volume (Avg.) NPR 65.73 crores Total Traded Amount (weekly) NPR 328.66 crores RSI 36.78 MACD Line -45.28 Signal Line -48.86 2. Nepse Figure Nepse (May 1, 2015 – December 8, 2016)
- 2. 3. Trend Analysis The Nepse index took a downfall by 55.81 points (or down 3.51%) to close at 1544.68 last week. The index gained 9.91 points on Tuesday. However, it ended in the red for the rest of last week. Investors still seem to be nervous about the market as it continues to be volatile. The index remains below the 200 day moving average, signifying presence of bearish sentiment. The average volume turnover decreased significantly to NPR 65.73 from NPR 116.48 the week prior. 4. Resistance and Support Immediate Support 1465 Support 2 1405 Immediate Resistance 1671 Resistance 2 1722 The Nepse index continues to hover between the current support and resistance level of 1465 and 1671 respectively. The index could further hover in the same direction in days to come as the market continues to give no clear indication. 5. Trend Indicator a.) MACD The MACD is a momentum oscillator formed by using two different types of moving averages, which provides specific buying or selling signals. When a MACD line crosses above the signal line, it is considered to be a positive sign and indicates a time to buy, and vice-versa. The Macd and the signal line, at the beginning of last week, stood at -50.10 and -51.52 respectively. In the course of the week, both macd and signal line increased by 4.82 and 2.66 points to close at -45.28 and - 48.86 respectively. The macd line has crossed above the signal line, which indicates a bullish trigger. However, both the lines continue to remain in the negative territory. b.) RSI RSI is a form of leading indicator that is believed to be most effective during periods of sideways movement. Such indicators may create numerous buy and sell signals that are useful when the market is not clearly trending upwards or downwards.
- 3. The RSI, at the beginning of last week, stood at 39.92 points, which shows that the market was moving away from selling pressure. In the course of the week, it lost 2.34 points to end at 36.78 level. The RSI currently gives a neutral stance. c.) Bollinger Bands The Bollinger Band is a technical indicator that consists of a moving average (21-day) along with two trading bands above (upper band) and below it (lower band). The bands are an indication of volatility, which are represented by calculating standard deviation. The benchmark index continues to hover between the middle and lower bollinger bands, which could possibly show some presence of selling pressure in the market. The market remains highly volatile as the distance between the upper and lower bands remain wide.
- 4. 6. Overview The Nepse index lost 55.81 points (or down 3.51%) to close at 1544.68 last week. The index could move sideways in days to come as nervousness and uncertainty looms over the market. The macd indicator has crossed above the signal line, indicating a possible bullish trigger. However, both the lines continue to remain in the negative territory. The RSI gives a neutral stance, closing at 36.78 level. The bollinger bands continue to show presence of high market volatility. The support and resistance level stands the same at 1465 and 1671 respectively.
- 5. k|fljlwsljZn]if0f !_ahf/ ;f/f+z -d+l;/@#, @)&#;Ddsf]_ aGb cªs -d+l;/@#, @)&#_ !%$$=^* pRr cªs -uPsf] ;ftf_ !%&)=(% ;fKtflxs kl/jt{g –%%=*! -–#=%!k|ltzt_ b}lgscf};t Jofkf/ ¿=^%=&#s/f]8 s'n ;fKtflxsJofkf/ ¿ #@*=^^ s/f]8 cf/P;cfO{ #^=&* PdP;L8L –$%=@* l;UgnnfO{g –$*=*^ @_ ahf/ k|j[lt Nepse (May 1, 2015 – December 8, 2016)
- 6. #_ 6]«G8 ljZn]if0f uPsf] ;ftfg]K;] kl/;"rsdf%%=*!cªssf] lu/fj6 b]lvof]h;sf] kmn:j?kahf/ !%$$=^*cªsdfaGbeof] .g]K;] kl/;"rsclxn@))lbg] d'leËPe/]heGbftn /x]sf] cj:yf 5 h;n] ahf/dflaol/; 6]«G8df /x]sf] l:ylt b]vfpF5 . uPsf] s]xLlbgsf] ahf/ cl:y/tftyf /fhgLltstxdf ;Dd b]lvPsf] g}/Zotfn] ahf/df s]xLxnrnsf] cj:yfeg] kSs} /x]sf] b]lvG5 . cf};tsf/f]af/ /sddfef/L lu/fj6 b]lvof] hf]^%=&# s/f]8df cfPsf] 5 . $_ 6]jftyfk|lt/f]w cªs glhssf] 6]jfcªs !$^% 6]jfcªs @ !$)% glhssf] k|lt/f]w cªs !^&! xfnsf] nflu 6]jfcªs !$^%tyfk|lt/f]w cªs !^&! /x]sf] 5 . g]K;] kl/;"rsxfn@))lbg] d'leËPe/]h eGbftncfPsf] cj:yfn] ahf/dflaol/;6]«G8sfod /x]sf] blvG5 .xfnsf] ahf/kv{ / x]/ sf] cj:yfdf b]lvPsf] x'Fbfclxn] ahf/df ;fO8j]h d'ed]G6 b]lvPsf] 5 . %_ g]K;] 6]«G8 ;"rs s_ d'leª Pe/]hsGeh]{G; 8fOeh]{G; -PdP;L8L_ PdP;L8Ldf b'O{ cf]6f /]vf x'G5g, h;df Pp6fn] ahf/sf] lbzf kl/jt{gsf] ;+s]t u5{ eg] csf]{n] ahf/sf] k|j[lQ -6«]08_ b]vfpg] u5{ . olb PdP;L8L /]vfn] l;Ung /]vfnfO{ tnaf6 dfly sf6]dfo;nfO{ ;sf/fTds ;+s]tsf ?kdflnO{G5 / o;n] z]o/x? lsGg] ;+s]t ub{5 . ;ftfsf] z'?df PdP;L8L nfO{g tyfl;UgnnfO{g s|dzM–%)=!)tyf–%!=%@sf] l:yltdf /x]sf] lyof] . PdP;L8L nfO{gtyfl;UgnnfO{gdfafFsLsflbgx?dfxnsfa[l4 g} b]lvof] .xfnsf] nflu PdP;L8LnfO{g tyfl;UgnnfO{g s|dz M –$%=@*tyf$*=*^/x]sf] 5 t/ clxn] klg PdP;L8L nfO{gtyfl;UgnnfO{g b'j}C0ffTds If]qdf /x]sf] xF'bfahf/ laol/; l:yltdf g} /x]sf] b]lvG5.
- 7. v_ l/n]l6j :6«]Gy OG8]S; -cf/P;cfO{_ cf/P;cfO{ k|fljlwsljZn]if0fsf] o:tf] cf}hf/ xf], h;nfO{ Pstlkm{ ?kdfrln/x]sf] ahf/dfJofkf/ /0fgLlt agfpg a9L pkof]uL dflgG5 . To;}u/L, o;n] ahf/dfvl/b / ljlqmsf] :ki6 ;+s]t b]vfpg] u5{ . cf/P;cfO{uPsf] ;ftfsf] z'?df#(=(@cªsdf/x]sf] lyof]tyf ;ftfsf] cGTolt/ cf/P;cfO{ #^=&*cªsdf /xof].#) cªseGbftnem/]sf] cf/P;cfO{n] cf]e/;f]N8 ahf/sf] l:Ylt b]lvGYof] .xfncf/P;cfO{n] ahf/ Go'6«n l:yltdf /x]sf] b]vfpF5 .
- 8. u_ af]lnªu/ Aof08 af]lnªu/ Aof08 Ps k|fljlwsljZn]if0f ;"rsxf] h;df @!–lbg] d'leËPe/]hsf ;fyb'O{ Aof08 -Pp6f dfly_ / Pp6f tn_ x'G5g . lo Aof08x?n] cl:y/tfsf] ;+s]t ub{5g, h'g :6fG88{ 8]leP;g u0fgf u/]/ kQfnufO{G5 . g]K;] kl/;"rsuPsf] ;ftftNnf] Jof08 tyfdWo Jof08aLrrln/x]sf] cj:yf /xof] h;n] clxn] klgahf/dfa]Rg]xf]8afhL g} /x]sf] h:tf] b]lvG5 f t/ pkNnf] tyftNnf] Jof08 aLrdf b'/L sfod /x]sf]n] cl:yt/tfcem} /x]sf] b]lvG5 . ;du{dfM uPsf] ;ftf g]K;] kl/;"rsdf%%=*!cªssf] lu/fj6 g} b]lvof]h;sf] kmn:j?kahf/ !%$$=^*cªsdfaGbeof] . PdP;L8L nfO{gdf b]lvPsf] a[l4n]eg]a]Rg]xf]8afhLdf s]xLsdLePsf]b]lvG5 . #)cªseGbfdflycfPsf] cf/P;cfO{n] ahf/ cf]e/–;f]N8 l:yltaf6 aflx/cfO{ Go"6«n cj:yfdfcfPsf];+s]t ub{5 .pkNnf] tyftNnf] Jof08 aLrsf] b'/Ldfeg]] s]xL kl/jt{g gcfPsf]n] ahf/sf] cl:y/tfdfeg]sdLgcfPsf] ;+s]t ub{5 .xfnsf] cj:yfdfgofF 6]jfcªstyfk|lt/f]w cªs s||dzM !$^%tyf !^&!sfod /x]sf] 5 .