Nepse Technical Analysis 12 April - 16 April, 2015
•
0 likes•246 views

Nepse Weekly Technical Analysis 12 April - 16 April, 2015

Recommended
Recommended
More Related Content
What's hot
What's hot (17)
Viewers also liked
Viewers also liked (11)
Similar to Nepse Technical Analysis 12 April - 16 April, 2015
Similar to Nepse Technical Analysis 12 April - 16 April, 2015 (20)
More from Kriti Capital & Investments Ltd.
More from Kriti Capital & Investments Ltd. (15)
Recently uploaded
Recently uploaded (20)
Nepse Technical Analysis 12 April - 16 April, 2015
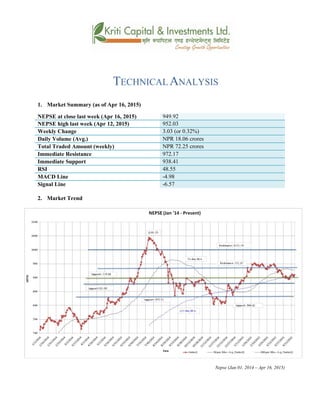
- 1. TECHNICAL ANALYSIS 1. Market Summary (as of Apr 16, 2015) NEPSE at close last week (Apr 16, 2015) 949.92 NEPSE high last week (Apr 12, 2015) 952.03 Weekly Change 3.03 (or 0.32%) Daily Volume (Avg.) NPR 18.06 crores Total Traded Amount (weekly) NPR 72.25 crores Immediate Resistance 972.17 Immediate Support 938.41 RSI 48.55 MACD Line -4.98 Signal Line -6.57 2. Market Trend Nepse (Jan 01, 2014 – Apr 16, 2015)
- 2. 3. RSI RSI is a form of leading indicator that is believed to be most effective during periods of sideways movement. Such indicators may create numerous buy and sell signals that are useful when the market is not clearly trending upwards or downwards. RSI was at 49.46 levels during the beginning of the week. It fell down throughout the week until the last day of trading, where it spiked back up to 48.55 levels. It seems that RSI will keep hovering around the neutral zone in the coming weeks, if not increasing. RSI (Jan 01, 2014 – Apr16, 2015) 4. MACD The MACD is a momentum oscillator formed by using two different types of moving averages, which provides specific buying or selling signals. When a MACD line crosses above the signal line, it is considered to be a positive sign and indicates a time to buy, and vice-versa. The MACD Line crossed-over the Signal Line during the beginning of last week, indicating a strong buy signal. The MACD, as well as the Signal line, appears to be gradually moving away from the negative territory. MACD at the end of last week stands at -4.98 and Signal Line at -6.57. MACD (Jan 01, 2014 – Apr 16, 2015) 5. Bollinger Bands The Bollinger Band is a technical indicator that consists of a moving average (21-day) along with two trading bands above (upper band) and below it (lower band). The bands are an indication of volatility, which are represented by calculating standard deviation. The NEPSE index made a small progress last week and is lingering with the mid-band, maintaining a neutral stance. The upper and lower band still appears to be converging gradually, signifying decline in market volatility.
- 3. Bollinger Bands (Jan 01, 2014 – Apr 16, 2015) Overview: NEPSE ended in the green at the last day of trading last week as it closed higher by 5.79 points (or 0.61%) to end at 949.92. Although Nepse did not make much improvement throughout the week, it closed a little higher than the week’s average of 948.61. The 50-day moving average is still increasing at a higher rate above the 200-day moving average suggesting that the overall outlook of the market remains positive. The average daily market volume increased last week to NPR 18.06 crores from NPR 16.06 crores the week prior. Currently standing at 48.55, the RSI is strongly holding at the neutral zone, and is likely to stay there in the coming weeks. The MACD Line has crossed-over the Signal Line, indicating a possible bullish period. Furthermore, Nepse is moving along with the mid- Bollinger band, pointing towards a neutral stance. Its current support and resistance level still stands the same at 938.41 and 972.17 points respectively. If Nepse makes a fall again, its next closest support level stands at 919.88.
- 4. k|fljlwsljZn]if0f ahf/ ;f/f+z -a}zfv#, @)&@ ;Ddsf]_ aGb cªs -a}zfv#, @)&@_ ($(=(@ pRr cªs -uPsf] ;ftf_ (%@=)# ;fKtflxs kl/jt{g #=)# -)=#@k|ltzt_ b}lgscf};t Jofkf/ ¿=!*=)^s/f]8 s'n ;fKtflxsJofkf/ ¿=&@=@% s/f]8 tTsflng 6]jf (&@=!& tTsflngk|lt/f]w (#*=$! cf/P;cfO{ $*=%% PdP;L8L –$=(* l;UgnnfO{g –^=%& बजारप्रवृित्त Nepse (Jan 01, 2014 – Apr 16, 2015)
- 5. l/n]l6j :6«]Gy OG8]S; -cf/P;cfO{_ cf/P;cfO{ k|fljlwsljZn]if0fsf] o:tf] cf}hf/ xf], h;nfO{ Pstlkm{ ?kdfrln/x]sf] ahf/dfJofkf/ /0fgLlt agfpg a9L pkof]uL dflgG5 . To;}u/L, o;n] ahf/dfvl/b / ljlqmsf] :ki6 ;+s]t b]vfpg] u5{ . ;ftfsf] z'?df $(=$^ cªsdf /x]sf]cf/P;cfO{ To; kl5 tnemg]{ s|dhf/L g} /xof] t/ ;ftfsf] cGTolt/ cf/P;cfO{ km]l/ dfly r9L $*=%%sf] l:yltdf /xguof] . cfpg] ;ftfklgcf/P;cfO{ Go"6«n cj:yfdf g} /xg] ;+Defjgfalnof] 5 . RSI (Jan 01, 2014 – Apr16, 2015) d'leª Pe/]hsGeh]{G; 8fOeh]{G; -PdP;L8L_ PdP;L8Ldf b'O{ cf]6f /]vf x'G5g, h;df Pp6fn] ahf/sf] lbzf kl/jt{gsf] ;+s]t u5{ eg] csf]{n] ahf/sf] k|j[lQ -6«]08_ b]vfpg] u5{ . olb PdP;L8L /]vfn] l;Ung /]vfnfO{ tnaf6 dfly sf6]dfo;nfO{ ;sf/fTds ;+s]tsf ?kdflnO{G5 / o;n] z]o/x? lsGg] ;+s]t ub{5 . PdP;L8LnfO{g] l;UngnfO{gnfO{ sf6]sf] cj:yfn] ahf/dflsGg] xf]8afhL a9]sf] ;+s]t ub{5 . PdP;L8Ltyfl;UngnfO{g lj:tf/} C0ffTds If]qaf6 dflynfUb} cfPsf] cj:yfn] ahf/df ;'wf/sf] ;+s]t ub{5 . PdP;L8LnfO{g ;ftfsf] cGTolt/ –$=(* dftyfl;UgnnfO{g –^=%&df /xguof] .
- 6. MACD (Jan 01, 2014 – Apr 16, 2015) af]lnªu/ Aof08 af]lnªu/ Aof08 Ps k|fljlwsljZn]if0f ;"rsxf] h;df @!–lbg] d'leËPe/]hsf ;fyb'O{ Aof08 -Pp6f dfly_ / Pp6f tn_ x'G5g . lo Aof08x?n] cl:y/tfsf] ;+s]t ub{5g, h'g :6fG88{ 8]leP;g u0fgf u/]/ kQfnufO{G5 . of] uPsf] ;ftf g]K;] kl/;"rsdfs]xL;'wf/ b]lvof] 5 / g]K;] kl/;"rsdWo Aof08 ;+u ;+u} rln/x]sf] cj:yfn] ahf/ Go6«n l:yltdf g} /x]sf] ;+s]t ub{5 . dflyNnf] tyftNnf] Aof08 cem} glhscfpgnfu]sf] cj:yfn] ahf/sf] cl:y/tfdfkm]l/ klgsdLcfPsf] ;+s]t ub{5 . Bollinger Bands (Jan 01, 2014 – Apr 16, 2015)
- 7. ;du{dfM of] uPsf] ;ftf g]K;] kl/;"rsdf ;'wf/ b]lvof] h;sf] kmn:j?kahf/ ;ftfsf] clGtdsf/f]af/ lbg%=&( cªsn] -)=^!Ü_ a9L ($(=(@ cªsdf ;dfKteof] / g]K;] kl/;"rsdf ;ftf el/ vf;} ;'wf/ gb]lvotfklgclGtdsf/f]af/ lbg kl/;"rs;ftfsf] cf};t ($*=^!eGbfs]xLdfly g} /xguof] . cf};t sf/f]af/ /sddf ;d]t cl3Nnf] ;ftfeGbf j[l4 eO{ ?= !*=)^ sf] sf/f]af/ eof] . %)–lbg] d'leËPe/]hn] @))–lbg] d'leËPe/]hnfO{ sf6L dfly /x]sf] cj:yf / ;f]dfcfPsf] ultn] ahf/dfcem} ;sf/fTds ;+s]tx? g} oyfjt /x]sf 5g .$*=%% df /x]sf] cf/P;cfO[n] ahf/ clxn] klgGo"6«n cj:yfdf g} /x]sf] ;+s]t ub{5 / cfpg] ;ftfklg ;f]xLcj:yfdf /xg ;Sg] alnof] ;+s]t k|bfgub{5 . PdP;L8L nfO{gn] l;UgnnfO{gnfO{ s|;u/]sf] cj:yfn] ahf/dfa'ln; 6]«G8 cfpg ;Sg] ;+Defjgk|bfgub{5 . g]K;] kl/;"rstyfdWoaf]lnªu/ Aof08 ;+u ;+u} rln/x]sf] cj:Yffn] ahf/ Go"6«n cj:yfdf g} /lx/x]sf] ;+s]t ub{5 . g]K;] kl/;"rsdfuPsf] ;ftfklg 6]jfcªs (#*=$!cªs /xguPsf] 5 / k|lt/f]w cªs klg(&@=!& g} /x]sf] 5 . t/ g]K;] kl/;"rs 36g] s|dyfn]dfglhsf] 6]jf cªs (!(=** /xg] 5 .