Nepse technical analysis july 27 july 31, 2014 (eng & nep)
•
0 likes•234 views

Technical analysis of Nepal Stock Exchange (Nepse) index for the week from July 27, 2014 to July 31, 2014. The technical analysis includes summary, RSI, MACD and Bollinger band analysis. The analysis is done by Kriti Capital & Investments Ltd.

Recommended
Recommended
More Related Content
What's hot
What's hot (20)
Viewers also liked
Viewers also liked (9)
Similar to Nepse technical analysis july 27 july 31, 2014 (eng & nep)
Similar to Nepse technical analysis july 27 july 31, 2014 (eng & nep) (16)
More from Kriti Capital & Investments Ltd.
More from Kriti Capital & Investments Ltd. (20)
Recently uploaded
Recently uploaded (20)
Nepse technical analysis july 27 july 31, 2014 (eng & nep)
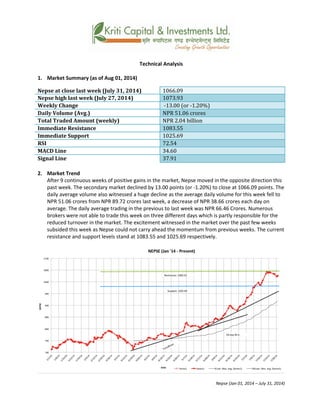
- 1. Technical Analysis 1. Market Summary (as of Aug 01, 2014) Nepse at close last week (July 31, 2014) 1066.09 Nepse high last week (July 27, 2014) 1073.93 Weekly Change -13.00 (or -1.20%) Daily Volume (Avg.) NPR 51.06 crores Total Traded Amount (weekly) NPR 2.04 billion Immediate Resistance 1083.55 Immediate Support 1025.69 RSI 72.54 MACD Line 34.60 Signal Line 37.91 2. Market Trend After 9 continuous weeks of positive gains in the market, Nepse moved in the opposite direction this past week. The secondary market declined by 13.00 points (or -1.20%) to close at 1066.09 points. The daily average volume also witnessed a huge decline as the average daily volume for this week fell to NPR 51.06 crores from NPR 89.72 crores last week, a decrease of NPR 38.66 crores each day on average. The daily average trading in the previous to last week was NPR 66.46 Crores. Numerous brokers were not able to trade this week on three different days which is partly responsible for the reduced turnover in the market. The excitement witnessed in the market over the past few weeks subsided this week as Nepse could not carry ahead the momentum from previous weeks. The current resistance and support levels stand at 1083.55 and 1025.69 respectively. Nepse (Jan 01, 2014 – July 31, 2014)
- 2. 3. RSI RSI is a form of leading indicator that is believed to be most effective during periods of sideways movement. Such indicators may create numerous buy and sell signals that are useful when the market is not clearly trending upwards or downwards. Following the market trend, the RSI indicator also witnessed a big decline as it closed at 72.54 levels by the end of trading week, which is 11.12 points lower when compared to the previous week. However, the RSI has been able to maintain just above the overbought levels. RSI (Jan 01, 2013 – July 31, 2014) 4. MACD The MACD is a momentum oscillator formed by using two different types of moving averages, which provides specific buying or selling signals. When a MACD line crosses above the signal line, it is considered to be a positive sign and indicates a time to buy, and vice-versa. On Monday, the MACD line crossed below the signal line triggering a sell signal in the market. This indicates that the near term moving average (MACD line) has been on a declining trend when compared to the longer term moving average (Signal line). At present, the MACD and Signal lines are maintaining at 34.60 and 37.91 points respectively. MACD (Jan 01, 2013 – July 31, 2014) 5. Bollinger Bands The Bollinger Band is a technical indicator that consists of a moving average (21-day) along with two trading bands above (upper band) and below it (lower band). The bands are an indication of volatility, which are represented by calculating standard deviation. Since the Nepse line moved away from the upper band last week, it has continued on a lower trend. As a result, Nepse is inching closer towards the mid-band suggesting that the market is gradually moving towards neutral levels from the overbought zone.
- 3. Bollinger Bands (Nov 04, 2013 – July 31, 2014) Overview: After reaching multiple new highs during the last several weeks, Nepse consolidated during the past trading week. With momentum on the lower side, Nepse declined by 13.00 points (or 1.20%) and closed at 1066.09 points. The average daily turnover remained at NPR 51.06 crores this week, which is a significant drop from NPR 89.72 crores from the previous week. The next resistance and support levels stand at 1083.55 and 1025.69 respectively. The RSI declined by 11.12 points to maintain at 72.54 levels, however, it is still maintaining slightly above the overbought line. The MACD line crossed below the Signal line this week suggesting a sell signal in the market. The Bollinger Bands indicate that the market is gradually moving away from the overbought zone as it moves closer to the mid- band. Most indicators represent an overbought market in recent times; however, we may see low volatility and sideways movement in the near future considering Shrawan as the month of fourth quarter financial reporting by listed companies.
- 4. k|fljlws ljZn]if0f ahf/ ;f/f+z ->fj0f !! b]vL >fj0f !% ;Ddsf]_ aGb cªs ->fj0f !%_ M !)^^=)( pRr cªs ->fj0f !!_ M !)&#=(# ;fKtflxs kl/jt{g M –!#=)) cªs -–!=@) k|ltzt_ b}lgs cf};t Jofkf/ M ¿= %!=)^ s/f]8 s'n ;fKtflxs Jofkf/ M ¿= @ ca{ $ s/f]8 tTsflng 6]jf M !)*#=%% tTsflng k|lt/f]w M !)@%=^( cf/P;cfO{ M &@=%$ PdP;L8L M #$=^) l;Ugn nfO{g M #&=(! %) tyf @)) lbg] d'leª Pe/]h ljut ( xKtf b]lv nuftf/ ;sf/fTds /x]sf] g]K;], o; xKtf eg] ljkl/t lbzf tk{m kms]{sf] 5 . g]K;] xKtfsf] cGTo ;Dddf !# cªs -jf !=@) k|ltzt_ n] 36]/ !)^^=)( cªsdf k'u]sf] 5 . ut xKtf *(=&@ s/f]8 ?k}Fof /x]sf] b}lgs cf}ift Jofkf/ -ef]No"d_ 36]/ o; xKtf %!=)^ s/f]8 ?k}Fof k'u]sf] 5 h;n] ubf{ b}lgs cf}ift Jofkf/ -ef]No"d_ df 7"nf] lu/fj6 b]lvPsf] 5 . cl3Nnf] xKtf b}lgs cf}ift Jofkf/ -ef]No"d_ ^^=$^ s/f]8 ?k}Fof /x]sf] lyof] . o; xKtf y'k|} a|f]s/x?n] tLg cnu cnu lbg sf/f]af/ ug{ gkfPsf] x'Fbf Jofkf/ -ef]No"d_df cf+lzs k|efj k/]sf] xf] . ljut xKtf b]lv ahf/df b]lvPsf] ;sf/fTds efjdf, g]K;]df a9g] k|j[lt sfod gePsf sf/0f, o; ;ftf s]lx x|f; b]lvPsf] 5 . clxn]sf] jt{dfg k|lt/f]w / ;dy{g tx s|dzM !)*#=%% / !)@%=^( cªs k'u]sf] 5 . Nepse (Jan 01, 2014 – July 31, 2014)
- 5. l/n]l6j :6«]Gy OG8]S; -cf/P;cfO{_ cf/P;cfO{ k|fljlws ljZn]if0fsf] o:tf] cf}hf/ xf], h;nfO{ Pstlkm{ ?kdf rln/x]sf] ahf/df Jofkf/ /0fgLlt agfpg a9L pkof]uL dflgG5 . To;}u/L, o;n] ahf/df vl/b / ljlqmsf] :ki6 ;+s]t b]vfpg] u5{ . ahf/sf] k|j[lt cg'?k, cf/P;cfO{ ;"rsdf klg 7"nf] lu/fj6 cfPsf] 5 / of] xKtfsf] cGTo ;Dddf &@=%$ cªsdf aGb ePsf] 5 h'g cl3Nnf] xKtfsf] t'ngfdf !!=!@ cªs sd xf] . oBlk, cf/P;cfO{ cf]e/a6 If]qdf eGbf dfly g} sfod /x]sf] 5 . RSI (Jan 01, 2013 – July 31, 2014) d'leª Pe/]h sGeh]{G; 8fOeh]{G; -PdP;L8L_ PdP;L8Ldf b'O{ cf]6f /]vf x'G5g, h;df Pp6fn] ahf/sf] lbzf kl/jt{gsf] ;+s]t u5{ eg] csf]{n] ahf/sf] k|j[lQ -6«]08_ b]vfpg] u5{ . olb PdP;L8L /]vfn] l;Ung /]vfnfO{ tnaf6 dfly sf6]df o;nfO{ ;sf/fTds ;+s]tsf ?kdf lnO{G5 / o;n] z]o/x? lsGg] ;+s]t ub{5 . ;f]daf/sf lbg, PdP;L8L /]vfn] l;Ugn /]vfnfO{ dflyaf6 sf6]sf] 5 h;n] ahf/df z]o/ a]Rg] ;+s]t lbPsf] 5 . o;n] bL3{sfnLg d'leË Pe/]h -l;Ugn /]vf_ sf] t'ngfdf lgs6 cjlwsf] d'leË Pe/]h -PdP;L8L /]vf_ 36bf] k|j[ltdf /x]sf] ;+s]t u/]sf] 5 . jt{dfgdf, PdP;L8L / l;Ugn /]vf s|dzM #$=^) / #&=(! cªsdf sfod /x]sf 5g . MACD (Jan 01, 2013 – July 31, 2014) af]lnªu/ Aof08 af]lnªu/ Aof08 Ps k|fljlws ljZn]if0f ;"rs xf] h;df @!–lbg] d'leË Pe/]hsf ;fy b'O{ Aof08 -Pp6f dfly_ / Pp6f tn_ x'G5g . lo Aof08x?n] cl:y/tfsf] ;+s]t ub{5g, h'g :6fG88{ 8]leP;g u0fgf u/]/ kQf nufO{G5 . ut xKtf, g]K;] /]vf dflyNnf] Aof08 eGbf 6f9f /x]sf sf/0f, o;sf] 36g] k|j[lt hf/L /x]sf] 5 . kmn:j?k, g]K;] dWo Aof08 tk{m al9/x]sf] 5 h;n] ahf/ la:tf/} cf]e/a6 If]qaf6 t6:y If]q tk{m al9/x]sf] ;+s]t u/]sf] 5 .
- 6. Bollinger Bands (Jan 01, 2013 – July 31, 2014) ;du{dfM kl5Nnf] xKtfx?df w]/} gofF pRr cªsdf k'u]sf] g]K;] o; xKtf yf]/} l;lyn /x]sf] lyof] . lu/fj6sf] k|j[lt ;+u}, g]K;] !# cªs -jf !=@) k|ltzt_ n] a9]/ !)^^=)( cªsdf aGb ePsf] 5 . o; xKtf b}lgs cf}ift Jofkf/ - ef]No"d_ %!=)^ s/f]8 ?k}Fof /x]sf] lyof], h'g ut xKtf /x]sf] *(=&@ s/f]8 ?k}Fof eGbf cToflws lu/fj6 xf] . cl3Nnf] xKtf eg] cf}ift Jofkf/ -ef]No"d_ ^^=$^ s/f]8 ?k}Fof /x]sf] lyof] . ca csf]{ k|lt/f]w / ;dy{g tx s|dzM !)*^=%% / !)@%=^( cªs /x]sf] 5 . cf/P;cfO{ !!=!@ cªsn] 36]/ @=%$ cªs k'u]sf] 5 t/ klg of] ce}m cf]e/a6 If]qdf d} sfod /x]sf] 5 . PdP;L8L /]vfn] l;Ugn /]vfnfO{ dflyaf6 sf6]sf] 5 h;n] ahf/df z]o/x? a]Rg] ;+s]t lbPsf] 5 . af]lnË/ Aof08n] eg] ahf/ dWo Aof08 tk{m al9/x]sf]n] of] la:tf/} cf]e/a6 If]qaf6 xl6/x]sf] ;+s]t u/]sf] 5 . clwsf+z ;"rsx?n] xfnsf] ;dodf ahf/ cf]e/a6 /x]sf] b]vfPsf] 5 t/ ;fpg dlxgf ;'lrs[t sDkgLx?n] rf}yf] q}dfl;s cfly{s k|ltj]bg k]z ug]{ dlxgf ePsfn] lgs6 eljiodf ahf/df sd cl:y/tf / t];f]{ k|j[lt b]Vg ;lsg]5 .