Nepse Technical Analysis October 25 - October 30, 2015
•
0 likes•245 views

Nepse Weekly Technical Analysis October 25 - October 30, 2015

Recommended
Recommended
More Related Content
What's hot
What's hot (19)
Viewers also liked
Viewers also liked (13)
Similar to Nepse Technical Analysis October 25 - October 30, 2015
Similar to Nepse Technical Analysis October 25 - October 30, 2015 (17)
More from Kriti Capital & Investments Ltd.
More from Kriti Capital & Investments Ltd. (9)
Recently uploaded
Recently uploaded (20)
Nepse Technical Analysis October 25 - October 30, 2015
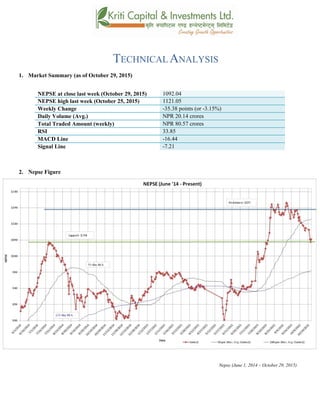
- 1. TECHNICAL ANALYSIS 1. Market Summary (as of October 29, 2015) NEPSE at close last week (October 29, 2015) 1092.04 NEPSE high last week (October 25, 2015) 1121.05 Weekly Change -35.38 points (or -3.15%) Daily Volume (Avg.) NPR 20.14 crores Total Traded Amount (weekly) NPR 80.57 crores RSI 33.85 MACD Line -16.44 Signal Line -7.21 2. Nepse Figure Nepse (June 1, 2014 – October 29, 2015)
- 2. 3. Trend Analysis The Nepse index ended on a bearish not throughout last week. The market lost 35.38 points (or 3.15%) to close at 1092.04. As mentioned before, the market remains bearish as a result to the fuel crisis, which has hurt industries and crippled the nation. However, the index showed some optimism by gaining 7.67 points on the last trading day of the week. Fuel agreement with China and the election of the first woman president of the nation must have caused investors to be bullish. 4. Resistance and Support Immediate Support 1084 Support 2 1053 Immediate Resistance 1183 Resistance 2 1205 The benchmark index crossed below the immediate support level of 1112 at the beginning of last week. The lowest Nepse went down to last week was at 1084.37, which is now a new support level. The index showed some optimism at the last trading day of last week. It is possible that the market could bounce back as investors seem bullish because of the new fuel treaty with China, as well as the election of the new president. The resistance level remains at 1183. 5. Trend Indicator a.) MACD The MACD is a momentum oscillator formed by using two different types of moving averages, which provides specific buying or selling signals. When a MACD line crosses above the signal line, it is considered to be a positive sign and indicates a time to buy, and vice-versa. The signal line landed on the negative territory at the beginning of last week. The macd and signal line stood at -7.96 and -0.19 respectively on Sunday. Both the lines continue to slide down signifying a bearish outlook of the market. By the end of the week, macd and signal line ended at -16.44 and -7.21 respectively. b.) RSI RSI is a form of leading indicator that is believed to be most effective during periods of sideways movement. Such indicators may create numerous buy and sell signals that are useful when the market is not clearly trending upwards or downwards.
- 3. The RSI at the beginning of the week stood at 38.86 level. In the course of the week, it lost 5.01 points to close at 33.85. The RSI is gradually entering the oversell zone as a result of the bearish sentiment in the market. RSI stood at 30.42 on Thursday, which shows that it could possible enter the 30s level. c.) Bollinger Bands The Bollinger Band is a technical indicator that consists of a moving average (21-day) along with two trading bands above (upper band) and below it (lower band). The bands are an indication of volatility, which are represented by calculating standard deviation. The benchmark index seems to be touching the lower band, indicating over-sell condition in the market. The index has been moving closer to the lower band throughout last week. Market volatility seems to be rising slowly as the upper and lower bands continue to diverge. 6. Volume Indicator (On-Balance Volume) On-Balance Volume (OBV) is a momentum indicator that relates volume to the current price of the index or security. It measures buying and selling pressure at the market. It acts as a cumulative indicator that adds volume on up days and subtracts volume on down days. If a price increase is supported by OBV, it confirms an uptrend, whereas if a price decrease is supported by OBV, it confirms a downtrend.
- 4. The OBV (On-Balance Volume) declined last week as well. However, the decline is not as much as compared to the fall witnessed by Nepse. This shows that the current fall in the market is not as strong. The average weekly volume transactions declined to NPR 20.14 crores from NPR 39.60 crores the week prior. 7. Overview The Nepse index decreased most of last week. The benchmark index lost 35.38 points (or down -3.15%) to close at 1092.04. The 50-day moving average (MA) is still moving above the 200-day MA, indicating that the overall outlook of the market looks good in the long-run. The macd and signal line continue to fall, signifying a bearish momentum in the market. The RSI closed at 33.85, indicating an over-sell condition in the market. Market volatility is still present as the Bollinger bands continue to widen. The bands also show prevalence of over-selling in the market as the index is touching the lower band. The new support level stands at 1084, whereas the resistance level stands the same at 1183.
- 5. k|fljlwsljZn]if0f !_ahf/ ;f/f+z -sflt{s!@, @)&@ ;Ddsf]_ aGb cªs -sflt{s !@, @)&@_ !)(@=)$ pRr cªs -uPsf] ;ftf_ !!@!=)% ;fKtflxs kl/jt{g –#%=#* -–#=!%k|ltzt_ b}lgscf};t Jofkf/ ¿=@)=!$s/f]8 s'n ;fKtflxsJofkf/ ¿ *)=%& s/f]8 cf/P;cfO{ ##=*% PdP;L8L – !^=$$ l;UgnnfO{g –&=@! @_ ahf/ k|j[lt Nepse (June 1, 2014 – October 29, 2015)
- 6. #_ 6]«G8 ljZn]if0f uPsf] ;ftfklgahf/ tneg]{ s|dhf/L g} /xof] . b]zsf] xfnsf] ufx|f] /fhgLlts kl/l:yltsf] kmn?j?k kl/;"rsn] uPsf] ;ftf #%=#* cªsu'dfof] . t/ ;ftfsf] cGtodf kl/;"rsdf&=^&cªssf] a[l4 /xof] . gofF /fi6«kltsf] lgo'ltmtyf g]kfn / rLgaLr t]n vl/b ug{ ;Def}tfePcg'?kahf/df s]xLpT;fx b]lvPsf] xf] . $_ 6]jftyfk|lt/f]w cªs glhssf] 6]jfcªs !)*$ 6]jfcªs @ !)%# glhssf] k|lt/f]w cªs !!*# uPsf] ;ftf kl/;"rs 6]jfcªs !!!@ eGbfcem} tn g} /xguof] .;f] ;ftf kl/;"rs ;a}eGbftn !)*$=#&cªs ;Ddk'Uguof] hf] clxn] sf] nflugofF 6]jfcªs /xguPsf] 5 . ;ftfsf] cGtolt/ /fhgLltstxdftyfrLg ;Fu ePsf] OGwgvl/b ug]{ ;Demf}tfsf] kmn:j?k s]xL ;'wf/ b]lvof] . xfnsf] nflugofFk|lt/f]w cªs !!*# /x]sf] 5 . %_ g]K;] 6]«G8 ;"rs s_ d'leª Pe/]hsGeh]{G; 8fOeh]{G; -PdP;L8L_ PdP;L8Ldf b'O{ cf]6f /]vf x'G5g, h;df Pp6fn] ahf/sf] lbzf kl/jt{gsf] ;+s]t u5{ eg] csf]{n] ahf/sf] k|j[lQ -6«]08_ b]vfpg] u5{ . olb PdP;L8L /]vfn] l;Ung /]vfnfO{ tnaf6 dfly sf6]dfo;nfO{ ;sf/fTds ;+s]tsf ?kdflnO{G5 / o;n] z]o/x? lsGg] ;+s]t ub{5 . uPsf] ;ftfl;UgnnfO{gn] qm0ffTds If]q 5'g uof] . cfO{tjf/sf] lbgdf PdP;L8L tyfl;UngnfO{g s|dzM –&=(^ tyf –)=!( sf] l:yltdf /x]sf] lyof] hf] ;ftfsf] cGtolt/ xfnsf] laol/; l:yltsf] kmn:j?ks|dzM –!^=$$ tyf –&=@! Dff /xguof] .
- 7. v_ l/n]l6j :6«]Gy OG8]S; -cf/P;cfO{_ cf/P;cfO{ k|fljlwsljZn]if0fsf] o:tf] cf}hf/ xf], h;nfO{ Pstlkm{ ?kdfrln/x]sf] ahf/dfJofkf/ /0fgLlt agfpg a9L pkof]uL dflgG5 . To;}u/L, o;n] ahf/dfvl/b / ljlqmsf] :ki6 ;+s]t b]vfpg] u5{ . uPsf] ;ftfsf] z'?dfcf/P;cfO{ #*=*^ cªsdf /x]sflyof] . ;ftfsf] w]/} h;f] lbglu/fj6 g} b]lvPsf] kl/;"rsdfcf/P;cfO{ ;ftfsf] cGtolt/ ##=*% /xguof] / ahf/dflaol/; 6]«G8 sfod /x]dfcf/P;cfO{ #) cªssf] n]en eGbftnhfg ;Sg] ;Defjgf a9L /x]sf] 5 . u_ af]lnªu/ Aof08 af]lnªu/ Aof08 Ps k|fljlwsljZn]if0f ;"rsxf] h;df @!–lbg] d'leËPe/]hsf ;fyb'O{ Aof08 -Pp6f dfly_ / Pp6f tn_ x'G5g . lo Aof08x?n] cl:y/tfsf] ;+s]t ub{5g, h'g :6fG88{ 8]leP;g u0fgf u/]/ kQfnufO{G5 . g]K;] kl/;"rsuPsf] ;ftftNnf] Aof08sf] glhsk'Uof] h;n] ahf/df a]Rg] xf]8afhL w]/} a9]sf] ;+s]t ub{5. pkNnf] tyftNnf] Jof08 aLrsf] b'/L s]xL a9g yfn]sf] cj:yfn] ahf/df km]l/ cl:yt/tf a9g ;Sg] ;+s]t ub{5 .
- 8. ^_ eNo'd ;'rs -cg–Aofn]G; eNo'd_ cg–Aofn]G; eNo'd n] ahf/dflsGg] tyf a]Rg] k|];/sf] ;+s]t ub{5 . ;d|udf of] ;"rsn] ahf/ dflyuPsf] cj:yftyftnem/]sf] cj:yfdfahf/dfsf/f]af/sf] eNo'd s:tf] /xof] ;+s]t ub{5 . cg–Aofn]G; eNo'ddftyf g]K;] kl/;"rsdf ;d]tuPsf] ;ftflu/fj6 b]lvof] t/ ;f] lu/fj6 g]K;] kl/;"rssf] lu/fj6 eGbfsd g} /xof] h;n] xfnsf] lu/fj6 Toltalnof] lu/fj6 g/x]sf] ;+s]t ub{5 . uPsf] ;ftfcf};t sf/f]af/ /sd ?= #(=^) s/f]8af6 36L ?=@)=!$ s/f]8 /xguof] . .
- 9. ;du{dfM uPsf] ;ftf g]K;] kl/;"rsdf 36g] s|dhf/L /xof] . kl/;"rsn] #%=#*cªsu'dfof] . xfnsf] cj:yfdf%) lbg] d'leËPe/]h @)) lbg] d'leËPe/]hnfO{ sf6L dfly lxl8/x]sf] cj:yf /x]sf] 5 h;n] ahf/dflaol/; 6]«G8 b]lvPtfklg;d|ddf bL3{sfnLglx;fan] ahf/ ce} klg /fd|} l:yltdf /x]sf] ;+s]t ub{5 . PdPl;8L tyfl;UgnnfO{g df b]lvPsf] lu/fj6n] ahf/ laol/; 6]«G8df /x]sf] ;+s]t ub{5 . ##=*%cªsf] l:yltdf /x]sf] cf/P;cfO{n] ahf/ cf]e/ z]nsf] cj:yfdf /x]sf ;+s]t ub{5 . af]lnªu/ Aof08n] xfnahf/df a]Rg] xf]8afhL a9L /x]sf] ;+s]t lbG5 . xfnsf] nflugofF 6]jfcªstyfk|lt/f]w cªs !)*$tyf !!*# /x]sf] 5 .