Nepse Technical Analysis October 11 - October 15, 2015
•
0 likes•298 views

Nepse Weekly Technical Analysis October 11 - October 15, 2015

Recommended
Recommended
More Related Content
What's hot
What's hot (20)
Viewers also liked
Viewers also liked (11)
Similar to Nepse Technical Analysis October 11 - October 15, 2015
Similar to Nepse Technical Analysis October 11 - October 15, 2015 (19)
More from Kriti Capital & Investments Ltd.
More from Kriti Capital & Investments Ltd. (20)
Recently uploaded
Recently uploaded (20)
Nepse Technical Analysis October 11 - October 15, 2015
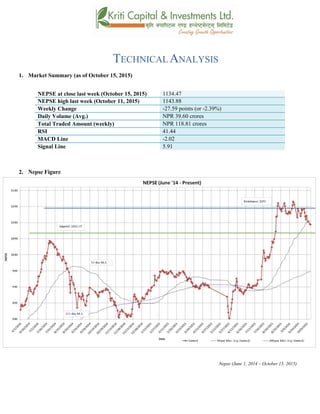
- 1. TECHNICAL ANALYSIS 1. Market Summary (as of October 15, 2015) NEPSE at close last week (October 15, 2015) 1134.47 NEPSE high last week (October 11, 2015) 1143.88 Weekly Change -27.59 points (or -2.39%) Daily Volume (Avg.) NPR 39.60 crores Total Traded Amount (weekly) NPR 118.81 crores RSI 41.44 MACD Line -2.02 Signal Line 5.91 2. Nepse Figure Nepse (June 1, 2014 – October 15, 2015)
- 2. 3. Trend Analysis The Nepse index ended in the red throughout last week. The market lost 18.18 points (or 1.56%) at the beginning of the week. It seems that bearish sentiment looms over the market as the current oil crisis does not seem to improve. As the fuel crisis remains uncertain, the market will remain bearish as economy has been hurt due to the crisis. 4. Resistance and Support Immediate Support 1112 Support 2 1083 Immediate Resistance 1183 Resistance 2 1205 The benchmark index crossed below the immediate support level of 1149 at the beginning of last week. The lowest Nepse went down to last week was at 1134.47. Due to the bearish sentiments at the market, the index could fall further. Hence, its immediate support level now stands at 1112.05 and resistance level stands at 1183. 5. Trend Indicator a.) MACD The MACD is a momentum oscillator formed by using two different types of moving averages, which provides specific buying or selling signals. When a MACD line crosses above the signal line, it is considered to be a positive sign and indicates a time to buy, and vice-versa. The Macd line ended at the negative territory at the end of last week, indicating a bearish signal. The signal line fell further as well. It is only a matter of time the signal line will fall into the negative territory as well. At the end of the week the macd and signal line ended at -2.02 and 5.91 respectively. b.) RSI RSI is a form of leading indicator that is believed to be most effective during periods of sideways movement. Such indicators may create numerous buy and sell signals that are useful when the market is not clearly trending upwards or downwards.
- 3. The RSI declined further towards the early 40’s zone at the end of last week. It shows market to be at a neutral stance. However, it shows that the market is gradually going towards an over-sell condition. The RSI stood at 44.06 on Sunday (beginning of the week). In the course of the week it lost 2.16 points to close at 41.44 level. c.) Bollinger Bands The Bollinger Band is a technical indicator that consists of a moving average (21-day) along with two trading bands above (upper band) and below it (lower band). The bands are an indication of volatility, which are represented by calculating standard deviation. The benchmark index is touching the lower Bollinger band, indicating an over-sell condition in the market. The upper and lower bands have shown signs of divergence, indicating a rise in the market volatility.
- 4. 6. Volume Indicator (On-Balance Volume) On-Balance Volume (OBV) is a momentum indicator that relates volume to the current price of the index or security. It measures buying and selling pressure at the market. It acts as a cumulative indicator that adds volume on up days and subtracts volume on down days. If a price increase is supported by OBV, it confirms an uptrend, whereas if a price decrease is supported by OBV, it confirms a downtrend. The OBV (On-Balance Volume) decline last week as well. The benchmark index fell further, signifying a bearish movement in the market. The average weekly volume transactions saw a decrease from NPR 42.89 crores to NPR 39.60 crores. 7. Overview The Nepse index decreased throughout last week. The benchmark index, lost 27.59 points (or down -2.39%) to close at 1134.47. Volatility is still present in the market as the fuel crises has given the public a bearish attitude. The 50-day moving average (MA) is still moving above the 200-day MA, indicating that the overall outlook of the market looks good. The average weekly volume transactions decreased to NPR 39.60 from NPR 42.89 week prior. The RSI closed at 41.44 level. Falling further would indicate an oversell condition in the market. The Bollinger bands show oversell condition in the market, as the index is touching the lower band. It has also shown signs of increase in market volatility. The new support level stands at 1112, whereas the resistance level stands the same at 1183.
- 5. k|fljlwsljZn]if0f !_ahf/ ;f/f+z -cflZjg@*, @)&@ ;Ddsf]_ aGb cªs -cflZjg@*, @)&@_ !!#$=$& pRr cªs -uPsf] ;ftf_ !!$#=** ;fKtflxs kl/jt{g –@&=%( -–@=#(k|ltzt_ b}lgscf};t Jofkf/ ¿=#(=^)s/f]8 s'n ;fKtflxsJofkf/ ¿ !!*=*! s/f]8 cf/P;cfO{ $!=$$ PdP;L8L – @=)@ l;UgnnfO{g %=(! @_ ahf/ k|j[lt Nepse (June 1, 2014 – October 15, 2015)
- 6. #_ 6]«G8 ljZn]if0f uPsf] ;ftfklgg]K;] kl/;"rsdflgs} cl:y/tf b]lvof] / ahf/dfsf/f]af/ lbgsf] ;a} lbglu/fj6 g} b]lvof] .kl/;"rsdf ;ftfsf] z'?df !*=!* cªssf] lu/fj6 b]lvof] . /fhgLltstxdf b]lvPsf] cl:y/tfsf] k|efj g]K;]df ;d]t b]lvof] / of] l:ylt sfdo g} /xg] xf] ahf/ cem} s]xL ;dosf] nflulaol/; g} /xg] ;+s]t 5 . $_ 6]jftyfk|lt/f]w cªs glhssf] 6]jfcªs !!!@ 6]jfcªs @ !)*# glhssf] k|lt/f]w cªs !!*# uPsf] ;ftf kl/;"rsglhssf] k|lt/f]w cªs !!$(eGbftn g} /xof] .xfn b]zsf] hl6n kl/l:yltsf] kmn:j?kahf/ cem} tnhfg ;Sg] ;+s]t b]lvof] . xfnsf] nflugofF 6]jftyfk|lt/f]w cªsxfnsf] nflu !!!@tyf !!*# /x]sf] 5 . %_ g]K;] 6]«G8 ;"rs s_ d'leª Pe/]hsGeh]{G; 8fOeh]{G; -PdP;L8L_ PdP;L8Ldf b'O{ cf]6f /]vf x'G5g, h;df Pp6fn] ahf/sf] lbzf kl/jt{gsf] ;+s]t u5{ eg] csf]{n] ahf/sf] k|j[lQ -6«]08_ b]vfpg] u5{ . olb PdP;L8L /]vfn] l;Ung /]vfnfO{ tnaf6 dfly sf6]dfo;nfO{ ;sf/fTds ;+s]tsf ?kdflnO{G5 / o;n] z]o/x? lsGg] ;+s]t ub{5 . uPsf] ;ftfklgPdP;L8L nfO{gtyfl;UngnfO{gdflu/fj6 g} b]lvof]h;n] ahf/xfnsf] nflulaol/; 6]«G8df /x]sf] ;+s]t ub{5 . xfnsf] hl6n kl/l:yltsf] kmn:j?kl;UgnnfO{gn] ;d]t qm0ffTds If]q 5'g ;Sg] ;+Defjgf a9]sf] 5 . xfnsf] nfluPdP;;L8L nfO{g tyfl;UgnnfO{g –@=)@tyf%=(!df /x]sf] 5 .
- 7. v_ l/n]l6j :6«]Gy OG8]S; -cf/P;cfO{_ cf/P;cfO{ k|fljlwsljZn]if0fsf] o:tf] cf}hf/ xf], h;nfO{ Pstlkm{ ?kdfrln/x]sf] ahf/dfJofkf/ /0fgLlt agfpg a9L pkof]uL dflgG5 . To;}u/L, o;n] ahf/dfvl/b / ljlqmsf] :ki6 ;+s]t b]vfpg] u5{ . uPsf] ;ftfklgcf/P;cfO{ $) cªssf] xf/fxf/Ldfk'u]sf] 5 h;n] clxn] ahf/ Go"6«n cj:yfdf /x]sf] ;+s]t ub{5 t/ xfnsf] lu/fj6n] ahf/ la:tf/} cf]e/ z]nsf] l:yltdf hfg] ;+s]t /xof] . ;ftfsf] z'?df $$=)^ cªsdf /x]sf] cf/P;cfO{ dflu/fj6sf] kmn:j?kcGtolt/ $!=$$ df /xguof] . u_ af]lnªu/ Aof08 af]lnªu/ Aof08 Ps k|fljlwsljZn]if0f ;"rsxf] h;df @!–lbg] d'leËPe/]hsf ;fyb'O{ Aof08 -Pp6f dfly_ / Pp6f tn_ x'G5g . lo Aof08x?n] cl:y/tfsf] ;+s]t ub{5g, h'g :6fG88{ 8]leP;g u0fgf u/]/ kQfnufO{G5 . g]K;] kl/;"rsuPsf] ;ftftNnf] Aof08sf] glhsk'Uof] h;n] ahf/df a]Rg] xf]8afhL w]/} a9]sf] ;+s]t ub{5. pkNnf] tyftNnf] Jof08 aLrsf] b'/L s]xL a9g yfn]sf] cj:yfn] ahf/df km]l/ cl:yt/tf a9g ;Sg] ;+s]t ub{5 .
- 8. ^_ eNo'd ;'rs -cg–Aofn]G; eNo'd_ cg–Aofn]G; eNo'd n] ahf/dflsGg] tyf a]Rg] k|];/sf] ;+s]t ub{5 . ;d|udf of] ;"rsn] ahf/ dflyuPsf] cj:yftyftnem/]sf] cj:yfdfahf/dfsf/f]af/sf] eNo'd s:tf] /xof] ;+s]t ub{5 .
- 9. cg–Aofn]G; eNo'ddftyf g]K;] kl/;"rsdf ;d]tuPsf] ;ftflu/fj6 b]lvof] . uPsf] ;ftfcf};t sf/f]af/ /sd ?= $@=*( s/f]8af6 36L ?=#(=^) s/f]8 /xguof] . ;du{dfM uPsf] ;ftf g]K;] kl/;"rsdf 36g] s|d b]lvof] . kl/;"rsn] @&=%(cªsu'dfof] . b]zdf a9b} uPsf] /fhgLltscl:y/tfn] ubf{ ahf/df ;du| ?kdflaol/; 6]«G8 b]lvof] .xfnsf] cj:yfdf%) lbg] d'leËPe/]h @)) lbg] d'leËPe/]hnfO{ sf6L dfly lxl8/x]sf] cj:yf /x]sf] 5 h;n]ahf/dflaol/; 6]«G8 b]lvPtfklg;d|ddfce} klg /fd|} l:yltdf /x]sf] ;+s]t ub{5 .cf};t sf/f]af/ /sd ? $@=*( s/f]8af6 36L ?=#(=^) s/f]8df /xguof] . $!=$$cªsf] l:yltdf /x]sf] cf/P;cfO{n] ahf/ clxn] Go"6«n cj:yfdf /x]sf] ;+s]t u/] klgeljiodfahf/ cf]e/ z]nsf] cj:yfdfhfg ;Sg] ;Defjgf b]lvof] . af]lnªu/ Aof08n] xfnahf/df a]Rg] xf]8afhL a9L /x]sf] ;+s]t lbG5 . xfnsf] nflugofF 6]jfcªstyfk|lt/f]w cªs !!!@tyf !!*# /x]sf] 5 .