Nepse technical analysis jan 11 jan 14, 2015 (eng & nep)
•
0 likes•255 views

- Nepse closed last week at 939.53 points, an increase of 0.92% from the previous week. - The RSI indicator has increased closer to the overbought zone, suggesting the market momentum is still upward. - The MACD indicator shows the near term momentum is upward as both lines moved gradually upwards in parallel.

Recommended
Recommended
More Related Content
What's hot
What's hot (20)
Viewers also liked
Similar to Nepse technical analysis jan 11 jan 14, 2015 (eng & nep)
Similar to Nepse technical analysis jan 11 jan 14, 2015 (eng & nep) (14)
More from Kriti Capital & Investments Ltd.
More from Kriti Capital & Investments Ltd. (20)
Recently uploaded
Recently uploaded (20)
Nepse technical analysis jan 11 jan 14, 2015 (eng & nep)
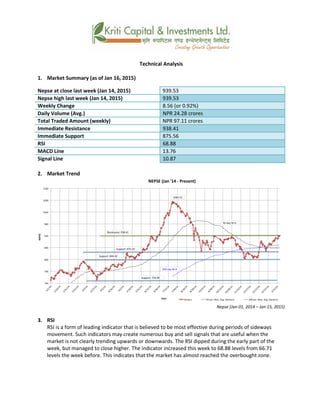
- 1. Technical Analysis 1. Market Summary (as of Jan 16, 2015) Nepse at close last week (Jan 14, 2015) 939.53 Nepse high last week (Jan 14, 2015) 939.53 Weekly Change 8.56 (or 0.92%) Daily Volume (Avg.) NPR 24.28 crores Total Traded Amount (weekly) NPR 97.11 crores Immediate Resistance 938.41 Immediate Support 875.56 RSI 68.88 MACD Line 13.76 Signal Line 10.87 2. Market Trend Nepse (Jan 01, 2014 – Jan 15, 2015) 3. RSI RSI is a form of leading indicator that is believed to be most effective during periods of sideways movement. Such indicators may create numerous buy and sell signals that are useful when the market is not clearly trending upwards or downwards. The RSI dipped during the early part of the week, but managed to close higher. The indicator increased this week to 68.88 levels from 66.71 levels the week before. This indicates that the market has almost reached the overbought zone.
- 2. RSI (Jan 02, 2014 – Jan 15, 2015) 4. MACD The MACD is a momentum oscillator formed by using two different types of moving averages, which provides specific buying or selling signals. When a MACD line crosses above the signal line, it is considered to be a positive sign and indicates a time to buy, and vice-versa. Compared to the previous week, there were very minor changes with the MACD indicator. Both the MACD and signal lines moved gradually upwards on a parallel note suggesting that the near term momentum has been in the upward direction. MACD (Jan 02, 2014 – Jan 15, 2015) 5. Bollinger Bands The Bollinger Band is a technical indicator that consists of a moving average (21-day) along with two trading bands above (upper band) and below it (lower band). The bands are an indication of volatility, which are represented by calculating standard deviation. During the past week, Nepse inclined further upwards and has touched the upper-band suggesting slight increase in market momentum. At the same time, the upper and lower bands appear to have converged in recent times, which indicates lower volatility.
- 3. Bollinger Bands (Jan 02, 2014 – Jan 15, 2015) Overview: This past week began on a lower note with the market falling during the first two days of trading. However, it increased during the remaining two trading days, which pushed up the market to 939.53 points – an increase of 8.56 points or 0.92%. With the country moving towards the Constitution promulgation deadline of Magh 8, investors appear to be in a wait and watch mood hoping for consensus among political parties. The average daily volume in the market fell this week to 24.28 crores from 28.48 crores the week before. Nepse has once again moved towards the nearest resistance level of 938.41 points. Since August 2014, Nepse has twice failed to move past this strong level. However, the nearest support level currently stands at 875.56 points. The RSI indicator has inched higher to 68.88 levels moving it closer to the overbought zone. The MACD indicator shows that the near term momentum in the market is still in the upward direction. The Bollinger Bands suggest decreasing volatility in the market. In the present scenario, the 50-day moving average hovering below the 200-day moving average generally represents a bearish scenario. However, if Nepse can move past its nearest resistance level, the market may move further ahead in the upward direction.
- 4. k|fljlws ljZn]if0f ahf/ ;f/f+z -k'; @& b]vL k'if #) ;Ddsf]_ aGb cªs -k'if #)_ (#(=%# pRr cªs -k'if #)_ (#(=%# ;fKtflxs kl/jt{g *=%^ ()=(@ k|ltzt) b}lgs cf};t Jofkf/ ¿= (#(=%# s/f]8 s'n ;fKtflxs Jofkf/ ¿= (&=!! s/f]8 tTsflng 6]jf (#*=$! tTsflng k|lt/f]w *&%=%^ cf/P;cfO{ ^*=** PdP;L8L !#=&^ l;Ugn nfO{g !)=*& Nepse (Jan 01, 2014 – Jan 15, 2015) l/n]l6j :6«]Gy OG8]S; -cf/P;cfO{_ cf/P;cfO{ k|fljlws ljZn]if0fsf] o:tf] cf}hf/ xf], h;nfO{ Pstlkm{ ?kdf rln/x]sf] ahf/df Jofkf/ /0fgLlt agfpg a9L pkof]uL dflgG5 . To;}u/L, o;n] ahf/df vl/b / ljlqmsf] :ki6 ;+s]t b]vfpg] u5{ . o; cf/P;cfO xKtfsf] k|f/lDes efudf tn em/]sf] t/ ;ftfsf] cGto lt/ csfnf] r9]sf] 5 . o; ;ftf g]K;]
- 5. ^^=&! cªsaf6 ^^=** cªsdf a9]sf] 5 . xfnsf] ;dodf z]o/x?sf] dfu a9]sf] sf/0f ahf/ cf]e/a6 If]q glhs ws]lnPsf] 5 . RSI (Jan 02, 2014 – Jan 15, 2015) d'leª Pe/]h sGeh]{G; 8fOeh]{G; -PdP;L8L_ PdP;L8Ldf b'O{ cf]6f /]vf x'G5g, h;df Pp6fn] ahf/sf] lbzf kl/jt{gsf] ;+s]t u5{ eg] csf]{n] ahf/sf] k|j[lQ -6«]08_ b]vfpg] u5{ . olb PdP;L8L /]vfn] l;Ung /]vfnfO{ tnaf6 dfly sf6]df o;nfO{ ;sf/fTds ;+s]tsf ?kdf lnO{G5 / o;n] z]o/x? lsGg] ;+s]t ub{5 . cl3Nnf] xKtfsf] t'ngfdf PdP;L8L ;"rsdf w]/} ;–;fgf kl/jt{g b]lvP . b'j} PdP;L8L tyf l;Ugn nfOg dfly tkm{ cl3 a9]sf 5g h;n] ahf/ cem a9g] ;Dejgf /x]sf] ;+s]t u/]sf] 5 . MACD (Jan 02, 2014 – Jan 15, 2015) af]lnªu/ Aof08 af]lnªu/ Aof08 Ps k|fljlws ljZn]if0f ;"rs xf] h;df @!–lbg] d'leË Pe/]hsf ;fy b'O{ Aof08 -Pp6f dfly_ / Pp6f tn_ x'G5g . lo Aof08x?n] cl:y/tfsf] ;+s]t ub{5g, h'g :6fG88{ 8]leP;g u0fgf u/]/ kQf nufO{G5 .o; uPsf] xKtf g]K;] kl/;"rs dfly a9]sf] cj:yf /x]sf] lyof] h;n] ubf{ ahf/n] pkNnf] Aof08 5f]Psf] 5 h'g ahf/df cfPsf] ultsf] ;+s]t xf] . ;+u ;+u} pkNnf] / tnsf] Aof08 Ps} 7fFpdf k'u]sf] cj:yfn] ahf/df cl:y/tfsf] s]xL sdL cfPsf] dfGg ;lsG5 .
- 6. Bollinger Bands (Jan 02, 2014 – Jan 15, 2015) ;du{dfM of] uPsf] xKtf sf/f]af/sf] z'?sf] b'O{ lbg hlt ahf/ tn em/]sf] cj:yf lyof] . t/ To; kl5sf] b'O{ sf/f]af/ lbg ahf/ dfly lt/ csfnf] nfuof] h;n] g]K;] kl/;"rsnfO{ (#(=%# ;Dd nuof] h'g *=%^ cªssf] -jf )=(@ k|ltzt_ j'l4 xf] . ;+ljwfg hf/L ul/;Sg' kg]{ lbg glhlsPsf] x'Fbf nufgLstf{x?df cGof]nsf] dfxf]n /x]sf] 5 h;n] ubf{ ;a} hgf kv{ / x]/sf] l:yltdf /x]sf 5g . ahf/sf] k|lt lbg cf};t sf/f]af/ /sd @$=@* s/f]8 /xof] h'g cl3Nnf] ;ftf @*=$* sf] l:yltdf /x]sf] lyof] . g]K;] kl/;"rs of] ;ftf lgs6 6]jf cªs (#*=$! tkm{ ;/]sf] lyof] . cu:6 @)!$ otf g]K;] b'O{ kN6 alnof] :t/ kf/ ug{ c;kmn /x]sf] 5 . tbflk lgs6 6]jf cªs *&%=%^ sf] l:yltdf /xof] . cf/P;cfO{ ^*=** cªs k'u]sf] 5 h;n] ahf/nfO{ cf]e/a6 If]q glhs k'¥ofPsf] 5 . xfn PdP;L8L /]vf dfly a9]sf xF'bf h;n] ahf/ cem a9g] ;Dejgf /x]sf] ;+s]t u/]sf] 5 . xfn, af]lnªu/ Aof08n] ahf/sf] cl:yt/tf s]xL sdL cfPsf] ;+s]t ub{5 . xfnsf] ;do %)–lbg] d'leË Pe/]h @))–lbg] d'leË Pe/]h eGbf d'gL /x]sf] 5 h;n] ahf/sf] lb3{sfnLg k|j[ltn] ce}m ;sf/fTds lbzf lng g;s]sf] ;+s]t u/]sf] 5 . ;du|df x]bf{ g]K;] kl/;"rs glhssf] 6]jf cªs kf/ ug]{ xf] eg] ahf/ cem} dfly hfg ;Sg] ;Defjgf /x]sf] 5 .