Nepse technical analysis august 12 august 14, 2014 (eng & nep)
•
0 likes•201 views

Technical analysis of Nepal Stock Exchange (Nepse) index for the week from July 12, 2014 to July 14, 2014. The technical analysis includes summary, RSI, MACD and Bollinger band analysis. The analysis is done by Kriti Capital & Investments Ltd.

Recommended
Recommended
More Related Content
What's hot
What's hot (20)
Viewers also liked
Viewers also liked (11)
Similar to Nepse technical analysis august 12 august 14, 2014 (eng & nep)
Similar to Nepse technical analysis august 12 august 14, 2014 (eng & nep) (15)
More from Kriti Capital & Investments Ltd.
More from Kriti Capital & Investments Ltd. (20)
Recently uploaded
Recently uploaded (20)
Nepse technical analysis august 12 august 14, 2014 (eng & nep)
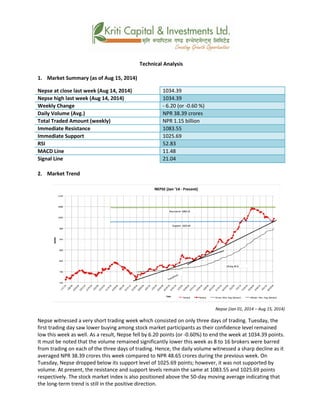
- 1. Technical Analysis 1. Market Summary (as of Aug 15, 2014) Nepse at close last week (Aug 14, 2014) 1034.39 Nepse high last week (Aug 14, 2014) 1034.39 Weekly Change - 6.20 (or -0.60 %) Daily Volume (Avg.) NPR 38.39 crores Total Traded Amount (weekly) NPR 1.15 billion Immediate Resistance 1083.55 Immediate Support 1025.69 RSI 52.83 MACD Line 11.48 Signal Line 21.04 2. Market Trend Nepse (Jan 01, 2014 – Aug 15, 2014) Nepse witnessed a very short trading week which consisted on only three days of trading. Tuesday, the first trading day saw lower buying among stock market participants as their confidence level remained low this week as well. As a result, Nepse fell by 6.20 points (or -0.60%) to end the week at 1034.39 points. It must be noted that the volume remained significantly lower this week as 8 to 16 brokers were barred from trading on each of the three days of trading. Hence, the daily volume witnessed a sharp decline as it averaged NPR 38.39 crores this week compared to NPR 48.65 crores during the previous week. On Tuesday, Nepse dropped below its support level of 1025.69 points; however, it was not supported by volume. At present, the resistance and support levels remain the same at 1083.55 and 1025.69 points respectively. The stock market index is also positioned above the 50-day moving average indicating that the long-term trend is still in the positive direction.
- 2. 1. RSI RSI is a form of leading indicator that is believed to be most effective during periods of sideways movement. Such indicators may create numerous buy and sell signals that are useful when the market is not clearly trending upwards or downwards. Lack of enthusiasm among investors along with low volume has caused the RSI to fall to 52.83 levels. As a result, Nepse is still maintaining within the neutral zone. RSI (Jan 01, 2013 –Aug 15, 2014) 2. MACD The MACD is a momentum oscillator formed by using two different types of moving averages, which provides specific buying or selling signals. When a MACD line crosses above the signal line, it is considered to be a positive sign and indicates a time to buy, and vice-versa. Continuing the trend from the previous week, the MACD and Signal lines have dropped significantly with the MACD line falling with a greater momentum. This implies a downward pressure on the market in the near term. MACD (Jan 01, 2013 – Aug 15, 2014) 3. Bollinger Bands The Bollinger Band is a technical indicator that consists of a moving average (21-day) along with two trading bands above (upper band) and below it (lower band). The bands are an indication of volatility, which are represented by calculating standard deviation. With another week of decline in the market, the Nepse line has almost touched the lower band. This indicates that the market may be getting oversold in the near term. The converging bands also indicate low volatility in the market in recent times.
- 3. Bollinger Bands (Nov 04, 2013 – Aug 15, 2014) Overview: Nepse witnessed another drop this week which only consisted of 3 days of trading. The first day saw a huge decline followed by two positive days – resulting in Nepse losing 6.20 points (or 0.60%) for the week. Numerous brokers were halted from trading this week as well resulting in a severe decline in trading volume which averaged just NPR 38.39 crores each day. The RSI declined this week to 52.83 levels suggesting that the market is neither overbought nor oversold at present. However, the MACD indicator shows that the near term momentum has been falling at a greater pace than the longer term momentum. The Bollinger Bands indicate that the market has gradually fallen into oversold region. Overall, the indicators indicate that there has been greater downward momentum in the market in recent times, however, with lower volume. This may indicate that selling is gradually getting exhausted in the market, which may invite investors who are looking for bargains.
- 4. k|fljlws ljZn]if0f ahf/ ;f/f+z ->fj0f @% b]vL >fj0f @( ;Ddsf]_ aGb cªs ->fj0f @(_ M !)#$=#( pRr cªs ->fj0f @(_ M !)#$=#( ;fKtflxs kl/jt{g M –^=@) cªs -–)=^) k|ltzt_ b}lgs cf};t Jofkf/ M ¿= #*=#( s/f]8 s'n ;fKtflxs Jofkf/ M ¿= ! ca{ !% s/f]8 tTsflng 6]jf M !)*#=%% tTsflng k|lt/f]w M !)@%=^( cf/P;cfO{ M %@=*# PdP;L8L M !!=$* l;Ugn nfO{g M @!=)$ %) tyf @)) lbg] d'leª Pe/]h g]K;]df o; ;ftf tLg lbgdfq sf/f]af/ ePsf] 5 . o; ;ftf klg nufgLstf{x?sf] ahf/ k|ltsf] efj sd /x]sfn] ;ftfsf] klxnf] sf/f]af/ lbg, d+unaf/, ahf/df vl/b bafa sd b]lvof] . kmn:j?k, g]K;] ^=@) cªs – jf )=^) k|ltzt_ n] 36]/ !)#$=#( cªs k'u]sf] 5 . o; ;ftf klg nuftf/ tLg k|To]s lbg * b]lv !^ a|f]s/x?n] sf/f]af/ ug{ gkfPsf sf/0f klg Jofkf/ -ef]No"d_ t'ngfTds ?kdf sd /x]sf] lyof] . t;y{, ut xKtf $*=^% s/f]8 ?k}Fof /x]sf] b}lgs cf}ift Jofkf/ -ef]No"d_ o; ;ftf 36]/ #*=#( s/f]8 ?k}Fof k'u]sf] 5 . d+unaf/sf lbg g]K;] !)@%=^( cªssf] ;dy{g tx eGbf d'gL v;]sf] lyof] / Jofkf/ -ef]No"d_ eg] sd /x]sf] lyof] . jt{dfgdf, ahf/sf] k|lt/f]w / 6]jf÷;dy{g cªs s|dzM !)*#=%% / !)@%=^( cªs /x]sf] 5 . g]K;] %)–lbg] d'leË Pe/]h eGbf dfly g} /x]sfn] ahf/sf] bL3{sfnLg k|j[lt a'ln; g} /x]sf] 5 .
- 5. Nepse (Jan 01, 2014 – August 14, 2014) l/n]l6j :6«]Gy OG8]S; -cf/P;cfO{_ cf/P;cfO{ k|fljlws ljZn]if0fsf] o:tf] cf}hf/ xf], h;nfO{ Pstlkm{ ?kdf rln/x]sf] ahf/df Jofkf/ /0fgLlt agfpg a9L pkof]uL dflgG5 . To;}u/L, o;n] ahf/df vl/b / ljlqmsf] :ki6 ;+s]t b]vfpg] u5{ . nufgLstf{x? lar ahf/k|ltsf] pT;fxdf sld / Jofkf/ -ef]No"d_ df lu/fj6sf sf/0f cf/P;cfO{ 36]/ %@=*# cªs k'u]sf] 5 . kmn:j?k, g]K;] ce}m klg t6:y If]q leq sfod /x]sf] 5 . RSI (Jan 01, 2013 – August 14, 2014) d'leª Pe/]h sGeh]{G; 8fOeh]{G; -PdP;L8L_ PdP;L8Ldf b'O{ cf]6f /]vf x'G5g, h;df Pp6fn] ahf/sf] lbzf kl/jt{gsf] ;+s]t u5{ eg] csf]{n] ahf/sf] k|j[lQ -6«]08_ b]vfpg] u5{ . olb PdP;L8L /]vfn] l;Ung /]vfnfO{ tnaf6 dfly sf6]df o;nfO{ ;sf/fTds ;+s]tsf ?kdf lnO{G5 / o;n] z]o/x? lsGg] ;+s]t ub{5 . cl3Nnf] xKtfsf] k|j[lt ;+u}, PdP;L8L /]vf / l;Ugn /]vf b'j} 36]sf] 5 h;df PdP;L8L /]vf a9L ultn] 36]sf] 5 . o;n] lgs6 eljiodf ahf/ 36g] bafadf /x]sf] ;+s]t u/]sf] 5 . MACD (Jan 01, 2013 – August 14, 2014) af]lnªu/ Aof08 af]lnªu/ Aof08 Ps k|fljlws ljZn]if0f ;"rs xf] h;df @!–lbg] d'leË Pe/]hsf ;fy b'O{ Aof08 -Pp6f dfly_ / Pp6f tn_ x'G5g . lo Aof08x?n] cl:y/tfsf] ;+s]t ub{5g, h'g :6fG88{ 8]leP;g u0fgf u/]/ kQf nufO{G5 . csf]{ lu/fj6sf] xKtf ;+u}, g]K;]n] nueu tNnf] Aof08 5f]Psf] 5 . o;n] lgs6 eljiodf ahf/ cf]e/;f]N8 /xg ;Sg] ;+s]t u/]sf] 5 . b'O{ Aof08x? lar 3l6/x]sf] b'/Ln] ahf/df cl:y/tf 3l6/x]sf] ;+s]t u/]sf] 5 .
- 6. Bollinger Bands (Jan 01, 2013 – August 14, 2014) ;du{dfM o; ;ftf klg g]K;]df csf]{ lu/fj6 b]lvPsf] 5 h;df tLg lbg dfq sf/f]af/ ePsf] lyof] . klxnf] sf/f]af/ lbg, g]K;]df 7"nf] lu/fj6 b]lvPsf] lyof] To; kl5 g]K;] b'O{ lbg ;sf/fTds /xof] . ;ftfsf] cGTodf g]K;] ^=@) cªs -jf )=^) k|ltzt_ n] 36]sf] 5 . o; ;ftf klg y'k|} a|f]s/x?n] ljleGg sf/0fj; sf/f]af/ ug{ kfPgg h;n] ubf{ Jofkf/ -ef]No"d_ df lu/fj6 b]lvPsf] 5 h'g o; ;ftf #*=#( s/f]8 ?k}Fof dfq /xof] . o; ;ftf, cf/P;cfO{ 36]/ %@=*# cªsdf k'u]sf] 5 h;n] tTsfn ahf/ g cf]e/a6 g cf]e/;f]N8 /x]sf] ;+s]t u/]sf] 5 . t/, PdP;L8L ;"rsn] eg] lgs6 eljiosf] d'leË Pe/]h, bL3{sfnLg d'leË Pe/]h eGbf a9L ultn] 3l6 /x]sf] b]vfPsf] 5 . af]lnË/ Aof08n] ahf/ lj:tf/} cf]e/;f]N8 tk{m al9 /x]sf] ;+s]t u/]sf] 5 . ;du{df, ;"rsx?n] xfnsf] ;dodf sd Jofkf/ -ef]No"d_ ;+u} ahf/ emg]{ k|j[ltdf /x]sf] ;+s]t u/]sf] 5 . o;n] ahf/df a]Rg] bafa lj:tf/} 36b} uO{/x]sf] ;+s]t u/]sf] 5 h;n] ahf/df ;:tf] z]o/x? k|lt nufgLstf{x?sf] cfsif{0f a9g ;Sg] 5 .