Nepse technical analysis 29 march - 3 april, 2015
•
0 likes•206 views

Nepse Weekly Technical Analysis 29 March - 3 April, 2015

Recommended
Recommended
More Related Content
What's hot
What's hot (20)
Viewers also liked
Viewers also liked (15)
Similar to Nepse technical analysis 29 march - 3 april, 2015
Similar to Nepse technical analysis 29 march - 3 april, 2015 (12)
More from Kriti Capital & Investments Ltd.
More from Kriti Capital & Investments Ltd. (20)
Recently uploaded
Recently uploaded (20)
Nepse technical analysis 29 march - 3 april, 2015
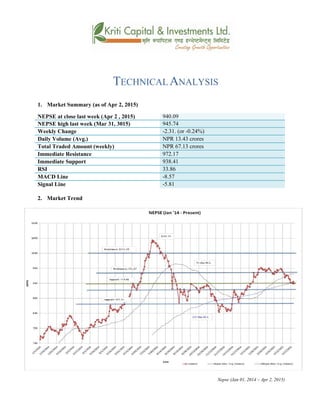
- 1. TECHNICAL ANALYSIS 1. Market Summary (as of Apr 2, 2015) NEPSE at close last week (Apr 2 , 2015) 940.09 NEPSE high last week (Mar 31, 3015) 945.74 Weekly Change -2.31. (or -0.24%) Daily Volume (Avg.) NPR 13.43 crores Total Traded Amount (weekly) NPR 67.13 crores Immediate Resistance 972.17 Immediate Support 938.41 RSI 33.86 MACD Line -8.57 Signal Line -5.81 2. Market Trend Nepse (Jan 01, 2014 – Apr 2, 2015)
- 2. 3. RSI RSI is a form of leading indicator that is believed to be most effective during periods of sideways movement. Such indicators may create numerous buy and sell signals that are useful when the market is not clearly trending upwards or downwards. RSI fell below the 30 level during the beginning of the week, reaching at 29.41 level, indicating a strong buy signal. RSI, at the beginning of the week, was 31.01. However, by the end of the week, the level moved up to 33.86. If the RSI continues to ascend, it will be at a neutral state. RSI (Jan 01, 2014 – Apr 2, 2015) 4. MACD The MACD is a momentum oscillator formed by using two different types of moving averages, which provides specific buying or selling signals. When a MACD line crosses above the signal line, it is considered to be a positive sign and indicates a time to buy, and vice-versa. The MACD line is still below the signal line, continuing its downward momentum. Both the lines are at negative territory. MACD at the end of last week stands at -8.57 and Signal Line at -5.81. Both the lines seem to be moving close together. If the MACD line crosses above the signal line, it would indicate a buy trigger. MACD (Jan 01, 2014 – Apr2, 2015) 5. Bollinger Bands The Bollinger Band is a technical indicator that consists of a moving average (21-day) along with two trading bands above (upper band) and below it (lower band). The bands are an indication of volatility, which are represented by calculating standard deviation.
- 3. The NEPSE index experienced several swings last week. The index touched the lower band during the start of the week. However by the end of the week, it moved up between the mid and lower bands. The upper and the lower bands appear to be diverging. This indicates an increase in volatility in the market. Bollinger Bands (Jan 01, 2014 – Apr 2, 2015) Overview: NEPSE ended in the green last week as it closed higher by a meager 0.55 points (or 0.06%) to end at 940.09 points. Nepse faced frequent swings throughout the week. It closed slightly lower than the week’s average of 941.35. The average daily market volume decreased last week to NPR 13.43 crores from NPR 21.09 crores the week prior. A likely explanation for this decrease in volume is because of lack of capital liquidity in the market due to large number of IPOs. The 50-day moving average is still increasing at a higher rate above the 200-day moving average suggesting that the overall view of the market remains positive. The RSI fell below the 30-levels at the beginning of the week, signifying buy-sign. However, currently it’s at a neutral zone, standing at 33.86 level. The MACD line is moving close with the signal line and is still at the negative territory. If MACD moves above the signal line, it will trigger a buy sign. The upper and lower Bollinger Bands appears to be diverging, suggesting increase in market volatility. Nepse’s support and resistance level stands the same at 938.41 and 972.17 points respectively.
- 4. k|fljlwsljZn]if0f ahf/ ;f/f+z -r}q !(, @)&!;Ddsf]_ aGb cªs -r}q !(, @)&!_ ($)=)( pRr cªs -uPsf] ;ftf_ ($%=&$ ;fKtflxs kl/jt{g –@=#! -–)=@$k|ltzt_ b}lgscf};t Jofkf/ ¿=!#=$# s/f]8 s'n ;fKtflxsJofkf/ ¿=^&=!# s/f]8 tTsflng 6]jf (&@=!& tTsflngk|lt/f]w (#*=$! cf/P;cfO{ ##=*^ PdP;L8L –*=%& l;UgnnfO{g –%=*! बजारप्रवृित्त
- 5. Nepse (Jan 01, 2014 – Apr 2,2015) l/n]l6j :6«]Gy OG8]S; -cf/P;cfO{_ cf/P;cfO{ k|fljlwsljZn]if0fsf] o:tf] cf}hf/ xf], h;nfO{ Pstlkm{ ?kdfrln/x]sf] ahf/dfJofkf/ /0fgLlt agfpg a9L pkof]uL dflgG5 . To;}u/L, o;n] ahf/dfvl/b / ljlqmsf] :ki6 ;+s]t b]vfpg] u5{ . of] uPsf] ;ftfsf] z'?df #!=)! cªs /x]sf]cf/P;cfO{ #) cªseGbftnem/L @(=$!cªsdfk'Uguof] . tn ;ftfsf] cGTolt/ dfly r9]sf] cf/P;cfO{n] ##=*^ cªs 5'g k'Uof] .cf/P;cfO{ a9g] s|d /x]dfo;n] ahf/nfO{ km]l/ Go"6«n cj:yfdfsfod /fVg] 5 . RSI (Jan 01, 2014 – Apr 2, 2015) d'leª Pe/]hsGeh]{G; 8fOeh]{G; -PdP;L8L_ PdP;L8Ldf b'O{ cf]6f /]vf x'G5g, h;df Pp6fn] ahf/sf] lbzf kl/jt{gsf] ;+s]t u5{ eg] csf]{n] ahf/sf] k|j[lQ -6«]08_ b]vfpg] u5{ . olb PdP;L8L /]vfn] l;Ung /]vfnfO{ tnaf6 dfly sf6]dfo;nfO{ ;sf/fTds ;+s]tsf ?kdflnO{G5 / o;n] z]o/x? lsGg] ;+s]t ub{5 . o; uPsf] ;ftf PdP;L8L nfO{g w]/} h;f] l;UgnnfOgeGbftn g} /xof] h;n] ahf/sf] ultlzntfdflu/fj6 g} /x]sf] ;+s]t u/of] . PdP;L8LnfO{guPsf] ;ftf–*=%&tyfl;UgnnfO{g ;d]t gsf/fTds If]qlt/ k|j]z u/L –%=*! 5'g k'u]sf] 5h;n] ahf/dflaol/; 6]«G8sf] ;+s]t ub{5 .b'j} nfOg ;+u;+u} rln/x]sf] cj:yf /xof] / PdP;L8LnfO{g l;UgnnfO{g eGbfdflycfpguPdfo;n] ahf/dflsGg] xf]8afhLsf] ;+s]t ub{5 .
- 6. MACD (Jan 01, 2014 – Apr2, 2015) af]lnªu/ Aof08 af]lnªu/ Aof08 Ps k|fljlwsljZn]if0f ;"rsxf] h;df @!–lbg] d'leËPe/]hsf ;fyb'O{ Aof08 -Pp6f dfly_ / Pp6f tn_ x'G5g . lo Aof08x?n] cl:y/tfsf] ;+s]t ub{5g, h'g :6fG88{ 8]leP;g u0fgf u/]/ kQfnufO{G5 . of] uPsf] ;ftf g]K;] kl/;"rsn] w]/} ptf/ r9fj dxz'; u/of] . g]K;] kl/;"rsn] ;ftfsf] z'?dftNnf] Aof08 5'g k'Uof] . tnuPsf] ;ftfsf] cGtolt/ g]K; kl/;"rsdWotyftNnf] Aof08sf] aLrlt/ k'Uguof] . pkNnf] tyftNnf] Aof08sf] b'/L cem} a9]sf] o;n] ahf/dfcem} cl:y/tfsfod /x]sf] ;+s]t ub{5 . Bollinger Bands (Jan 01, 2014 – Apr 2, 2015)
- 7. ;du{dfM of] uPsf] ;ftf g]K;] kl/;"rsdf s]xL ;'wf/ b]lvPtfklg kl/;"rs s]jn )=%% cªsn] -)=)^Ü_ a9L ($)=)(cªsdf;dfKteof] . of] uPsf] ;ftfdf g]K;] kl/;"rsfdf w]/} ptf/ r9fj b]lvPh;sf] kmn:j?kkl/;"rs ;ftfsf] cf};t($!=#% eGbfs]xLtn g} ;dfKteof] . cf};t sf/f]af/ /sduPsf] ;ftf ?= !#=$# s/f]8 /xof] h'gTof] eGbf cufl8sf] ;ftf ?= @!=)( s/f]8 /x]sf] lyof] .cf};tsf/f]af/ /sddfuPsf] ;ftfljleGgsDkgLsf] k|fyldslgisfzgsf] sf/0fn] ubf{ k|efj k/]sf] dxz'; ul/of] . %)–lbg] d'leËPe/]hn] @))–lbg] d'leËPe/]hnfO{ sf6L dfly /x]sf] cj:yf / ;f]dfcfPsf] ultn] ahf/dfcem} ;sf/fTds ;+s]tx? g} oyfjt /x]sf 5g .of] uPsf] ;ftfsf] z'?df#) cªseGbftnem/]sf] cf/P;cfO{n] ahf/dflsGg] xf]8afhLsf] ;+s]t u/of] t/ ;ftfsf] cGTolt/ dfly r9]sf] cf/P;cfO{n] ahf/nfO{ km]l/ Go6«n cj:yflt/ g} lkmtf{ nu]sf] 5 . PdP;L8L nfOgl;UngnfO{g ;Fu ;Fu} rln/x]sf] cj:yf /xof] / ;f] nfO{g gsf/fTds If]q lt/ k'u]sf] 5 h;n] ahf/df a]Rg] ;+s]t ub{5 .PdP;L8L nfOgn] l;UgnnfO{ sf6L dflycfPdfo;n] ahf/dflsGg] xf]8afhLsf] ;+s]t ub{5 .af]lnªu/ Aof08n] ahf/dfcem} cl:yt/tfsfod /x]sf] ;+s]t u/]sf] 5 . g]K;] kl/;"rsdfuPsf] ;ftfcem} klg 6]jfcªs (#*=$!cªs /xguPsf] 5 / k|lt/f]w cªs klg(&@=!& g} /x]sf] 5 .