NEPSE Technical Analysis Summary
•
0 likes•225 views

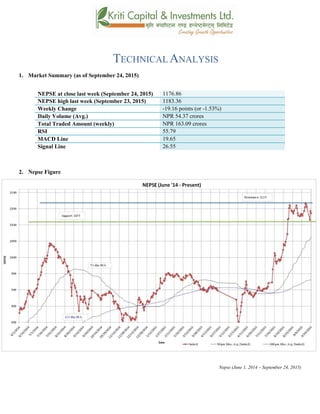
The Nepse index ended lower for most of last week, losing 19.16 points to close at 1176.86. While the 50-day moving average remains above the 200-day average indicating an overall positive market, the current trend shows Nepse falling slightly near support levels. Technical indicators like MACD and RSI signal a neutral market, though volatility may rise as seen in diverging Bollinger bands. The new support and resistance levels are 1155 and 1205 respectively.

Recommended
Recommended
More Related Content
What's hot
What's hot (20)
Viewers also liked
Viewers also liked (11)
Similar to NEPSE Technical Analysis Summary
Similar to NEPSE Technical Analysis Summary (20)
More from Kriti Capital & Investments Ltd.
More from Kriti Capital & Investments Ltd. (13)
Recently uploaded
Recently uploaded (20)
NEPSE Technical Analysis Summary
- 1. TECHNICAL ANALYSIS 1. Market Summary (as of September 24, 2015) NEPSE at close last week (September 24, 2015) 1176.86 NEPSE high last week (September 23, 2015) 1183.36 Weekly Change -19.16 points (or -1.53%) Daily Volume (Avg.) NPR 54.37 crores Total Traded Amount (weekly) NPR 163.09 crores RSI 55.79 MACD Line 19.65 Signal Line 26.55 2. Nepse Figure Nepse (June 1, 2014 – September 24, 2015)
- 2. 3. Trend Analysis The Nepse index experienced high volatility in the course of last week. The market lost 19.16 points (or down 1.53%) to close at 1176.86. The market was expected to trigger a bullish momentum in response to the announcement of the new constitution on Sunday (20th September). However, the market behaved rather strangely, and experienced negative volatility, which could lead to possible bearish trend. The current trend shows Nepse to be falling slightly, creating lower low in the support zone. Nonetheless, the 50-day moving average is well above the 200-day moving average, showing that the overall market trend looks good. The market is expected to continue its sideways movement in the coming days. 4. Resistance and Support Immediate Support 1155 Support 2 1083 Immediate Resistance 1205 Resistance 2 1240 The lowest Nepse went down to last week was at 1156.08. The market has been following a divergence movement with higher volatility, creating lower low in support level. The new support and resistance level stands at 1155 and 1205 respectively. 5. Trend Indicator a.) MACD The MACD is a momentum oscillator formed by using two different types of moving averages, which provides specific buying or selling signals. When a MACD line crosses above the signal line, it is considered to be a positive sign and indicates a time to buy, and vice-versa. Both the Macd, as well as the signal line, declined last week. The macd and signal line, at the beginning of the week, stood at 23.12 and 29.94 respectively. Macd is still moving below the signal line, signifying a bearish outlook. At the end of the week, the mcad and signal line closed at 19.65 and 26.55 respectively. b.) RSI RSI is a form of leading indicator that is believed to be most effective during periods of sideways movement. Such indicators may create numerous buy and sell signals that are useful when the market is not clearly trending upwards or downwards.
- 3. The RSI, at the beginning of the week, stood at 50.12 level. It hovered around the 50’s level throughout the week, indicating a neutral stance. But considering the long-term, it has been hovering above the 50’s level for the past few months, indicating that the market looks positive. Towards the end of the week the RSI lost 5.67 points to end at 55.79 level. c.) Bollinger Bands The Bollinger Band is a technical indicator that consists of a moving average (21-day) along with two trading bands above (upper band) and below it (lower band). The bands are an indication of volatility, which are represented by calculating standard deviation. The benchmark index experienced significant fall last week, touching the lower Bollinger band. This portrayed an oversell condition in the market for a short time period. However, Nepse moved up towards the mid band. The market volatility has decreased as compared to previous weeks. But the upper and lower bands showed signs of divergences towards the end of the week, indicating market volatility could increase again.
- 4. 6. Volume Indicator (On-Balance Volume) On-Balance Volume (OBV) is a momentum indicator that relates volume to the current price of the index or security. It measures buying and selling pressure at the market. It acts as a cumulative indicator that adds volume on up days and subtracts volume on down days. If a price increase is supported by OBV, it confirms an uptrend, whereas if a price decrease is supported by OBV, it confirms a downtrend. Last week, The benchmark index moved sideways whereas the OBV (On-Balance Volume) declined gradually. This signifies that higher volume transaction will decide the upward or downward trend of Nepse in the coming days. The average weekly volume transactions decreased slightly to NPR 54.37 from NPR 57.18 the week prior. The market will show an upward trend if the volume, as well as the index, increases in the coming weeks. 7. Overview The Nepse index ended in the red for most of last week. The benchmark index, lost 19.16 points (or down 1.53%) to close at 1176.86. The 50-day moving average (MA) is still moving above the 200-day MA, indicating that the overall outlook of the market looks good. However, the current trend shows Nepse to be falling slightly, creating lower low in the support zone. The average weekly volume transactions decreased to NPR 54.37 from NPR 57.18 the week prior. The RSI closed at 55.79 level, indicating a neutral stance. The Bollinger bands showed presence of market volatility as the upper and lower bands diverged slightly towards the end of the week. The new support and resistance level stands at 1155 and 1205 respectively.
- 5. k|fljlwsljZn]if0f !_ahf/ ;f/f+z -cflZjg&, @)&@ ;Ddsf]_ aGb cªs -cflZjg&, @)&@_ !!&^=*^ pRr cªs -uPsf] ;ftf_ !!*#=#^ ;fKtflxs kl/jt{g –!(=!^ -–!=%#k|ltzt_ b}lgscf};t Jofkf/ ¿=%$=#&s/f]8 s'n ;fKtflxsJofkf/ ¿ !^#=)( s/f]8 cf/P;cfO{ %%=&( PdP;L8L !(=^% l;UgnnfO{g @^=%% @_ ahf/ k|j[lt Nepse (June 1, 2014 – September 24, 2015)
- 6. #_ 6]«G8 ljZn]if0f uPsf] ;ftf g]K;] kl/;"rsdflgs} cl:y/tf b]lvof] . kl/;"rsdf !(=!^ cªssf] lu/fj6 b]lvof] . gofF ;+ljwfgsf] 3f]if0f ;Fu} ahf/ a9g] ;+Defjgf b]lvPklg /fhgLltstxdf b]lvPsf] hl6ntfsf] kmn:j?kahf/dflu/fj6 g} b]lvof] . lu/fj6 b]lvPtfklg kl/;"rsclxn]sf] nflucfkmgf] glhssf] 6]jfcªseGbfdfly g} /x]sf] 5 . s]xLcªsf] lu/fj6 b]lvPtfklg %) lbg] d'leËclxn] klg @)) lbg] d'leËPe/]h eGbfdfly g} /x]sf] x'Fbfxfnsf] nflu ;du| ahf/sf] l:ylt /fd|} blvG5 . cfufdL s]xL ;dosf] nflu kl/;"rsdf ;fO{8 j]h d'ed]G6 b]lvg] ;+Defjgfalnof] /x]sf] 5 . $_ 6]jftyfk|lt/f]w cªs glhssf] 6]jfcªs !!%% 6]jfcªs @ !)*# glhssf] k|lt/f]w cªs !@)% uPsf] ;ftf kl/;"rs ;a}eGbftn !!%^=)* cªs ;Ddk'Uguof] . xfnsf] nflu kl/;"rsdflgs} cl:y/tf b]lvPsf] 5 / gofF 6]jftyfk|lt/f]w cªsxfnsf] nflu !!%% tyf !@)% /x]sf] 5 . %_ g]K;] 6]«G8 ;"rs s_ d'leª Pe/]hsGeh]{G; 8fOeh]{G; -PdP;L8L_ PdP;L8Ldf b'O{ cf]6f /]vf x'G5g, h;df Pp6fn] ahf/sf] lbzf kl/jt{gsf] ;+s]t u5{ eg] csf]{n] ahf/sf] k|j[lQ -6«]08_ b]vfpg] u5{ . olb PdP;L8L /]vfn] l;Ung /]vfnfO{ tnaf6 dfly sf6]dfo;nfO{ ;sf/fTds ;+s]tsf ?kdflnO{G5 / o;n] z]o/x? lsGg] ;+s]t ub{5 . uPsf] ;ftfPdP;L8L nfO{gtyfl;UngnfO{gdflu/fj6 b]lvof] / PdP;L8L nfO{gn] uPsf] ;ftfvf;} kl/jt{gsf] ;+s]t b]vfPg . PdP;L8L nfO{g xfnsf] cj:yfdfl;UngnfO{g eGbftn /x]sf] tyfb'O{ nfO{g aLrdf a9]sf] b'/Ln] ;d]t ahf/ s]xL ;dosf] nflulaol/; b]lvG5 . xfnsf] nfluPdP;;L8L nfO{g tyfl;UgnnfO{g !(=^%tyf@^=%%df /x]sf] 5 .
- 7. v_ l/n]l6j :6«]Gy OG8]S; -cf/P;cfO{_ cf/P;cfO{ k|fljlwsljZn]if0fsf] o:tf] cf}hf/ xf], h;nfO{ Pstlkm{ ?kdfrln/x]sf] ahf/dfJofkf/ /0fgLlt agfpg a9L pkof]uL dflgG5 . To;}u/L, o;n] ahf/dfvl/b / ljlqmsf] :ki6 ;+s]t b]vfpg] u5{ . uPsf] ;ftfsf] z'?dfcf/P;cfO{ %)=!@cªsdf /x]sf]lyof] / ;ftfsf] w]/} h;f] sf/f]af/ lbgx? cf/P;cfO{ %)cªssf] xf/fxf/Ld} /xof] h;n] ahf/clxn] Go"6«n cj:yfdf /x]sf] ;+s]t ub{5 . ;d|udfcf/P;cfO{ %) cªstyf ;f] eGbfdfly g} /x]sf] x'Fbfahf/ cem} klg/fd|} l:yltdf /x]sf] ;+s]t ub{5 . ;ftfsf] cGTodfcf/P;cfO{ %%=&( /x]sf] lyof] . u_ af]lnªu/ Aof08 af]lnªu/ Aof08 Ps k|fljlwsljZn]if0f ;"rsxf] h;df @!–lbg] d'leËPe/]hsf ;fyb'O{ Aof08 -Pp6f dfly_ / Pp6f tn_ x'G5g . lo Aof08x?n] cl:y/tfsf] ;+s]t ub{5g, h'g :6fG88{ 8]leP;g u0fgf u/]/ kQfnufO{G5 . g]K;] kl/;"rsdfuPsf] ;ftflgs} g} lu/fj6 dxz'; ul/of] h;sf] kmn:j?k kl/;"rsn] tNnf] Jof08 ;d]t 5'g k'Uof] / ahf/df a]Rg] s|d w]/} b]lvof] . ;ftfsf] cGtolt/ kl/;"rsn] km]l/ dWo Jof08 5'g lt/ uof] . uPsf] ;ftf cl3Nnf] ;ftfeGbfahf/sf] cl:y/tfdf s]xLsdLcfof] t/ ahf/dfcfPsf] ptf/ r9fj ;Fu} cl:y/tf km]l/ a9g ;Sg] ;+s]t b]lvPsf] 5 .
- 8. ^_ eNo'd ;'rs -cg–Aofn]G; eNo'd_ cg–Aofn]G; eNo'd n] ahf/dflsGg] tyf a]Rg] k|];/sf] ;+s]t ub{5 . ;d|udf of] ;"rsn] ahf/ dflyuPsf] cj:yftyftnem/]sf] cj:yfdfahf/dfsf/f]af/sf] eNo'd s:tf] /xof] ;+s]t ub{5 .
- 9. xfnsf] cj:yfdfg]K;] kl/;"rsdf ;fO{8j]h d'Ed]G6 b]lvof] eg] cg–Aofn]G; eNo'ddf l:y/ kf/fdflu/fj6 b]lvof] . ;fy} sf/f]af/sf] eNo'dn] cfufdLlbgx?df g]K;] kl/;"rssf] 6]«G8 lg/wf0f{ ug]{ ;+Defjgfalnof] b]lvG5 . uPsf] ;ftfcf};t sf/f]af/ /sd ?= %&=!* s/f]8af6 36L ?= %$=#& s/f]8 /xguof] . g]K;] kl/;"rsdftyfsf/f]af/ ;+VofdflyuPdfahf/ km]l/ dflylt/ cSng] ;+Defjgfalnof] b]lvG5 . ;du{dfM uPsf] ;ftfg]K;] kl/;"rsdflu/fj6 g} b]lvof] h;sf] kmn:j?kahf/n] !(=!( cªsu'dfof] . xfnsf] cj:yfdf%) lbg] d'leËPe/]h @)) lbg] d'leËPe/]hnfO{ sf6L dfly lxl8/x]sf] cj:yf /x]sf] 5 h;n] ahf/;d|ddfce} klg /fd|} l:yltdf /x]sf] ;+s]t ub{5 . ;d|udf x]bf{ xfnsf] l:yltdf g]K;] kl/;"rscfkmgf] 6]jfcªssf] glhs /x]sf] cj:yf /xof] . cf};tsf/f]af/ /sd ? %&=!* s/f]8af636L ?=%$=#& s/f]8df /xguof] .%%=&(cªsdf /x]sf] cf/P;cfO{n] clxn] ahf/Go"6«n cj:yfdf /x]sf] ;+s]t ub{5 . pkNnf] tyftNnf] af]lnªu/ Jof08 aLrsf] b'/L a9g ;Sg] ;+Defjgfn]cl:y/tf a9g ;Sg] ;+Defjgf /x]sf] 5 . xfnsf] nflugofF 6]jfcªstyfk|lt/f]w cªs !!%%tyf !@)% /x]sf] 5 .