Nepse technical analysis jan 04 jan 08, 2015 (eng & nep)
•
0 likes•230 views

Technical analysis of Nepal Stock Exchange (Nepse) index for the week from Jan 04, 2015 to Jan 08, 2015. The technical analysis includes summary, RSI, MACD and Bollinger band analysis. The analysis is done by Kriti Capital & Investments Ltd.

Recommended
Recommended
More Related Content
What's hot
What's hot (20)
Viewers also liked
Viewers also liked (11)
Similar to Nepse technical analysis jan 04 jan 08, 2015 (eng & nep)
Similar to Nepse technical analysis jan 04 jan 08, 2015 (eng & nep) (14)
More from Kriti Capital & Investments Ltd.
More from Kriti Capital & Investments Ltd. (20)
Recently uploaded
Recently uploaded (20)
Nepse technical analysis jan 04 jan 08, 2015 (eng & nep)
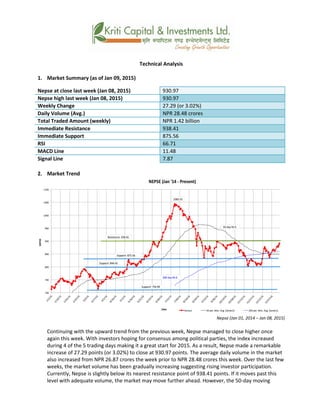
- 1. Technical Analysis 1. Market Summary (as of Jan 09, 2015) Nepse at close last week (Jan 08, 2015) 930.97 Nepse high last week (Jan 08, 2015) 930.97 Weekly Change 27.29 (or 3.02%) Daily Volume (Avg.) NPR 28.48 crores Total Traded Amount (weekly) NPR 1.42 billion Immediate Resistance 938.41 Immediate Support 875.56 RSI 66.71 MACD Line 11.48 Signal Line 7.87 2. Market Trend Nepse (Jan 01, 2014 – Jan 08, 2015) Continuing with the upward trend from the previous week, Nepse managed to close higher once again this week. With investors hoping for consensus among political parties, the index increased during 4 of the 5 trading days making it a great start for 2015. As a result, Nepse made a remarkable increase of 27.29 points (or 3.02%) to close at 930.97 points. The average daily volume in the market also increased from NPR 26.87 crores the week prior to NPR 28.48 crores this week. Over the last few weeks, the market volume has been gradually increasing suggesting rising investor participation. Currently, Nepse is slightly below its nearest resistance point of 938.41 points. If it moves past this level with adequate volume, the market may move further ahead. However, the 50-day moving
- 2. average is still below the 200-day moving average, which is normally indicative of a bearish scenario in the market. 3. RSI RSI is a form of leading indicator that is believed to be most effective during periods of sideways movement. Such indicators may create numerous buy and sell signals that are useful when the market is not clearly trending upwards or downwards. With the recent rise in Nepse, the RSI indicator has also followed the market in the upward direction. There has been greater demand for stocks in recent times, which is pushing the market near overbought level. This week, the RSI increased to 66.71 levels from 57.46 levels the week before. RSI (Jan 02, 2014 – Jan 08, 2015) 4. MACD The MACD is a momentum oscillator formed by using two different types of moving averages, which provides specific buying or selling signals. When a MACD line crosses above the signal line, it is considered to be a positive sign and indicates a time to buy, and vice-versa. Since the MACD line crossed above the Signal line on December 04, 2014, it indicated a buy signal and the momentum has been on an upward direction. Consequently, the MACD line also crossed above the zero line on December 16, 2014 suggesting further possibility of an uptrend. MACD (Jan 02, 2014 – Jan 08, 2015) 5. Bollinger Bands The Bollinger Band is a technical indicator that consists of a moving average (21-day) along with two trading bands above (upper band) and below it (lower band). The bands are an indication of volatility, which are represented by calculating standard deviation. On December 23, 2014, the Nepse line touched the mid-band (which acted as a support level) after which the index kept moving higher. The
- 3. steep rise in Nepse over the past two weeks suggests that the market is slightly overbought. Market volatility has also been on the higher side in recent times. Bollinger Bands (Jan 02, 2014 – Jan 08, 2015) Overview: The last two trading weeks has been a boon for the stock market as it has once again rallied by 27.29 points (or 3.02%) to close at 930.97 points. The market has been able to sustain itself as investors are hoping for political consensus. Currently, Nepse is slightly below its nearest resistance point of 938.41 points while the nearest support level is at 875.56 points. The volume situation in the market has been gradually improving as investors traded a total of NPR 1.42 billion this week. In the last two weeks, the rise in Nepse has pushed the RSI to 66.71 levels – moving it closer to the overbought zone. The MACD line is currently trending above the signal line suggesting a near term bullish momentum in the market in recent times. The Bollinger Bands currently indicate a slightly overbought scenario in the market. Overall, the secondary market has been in a bullish phase in the near term, however, certain indicators point to slightly overbought scenario. Also, the 50-day moving average maintaining below the 200-day moving average indicates that the long term trend has not been able to pick up in the positive direction.
- 4. k|fljlws ljZn]if0f ahf/ ;f/f+z -k'; @) b]vL k'if @$ ;Ddsf]_ aGb cªs -k'if @$_ M (#)=(& pRr cªs -k'if @$_ M (#)=(& ;fKtflxs kl/jt{g M @&=@( cªs -#=)@ k|ltzt_ b}lgs cf};t Jofkf/ M ¿= @*=$* s/f]8 s'n ;fKtflxs Jofkf/ M ¿= ! ca{ $@ s/f]8 tTsflng 6]jf M (#*=$! tTsflng k|lt/f]w M *&%=%^ cf/P;cfO{ M ^^=&! PdP;L8L M !!=$* l;Ugn nfO{g M &=*& %) tyf @)) lbg] d'leª Pe/]h cl3Nnf] xKtfsf] a9bf] k|j[lt k5ofpFb} g]K;] o; ;ftf klg pRr cªsdf aGb ePsf] 5 . nufgLstf{x?n] /fhgLlts bnx? lar ;xdtL x'g] cfzf u/]sfn], @)!% sf] /fd|f] ;'?jft ub}{, g]K;] % sf/f]af/ lbgx? dWo] $ sf/f]af/ lbg a9]sf] 5 . km:j?k, g]K;] @&=@( cªs -jf #=)@ k|ltzt_ n] a9]/ (#)=(& cªsdf aGb ePsf] 5 . o; ;ftf, b}lgs cf}ift Jofkf/ -ef]No"d_ klg @^=*& s/f]8 ?k}Fofaf6 a9]/ @*=$* s/f]8 ?k}Fof k'u]sf] 5 . kl5NNff] s]lx xKtfdf, ahf/sf] Jofkf/ -ef]No"d_ la:tf/} al9/x]sf] 5 h;n] nufgLstf{x?sf] ahf/df ;xeflutf a9]sf] ;+s]t u/]sf] 5 . xfn, g]K;] (#*=$! cªssf] k|ltzt cªs glhs /x]sf] 5 . olb g]K;]n] kof{Kt Jofkf/ - ef]No"d_ ;fy k|lt/f]w cªs kf/ u/]df eljiodf g]K;] yk a9g ;Sg]5 . t/, %)–lbg] d'leË Pe/]h ce}m klg @))–lbg] d'leË Pe/]h d'gL /x]sf] 5 h;n] ;fdfGotf dGbL ahf/sf] ;+s]t ub{5 . Nepse (Jan 01, 2014 – Jan 08, 2015)
- 5. l/n]l6j :6«]Gy OG8]S; -cf/P;cfO{_ cf/P;cfO{ k|fljlws ljZn]if0fsf] o:tf] cf}hf/ xf], h;nfO{ Pstlkm{ ?kdf rln/x]sf] ahf/df Jofkf/ /0fgLlt agfpg a9L pkof]uL dflgG5 . To;}u/L, o;n] ahf/df vl/b / ljlqmsf] :ki6 ;+s]t b]vfpg] u5{ . g]K;]df xfn ljBdfg j[l4 ;+u}, cf/P;cfO{ ;"rs klg ahf/ h:t} psfnf] lbzfdf /x]sf] 5 . xfnsf] ;dodf z]o/x?sf] dfu a9]sf] sf/0f ahf/ cf]e/a6 If]q glhs ws]lnPsf] 5 . o; ;ftf g]K;] %&=$^ cªsaf6 ^^=&! cªsdf a9]sf] 5 . RSI (Jan 01, 2013 – Jan 08, 2015) d'leª Pe/]h sGeh]{G; 8fOeh]{G; -PdP;L8L_ PdP;L8Ldf b'O{ cf]6f /]vf x'G5g, h;df Pp6fn] ahf/sf] lbzf kl/jt{gsf] ;+s]t u5{ eg] csf]{n] ahf/sf] k|j[lQ -6«]08_ b]vfpg] u5{ . olb PdP;L8L /]vfn] l;Ung /]vfnfO{ tnaf6 dfly sf6]df o;nfO{ ;sf/fTds ;+s]tsf ?kdf lnO{G5 / o;n] z]o/x? lsGg] ;+s]t ub{5 . l8;]Da/ )$, @)!$ df PdP;L8L /]vfn] l;Ugn /]vfnfO{ kf/ u/] kl5 o;n] z]o/ vl/bsf] ;+s]t u/]sf] lyof] / To; kl5 ahf/sf] k|j[lt a9g] lbzfdf /x]sf] 5 . kmn:j?k, PdP;L8L /]vfn] l8;]Da/ !^, @)!$ df z"Go /]vf kf/ u/]sf] lyof] h;n] ahf/ cem a9g] ;Dejgf /x]sf] ;+s]t u/]sf] 5 . MACD (Jan 01, 2014 – Jan08, 2015) af]lnªu/ Aof08 af]lnªu/ Aof08 Ps k|fljlws ljZn]if0f ;"rs xf] h;df @!–lbg] d'leË Pe/]hsf ;fy b'O{ Aof08 -Pp6f dfly_ / Pp6f tn_ x'G5g . lo Aof08x?n] cl:y/tfsf] ;+s]t ub{5g, h'g :6fG88{ 8]leP;g u0fgf u/]/ kQf nufO{G5 . l8;]Da/ @#, @)!$ df g]K;]n] dWo Aof08 5f]Psf] lyof] -h;n] ;dy{g txsf] ?kdf sfd u/]sf] lyof]_ . To; kZrft g]K;] kl/;"rs a9g yfn]sf] lyof] . g]K;]df kl5Nnf] b'O{ ;ftfdf cfPsf] ef/L j[l4n] ahf/ yf]/} cf]e/a6 cj:ydf /x]sf] ;+s]t u/]sf] 5 . xfnsf] ;dodf ahf/df cl:y/tf klg pRr /x]sf] 5 .
- 6. Bollinger Bands (Jan 01, 2014 – Jan 08, 2015) ;du{dfM clGtd b'O{ xKtf g]K;]sf nfuL a/bfg ;flat ePsf] 5 / of] @&=@( cªs -jf #=)@ k|ltzt_ n] a9]/ (#)=(& cªsdf aGb ePsf] 5 . nufgLstf{x?n] /fhgLlts ;xdltsf] cfzf u/]sfn] ahf/n] cfk'mnfO{ yfDg ;kmn /x]sf] 5 . xfn, g]K;] (#*=$! cªssf] k|lt/f]w cªs glhs /x]sf] hals lgs6 6]jf cªs *&%=%^ cªs /x]sf] 5 . ahf/df sf/f]af/df klg lj:tf/} ;'wf/ cfPsf] 5 / o; ;ftf nueu !=$@ ca{ ?k}Fof a/fa/ sf/f]af/ ePsf] 5 . kl5Nnf] b'O{ ;ftfdf, g]K;]df cfPsf] j[l4 sf sf/0f cf/P;cfO{ ^^=&! cªs k'u]sf] 5 h;n] ahf/nfO{ cf]e/a6 If]q glhs k'¥ofPsf] 5 . xfn PdP;L8L /]vf l;Ugn /]vf eGbf dfly sfod /x]sf] 5 h;n] xfnsf] ;dodf ahf/ a'ln; k|j[ltdf /x]sf] ;+s]t u/]sf] 5 . xfn, af]lnªu/ Aof08n] ahf/ yf]/} cf]e/a6 cj:yfdf /x]sf] ;+s]t u/]sf] 5 . ;du{df, bf];|f] ahf/ a'ln; r/0fdf /x]sf] 5 t/ s]lx ;"rsx?n] ahf/ cf]e/a6 cj:yfdf /x]sf] ;+s]t u/]sf] 5 . ;fy}, %)–lbg] d'leË Pe/]h @))–lbg] d'leË Pe/]h eGbf d'gL /x]sf] 5 h;n] ahf/sf] lb3{sfnLg k|j[ltn] ce}m ;sf/fTds lbzf lng g;s]sf] ;+s]t u/]sf] 5 .